
A Failure Prediction Platform for Internet of Things Applications
Daniel Del Gaudio, Amil Imeri and Pascal Hirmer
Institute for Parallel and Distributed Systems, University of Stuttgart, Universit
¨
atsstraße 38, Stuttgart, Germany
Keywords:
IoT, Robustness, Prediction, Machine Learning.
Abstract:
In the Internet of Things (IoT), interconnected devices communicate through standard Internet protocols to
reach common goals. The IoT has reached a wide range of different domains including home automation,
health, or manufacturing. With the rising amount of IoT applications, the demand for robustness is increasing
as well, which is a difficult issue especially in large IoT applications including hundreds or even thousands of
different devices. Devices tend to be very volatile and prone to failures. Usually, IoT devices are comprised
of cheap hardware components which enables the creation of larger applications but also leads to an increased
amount of failures that endanger operation of the IoT applications. To help in increasing robustness in the IoT,
in this paper, we introduce the Failure Prediction Prediction Platform (FPP) for Internet of Things applications,
which uses a machine learning based approach to predict failures. We evaluate our platform by showing how
different failure prediction algorithms can be integrated and applied.
1 INTRODUCTION
Today, the amount of Internet of Things (IoT) ap-
plications is growing rapidly (Vermesan and Friess,
2013). Whereas the IoT originally started emerging
mostly in home automation (Risteska Stojkoska and
Trivodaliev, 2017), it has now reached nearly every
domain of our daily lives, including traffic manage-
ment (Su et al., 2011), manufacturing (Chen et al.,
2018), health (Solanas et al., 2014), workplaces (Choi
et al., 2015), and so on. Internet of Things appli-
cations are comprised of heterogeneous cheap hard-
ware devices attached with sensors and actuators.
These devices communicate through standard Inter-
net protocols to reach common goals, e.g., to opti-
mize HVAC systems in a Smart Home. Through sen-
sors, different metrics of the environment are mea-
sured, which are then usually consumed and inter-
preted by an IoT platform middleware including dash-
boards, rule evaluation systems, or even sophisticated
machine learning techniques, e.g., for image recog-
nition. Based on the sensed data, adjustments in the
environment could be invoked, which are then real-
ized by the actuators, e.g., to turn on an AC or open a
window. Overall, IoT platforms play an essential role
in creating IoT applications.
However, with the increase of IoT applications,
the need for high robustness of these applications in-
creases as well (Rafiuzzaman et al., 2019; Soualhia
et al., 2019). At the start of the IoT hype, IoT appli-
cations comprised mostly self-made automation so-
lutions that did not lead to safety issues if a device,
sensor or actuator fails. Nowadays, however, IoT is
also used for safety critical applications, including
home security systems, traffic control, or automation
in manufacturing processes (Chen et al., 2018). In
such applications, device failures can lead to serious
safety issues that can lead to injuries or even death of
the persons involved, e.g., if a traffic light fails or a
production robot is malfunctioning. Hence, it has be-
come an important issue to ensure a high level of ro-
bustness, especially in commercial IoT applications.
In order to enable this, it is important to ensure
that IoT devices, their sensors, actuators, and network
connections are working properly. For this, different
monitoring systems have been developed that allow
recognition of any issues and a corresponding reac-
tion, e.g., by triggering a killswitch or notifying a
maintenance engineer. However, even if the failures
can be recognized timely, only reacting on failures
still leads to endangering the operation of IoT appli-
cations and, thus, to safety issues. Therefore, it is im-
portant to be able to react before any safety-critical
issues occur, which requires a predictive approach.
Our contributions are (i) an easy way to enhance
existing IoT platforms with failure prediction, (ii) we
show how data can be generated to train models for
failure prediction and (iii) we evaluate different ma-
Gaudio, D., Imeri, A. and Hirmer, P.
A Failure Prediction Platform for Internet of Things Applications.
DOI: 10.5220/0011033700003194
In Proceedings of the 7th International Conference on Internet of Things, Big Data and Security (IoTBDS 2022), pages 141-148
ISBN: 978-989-758-564-7; ISSN: 2184-4976
Copyright
c
2022 by SCITEPRESS – Science and Technology Publications, Lda. All rights reserved
141

chine learning algorithms whether they fit our failure
prediction goals. First, we introduce the architecture
of the Prediction Prediction Platform (FPP) and show
how it can be integrated with existing IoT platforms.
The FPP is designed generic and extensible to allow
using different data sets and machine learning models.
Furthermore, it is integrated with an adaptive dash-
board to visualize the prediction results to maintainers
of IoT environments. Second, we evaluate our plat-
form by showing how different failure prediction al-
gorithms can be integrated and applied. To train these
models, we use the built-in data generator of the FPP,
which can simulate device failures in IoT applications
in a realistic manner. The data comprises monitoring
data of IoT devices as well as of their surroundings
(e.g., air temperature, humidity, etc.).
2 RELATED WORK
Rafiuzzaman et al. (Rafiuzzaman et al., 2019) de-
scribe a failure prediction technique where memory
exhaustion is the cause for the failures of IoT devices.
General-purpose applications running on IoT devices
are typically not optimized for their constraints and
often result in failures due to memory exhaustion.
The presented technique uses the kNN algorithm to
make predictions with different lead times. As part
of the solution, Rafiuzzaman et al. created a concept
called MARK (Monitor and Analyze Resource Keys)
where the data is collected from the devices, is pro-
cessed, and then provided to the kNN-based predic-
tion model. The heterogeneity of the IoT devices asks
for pre-processing of the monitored data before anal-
ysis steps. Hence, our FPP will be equipped with a
pre-processing component as well.
Soualhia et al. (Soualhia et al., 2019) present a
framework for fault detection and prediction in edge
cloud environments by using machine learning and
statistical techniques. The focus of the paper is to
evaluate the framework on HP servers by detecting
and predicting recurrent and accumulative faults (e.g.,
CPU, HDD, memory and network faults). They also
performed the evaluation on Raspberry Pis with CPU
fault prediction and memory stress prediction by us-
ing CNN, LSTM, a type of RNN, and their combina-
tions. Based on the results, the framework is suit-
able to detect and predict different faults in reasonable
time. The framework also contains a pre-processing
component, which the authors indicate as a crucial
component that reduces the overhead costs and im-
proves the performance.
Wireless communication of IoT devices can also
be a cause for failures. Suga et al. (Suga et al., 2019)
describe a method to calculate the QoS (Quality of
Service) outage probability for wireless communica-
tion. The authors indicate that ML-based predictions
of the QoS values cannot be accurate and sufficient
if the communication failures are rare in the train-
ing process, which is typically the case. The de-
scribed method uses QoS values predicted with PNN,
error distribution of different rarity classes, and the re-
quired QoS as a threshold to estimate the outage prob-
ability. Suga et al. achieve a high prediction accuracy
after evaluating the method in an automobile factory
scenario, using different wireless station nodes and a
simulated WLAN throughput.
Ara et al. (Ara et al., 2020) use ARIMA (Auto-
Regressive Integrated Moving Average) to predict fail-
ures in wireless sensor nodes. ARIMA uses recog-
nized patterns in the collected time series data to pre-
dict future faults. The authors evaluate the model by
polluting a sensory dataset, simulating faults and cre-
ating specific patterns. Furthermore, the data goes
through different pre-processing steps to achieve op-
timal results. The method is shown to be more useful
for short-term rather than long-term predictions.
Lian et al. (Lian et al., 2019) describe an ageing
monitoring and lifetime prediction system for IoT de-
vices. The ageing of Integrated Circuit (IC) technol-
ogy in IoT devices may be specific for each device or
it may depend on the environment. The system pre-
sented by Lian et al. collects information from each
device continuously and then stores and processes
the data in the cloud creating an IC-specific ageing
model. Based on the ageing model, the lifetime of the
particular device can be predicted. Another benefit
of the cloud, stated by the authors, is the central col-
lection of ageing information for all ICs of the same
type, enabling simple identification of abnormalities.
We conclude that there exist many well working
algorithmic approaches using machine learning and
statistical methods to detect and predict failures in
IoT environments. Nonetheless, these approaches are
based on a specific dataset and environment. We in-
troduce the FPP to easily apply such methods for fail-
ure prediction in different environments and integrate
them with existing IoT platforms.
3 FAILURE PREDICTION
PLATFORM
To integrate machine learning algorithms into IoT
environments with the goal to detect arising fail-
ures, we developed the Failure Prediction Plat-
form (FPP), which builds on top of IoT platforms,
such as the Multipurpose Binding and Provisioning
IoTBDS 2022 - 7th International Conference on Internet of Things, Big Data and Security
142
ML Module
Model Repository
IoT Environment
(Devices/Sensors/Actuators)
Controller
Data
Processing
Sensor Data
Broker
Data API
Algorithm
Device and Sensor
Data Store
Data API
Data
Preprocessing
Dashboard
Adapter
Result API
IoT Platform
Failure Prediction Platform
Data
Generation
Figure 1: Overall architecture of the Failure Prediction Platform.
Platform (MBP) (Franco da Silva et al., 2020), which
we use for evaluation purposes.
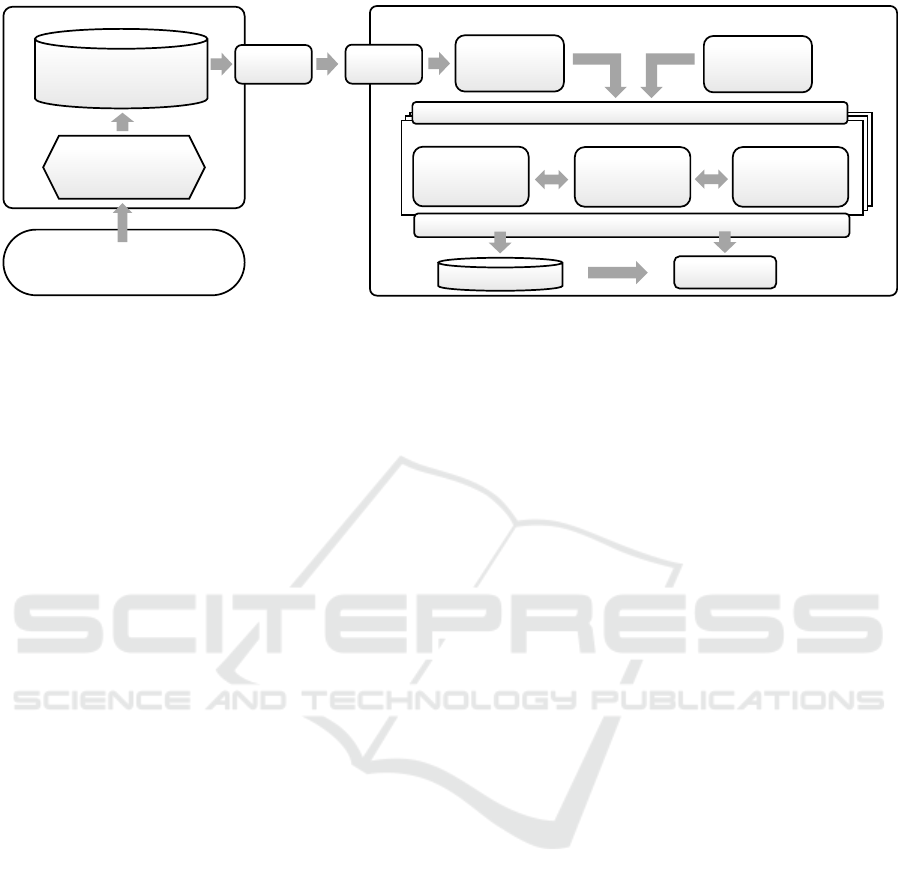
We divided the architecture into two main com-
ponents, depicted in Figure 1. The first component
is the IoT Platform, according to our research and
experience (left in Figure 1). The second component
is the FPP (right in Figure 1).
IoT Platform Architecture. The FPP assumes
the existence of an IoT platform as illustrated in a
simplified manner on the left part of Figure 1. The
IoT platform receives the data from the IoT environ-
ment, which is generated by sensors and actuators
(sensor data), or directly from the devices, such as
CPU and memory utilization, as well as general meta
information about the devices (device data).
IoT platforms typically use a sensor data broker
that receives data from all the different devices in the
IoT environment. Furthermore, there can be a device
and sensor data store which permanently stores the
received data from the environment. Usually, those
two basic components are part of IoT platforms. The
IoT platform can explicitly provide a data API com-
ponent with access to its data, or a direct connection
to the broker and database can be established.
FPP Architecture. The right part of Figure 1
shows the composition of FPP. The adapter compo-
nent decouples the FPP from specific IoT platform
implementations and retrieves the data that will be
used by the models. After the data is retrieved by the
adapter, in the next step, the data can be processed
in the data pre-processing component before it is
used by the models. It can be standardized using
a pre-defined data template, enriched with missing
information, transformed to a specific format, or
adapted in any other way. Standardizing the data
using a template leads to data consistency, which
further eases the implementation of the models. This
component is required when dealing with heteroge-
neous data and conducts the processing needed by
all the models. Assuming the data arrives as entries
with timestamps, it can be used to extract meaningful
information from the timestamp, such as hour of
the day, weekday, holiday, etc. An alternative data
source to train the ML algorithms is the data gener-
ation component. Its possible usage is described in
Section 4.
Each ML model is integrated as a module (cf. Ma-
chine Learning Module in Figure 1) consisting of five
main components: Data API, data processing compo-
nent, controller, the actual ML algorithm, and the Re-
sult API. The Data API has the same composition for
all modules and consumes previously preprocessed
data. The Data API decouples the ML modules from
the platform. Although there is a generic data pre-
processing component in the previous step, different
types of ML algorithms require the data to be in dif-
ferent formats. Therefore, an additional data process-
ing component is integrated within each module that
should prepare the data for the specific algorithm. The
algorithm itself is the core of the module. It creates a
model that is used or predictions by machine learning
from the input data. It can be implemented in various
ways and with different libraries, but it should pro-
vide a training and prediction interface. Finally, all
the components are orchestrated by the controller that
has multiple purposes. It processes the commands re-
ceived from the outside and performs the correspond-
ing actions. It receives the data, forwards it to the
processing component if necessary, and then to the al-
gorithm. It can implement automated hyperparameter
tuning to find the optimal parameters, i.e., the most
optimal configuration of the algorithm based on the
provided data. The controller also saves and loads
data to the database or file system. It can implement
a scheduler to periodically create backups, retrain the
algorithm if online learning is not possible, or retune
A Failure Prediction Platform for Internet of Things Applications
143

Table 1: Excerpt of the generated dataset.
timestamp
hour
weekday
running days
cpu
memory
storage
cpu temp
temperature
humidity
air conditioner
heater
failure
10.05.2021 15:21:07 15 0 0 30 70 50 50.0 18.0 40.0 0 0 0
10.05.2021 15:21:08 15 0 0 27 70 50 50.0 18.0 40.0 0 0 0
the parameters. The Result API sends the results of
the model and status or progress information to the
Model Repository and Dashboard.
The Model Repository describes a storage shared
by all the models. The storage can be a database, a
file system, or a combination. The main purpose is
to store the description and the configuration of the
algorithms, the hyperparameters after tuning, or the
complete ML models, i.e., internal parameters after
learning. It can also store any other model-relevant
information. It is accessed over the API components
of the modules and over the dashboard.
After an ML model is finalized and can be used
to make predictions, the corresponding module also
sends the results to the dashboard, which collects
all the predictions from different models, processes
them and visualizes the results. Furthermore, mod-
ules can send status and progress information to the
dashboard. The dashboard should also provide the
possibility to interact with the modules and execute
individual steps manually. The steps may include:
importing history, starting automated hyperparame-
ter tuning, training individual algorithms, starting and
stopping individual model predictions, saving and
loading models, etc. Furthermore, the dashboard ac-
cesses the model repository to retrieve and show the
relevant model information in the UI. The dashboard
can also be used to insert information during the
model registration process. Finally, a maintainer ob-
serves the dashboard and performs repairs or replace-
ments in the IoT environment. A notification system
can also be implemented to inform the maintainer if
some device is in the process of failing or has reached
its critical thresholds based on the predictions.
In our prototype, we use Apache Kafka for loosely
coupled communication between different compo-
nents and JSON to serialize data. Therefore, ML
modules should implement a Kafka consumer and be
able to serialize and deserialize JSON. Furthermore,
the data sets that are used to train the models should
at least contain a timestamp and a column with a flag
whether the row denotes a failure or not.
4 DATA GENERATION
Real-world IoT data comprises relatively rare device
failures that could be used to train ML algorithms for
failure prediction. Combined with the short time in-
terval of data measurements that are required for some
metrics, such as CPU or memory utilization, this leads
to huge amounts of data with a very small number of
failures. This huge amount of data is not likely to fit
in the memory, and solutions, such as online learning,
would typically require a very long time to execute.
Therefore, we made the choice to generate synthetic
data that has the characteristics of real IoT data. These
characteristics include:
(i) Data Volume: The entries are generated with an
interval of 1 second, the duration is restricted to two
weeks. This results in roughly 1.2 million entries.
(ii) Number of Failures: In contrast to real data, the
failures were increased from hundreds to a few thou-
sands to be able to properly train the algorithms.
(iii) Included Timestamp, Environment Data,
Monitoring Data and Failures: The data includes
measures with discrete values but also measures that
monitor continuous values. In practice, sensors and
actuators provide data about the environment, while
the devices communicate their internal health state.
An automated system or a maintainer records the fail-
ures.
The first five entries of our generated dataset are
shown in Table 1. Excluding timestamps and failures,
there are 11 features divided in 3 categories: time,
monitoring and environment features. Time features
include hour, weekday and running days, which is the
number of successive days without a failure. These
features can usually be extracted from the timestamp
during the pre-processing step. Besides hour and
weekday, it is also possible to get further information
from the timestamp, such as minutes, months or holi-
days. Monitoring features provide information about
the device itself. These are CPU utilization, mem-
ory utilization, storage occupancy and CPU tempera-
ture. Finally, environment features represent the con-
text data of the environment retrieved from sensors
IoTBDS 2022 - 7th International Conference on Internet of Things, Big Data and Security
144
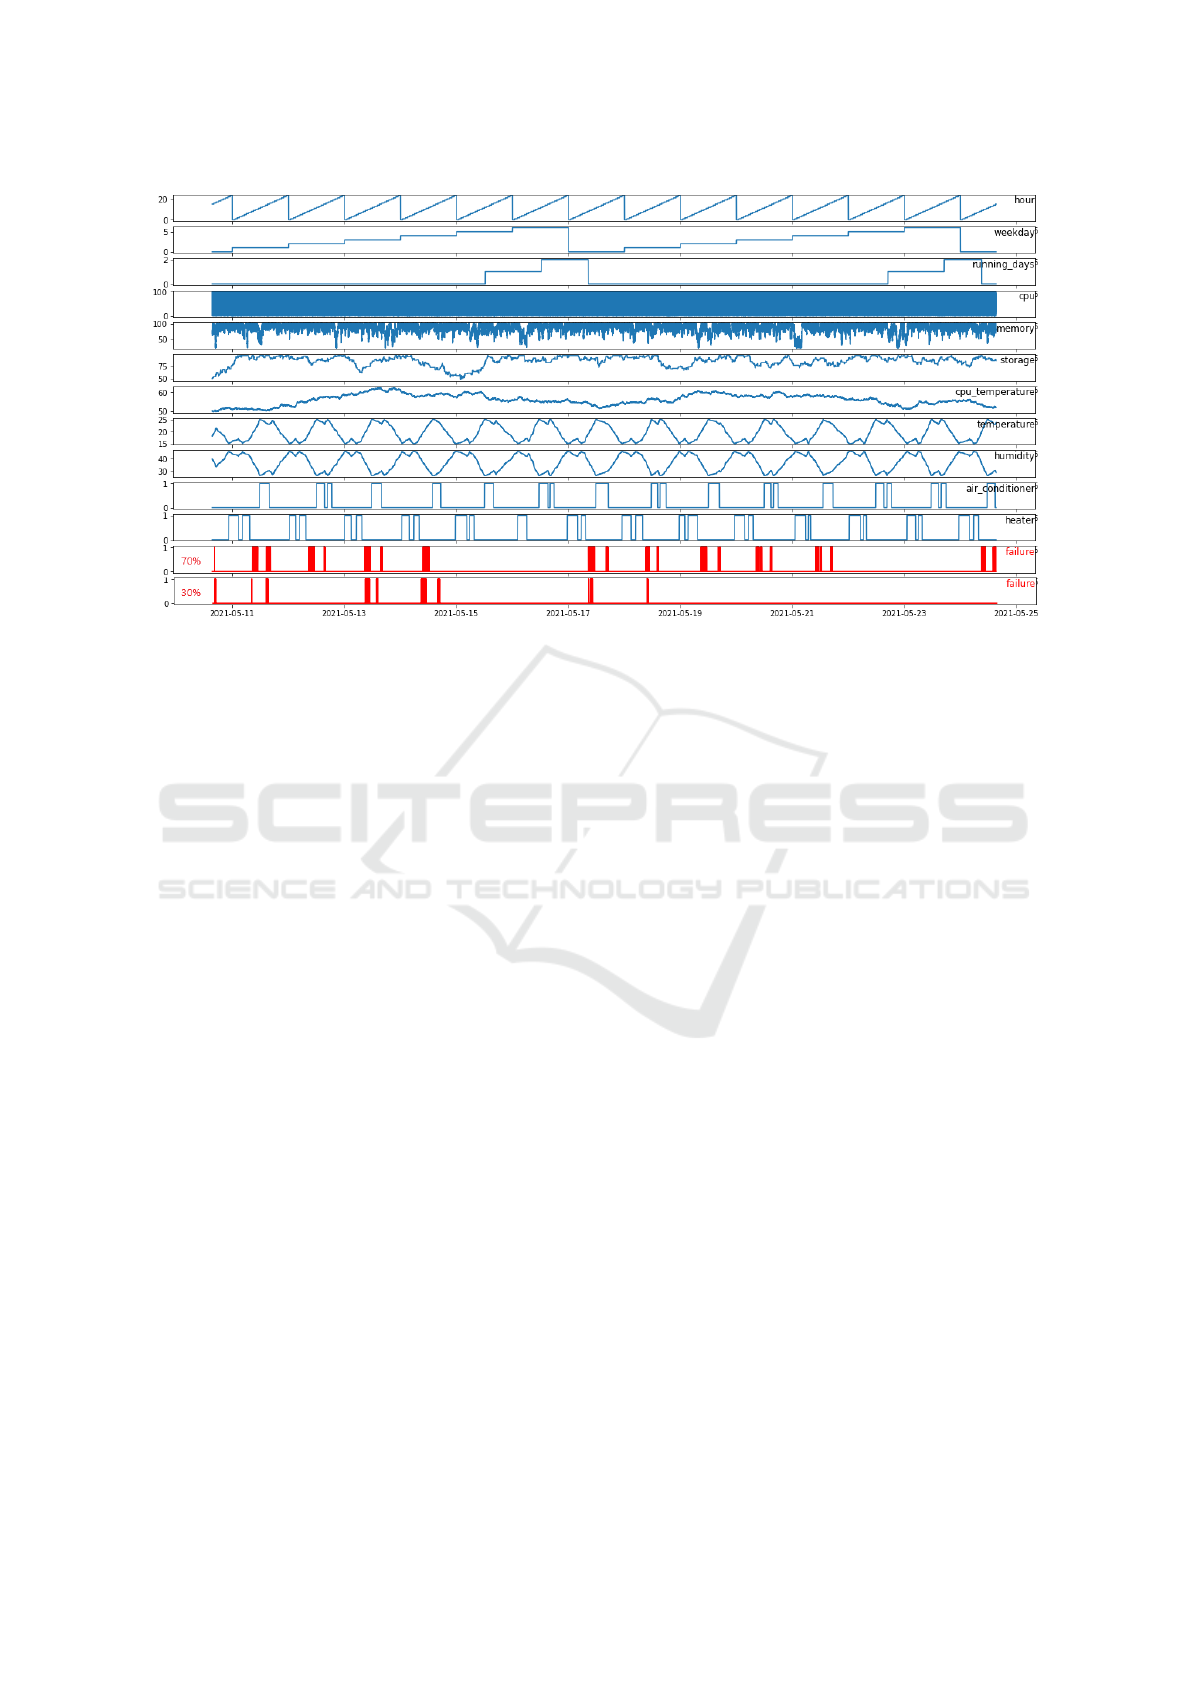
Figure 2: Data patterns of the generated dataset.
and actuators. These include temperature, humidity,
air conditioner and heater.
All values are generated as numeric values to
avoid the encoding later on. This also includes week-
days, which start with 0 (Monday) and end with
6 (Sunday). Storage occupancy, as well as CPU
and memory utilization, are displayed in percentages.
CPU temperature, environment temperature and hu-
midity are decimal numbers with one digit after the
decimal point. The temperatures are portrayed in de-
grees Celsius and humidity in percentage. Air condi-
tioner and heater can have the values 0 meaning off
or 1 meaning on. In case of failures, 1 stands for fail-
ure and 0 for no failure. The failure value in a data
entry should be interpreted as the condition of the de-
vice after all the other measures were sent. In case
of a failure, it is the last data sent by the device which
can provide information why the failure occurred. Al-
though the data is synthetic, an attempt was made to
make it as real as possible.
Figure 2 illustrates the emerged patterns of the
generated data. CPU utilization is not clearly observ-
able because of the very frequent and broad changes.
Memory utilization, on the other hand, changes less
frequently and remains in the range of 80%. The us-
age of the storage increases over time with a slow
rate and random ups and downs. CPU temperature
remains in a normal range with a low changing rate.
There is no particular relation between the monitoring
features. In contrast, the environment features depend
on each other, mostly on the temperature value. The
temperature depends on the time of the day, it starts
increasing in the morning and decreasing in the af-
ternoon. Additionally, it is limited by the air condi-
tioner and heater. At 25°C, the air conditioner is ac-
tivated and remains active until the temperature drops
to 23°C. Similarly, the heater is activated at 15°C and
remains active until the temperature rises to 17°C.
This results in a clearly visible patterns shown in Fig-
ure 2. Humidity depends only on the temperature
value and has no random changes, resulting in a kind
of inverted pattern.
A failure occurs during working days between 8
and 16 o’clock. Furthermore, CPU and memory uti-
lization need to be above 92%, CPU temperature over
50.1°C, and the environment temperature between
19°C and 23.5°C. Note that the temperature never ex-
ceeds 25°C because of the air conditioner. Setting the
limit to 23.5°C covers both cases, failures for which
the air conditioner is off and failures for which it is
on. The heater is always off. Humidity and storage
have no direct influence on the failures. There is no
reason for choosing this specific data condition for a
failure, the algorithms should be able to detect pat-
terns regardless of the type of the failure. However,
the ranges were chosen to get an appropriate number
of failures.
To compare the selected ML algorithms, two dif-
ferent datasets were generated. In the first one, the
failures occur 70% of the time when the specified data
condition is met. In the second one, 30% of the time.
The first one should show the performance of the al-
gorithms when there are enough failures to learn (ap-
proximately 4000), the second one should show their
performance on a low number of failures (approxi-
mately 500).
A Failure Prediction Platform for Internet of Things Applications
145

Table 2: Evaluation metrics for classification (Hossin and M.N, 2015; Sokolova and Lapalme, 2009; Ferri et al., 2009).
Metric Formula Description
Precision
T P
T P+FP
Ratio of correct positive predictions to
overall positive predictions.
Recall
T P
T P+FN
Ratio of correct positive predictions to
total positives.
F1 Score 2 ·
P·R
P+R
Harmonic mean of precision and recall.
TP = True Positive; TN = True Negative; FP = False Positive; FN = False Negative;
5 EVALUATION
To evaluate the FPP and failure prediction ca-
pabilities in IoT environments, we applied the
following algorithms to our generated data: k-
Nearest Neighbor (kNN) (Aggarwal, 2015), Deci-
sion Tree (DT) (Jiang et al., 2013), Random For-
est (RF) (Wang et al., 2009), Extreme Gradient
Boosting (XGB) (Chen and Guestrin, 2016; Fried-
man, 2001), Naive Bayes (NB) (Hastie et al.,
2009), Support Vector Machine (SVM) (Bordes and
Bottou, 2005), Logistic Regression (LGR) (Paul
and Ueno, 2020), Stochastic Gradient Descent
(SGD) (Ketkar, 2017; Zhang, 2004), Multi-Layer Per-
ceptron (MLP) (Goodfellow et al., 2016) and Long
Short-Term Memory (LSTM) (Goodfellow et al.,
2016). The evaluation shows the suitability of each
algorithm to build a model based on IoT data as de-
scribed in Section 4 and validates our architecture.
5.1 Evaluation Metrics
The majority of the ML algorithms we evaluated are
binary classification algorithms on imbalanced data,
thus, we chose the metrics F1 score and precision.
Both are described in Table 2.
F1 score typically performs better on imbal-
anced data compared to other metrics like accu-
racy and ROC AUC (Bekkar et al., 2013; Saito and
Rehmsmeier, 2015). Furthermore, F1 score cap-
tures both precision and recall into a single measure.
To treat both classes with equality, the macro aver-
age of the F1 score is used (Opitz and Burst, 2021;
Narasimhan et al., 2016). It is estimated by comput-
ing the F1 scores for both classes and finding their
unweighted mean. Macro F1 is also used as a met-
ric for the hyperparameter tuning. The values range
from 0 (worst result) to 1 (best result). The precision
in predicting failures is measured as well. It is used to
better understand the results, as it directly correlates
to the failure probability in the generated datasets.
5.2 Results
The algorithms were initially trained and evaluated on
the dataset with the 70% failure probability for the
specified failure condition.
The original data representation shows that the
tree-based algorithms DT, RF and XGB provide the
best results, followed by kNN and NB. The F1 score
of 0.9 is considered a very good result. The results are
worse for NN, MLP and LSTM, and linear classifiers
SVM, LGR and SGD, which have the worst predic-
tion performance. They were able to recognize the
failure patterns by using only a small representation
of non-failures. Since the failures are injected with
the probability of 70%, a precision of 0.7 is consid-
ered good. There are no significant changes in the
performance order of the algorithms compared to the
F1 score. However, MLP shows very good precision
results, meaning that the lower F1 score can be ex-
plained with the low prediction performance on non-
failures.
In the second dataset, the failures are injected with
the probability of 30% for the specified failure condi-
tion. As the number of failures is very low, it is in-
teresting to see how the algorithms behave if there is
limited data to learn. Compared to the results of the
previous dataset, there are some similarities but also
noticeable changes. A noticeable change is that the
results of MLP and LSTM are on the same level with
the linear classifiers, which again have the worst pre-
diction performance.
The evaluation results presented in this section are
summarized in Table 3. The table shows only the
highest values for macro F1 and precision across the
different data representations. Additionally, the av-
erage for the two datasets is computed. The tree-
based algorithms have the highest prediction perfor-
mance, while the linear classifiers perform the worst.
For these particular datasets, a simple DT is enough
to get the optimal prediction results, and it also re-
quires short training and prediction time. The overall
IoTBDS 2022 - 7th International Conference on Internet of Things, Big Data and Security
146
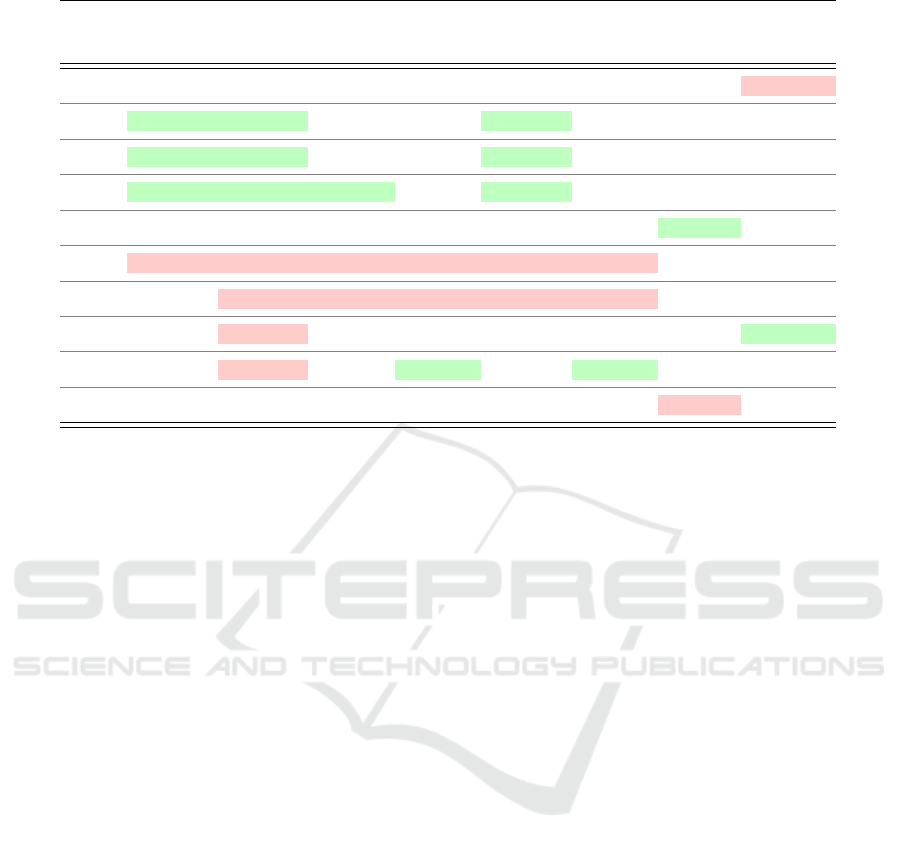
Table 3: Evaluation results.
Alg.
Macro F1
70%
Macro F1
30%
Precision
70%
Precision
30%
Macro F1
Average
Precision
Average
Training
time
Prediction
time
kNN 0.86 0.62 0.69 0.29 0.74 0.49 7.478 10.51
DT 0.91 0.71 0.69 0.27 0.81 0.48 1.297 0.022
RF 0.91 0.71 0.69 0.27 0.81 0.48 12.06 0.633
XGB 0.91 0.71 0.70 0.27 0.81 0.49 27.12 0.070
NB 0.86 0.68 0.66 0.23 0.77 0.45 0.634 0.147
SVM 0.59 0.52 0.11 0.02 0.56 0.07 2.748 0.016
LGR 0.60 0.52 0.11 0.02 0.56 0.07 116.1 0.019
SGD 0.62 0.52 0.14 0.03 0.57 0.09 17.09 0.014
MLP 0.79 0.52 0.68 0.32 0.66 0.50 244.2 0.319
LSTM 0.80 0.66 0.44 0.21 0.73 0.33 334.7 0.812
For macro F1 and precision, the highest value across data representations is selected.
results should be interpreted with caution, as they de-
pend on the dataset and the parameter configuration
of the algorithms. Providing more time for parameter
tuning and data for training, the results of the other
algorithms can also be improved.
Furthermore, the training and prediction time of
the algorithms was measured. To compare the al-
gorithms, we used the best parameter configuration
for each algorithm. The time was measured on the
70% dataset, by using 75%-25% train-test split with-
out cross-validation. It is performed on a machine
with a 2.60 GHz CPU and 24 GB RAM. The results
are listed in Table 3. The slowest algorithms regard-
ing the training time are MLP and LSTM, followed
by LGR. The results for NNs are as expected, since
they are typically slow to train because of their com-
plexity (Aggarwal, 2015). The fastest algorithms re-
garding training time are DT, NB and SVM, which
require less than 3 seconds for 907200 entries. Pre-
diction time is much faster than training. However,
because kNN is a lazy learner, its prediction takes
longer than training for this particular data split. With
the total time of over 10 seconds, it is the slowest al-
gorithm. The fastest algorithms are DT and the linear
classifiers, with prediction time under 0.03 seconds.
The prediction was performed on 302400 entries.
6 SUMMARY AND OUTLOOK
In this paper, we introduced the Failure Prediction
Platform, which uses a machine learning based ap-
proach to predict failures. The FPP architecture allow
easy integration with different IoT platforms or other
data sources. In order to send data to the FPP, de-
facto standards, such as Apache Kafka, can be used.
The FPP offers data pre-processing capabilities, a data
generator to train machine learning models, a plat-
form to apply and run these models, and a dashboard
for visualization of the prediction results. Due to the
modular design of our FPP architecture, different al-
gorithms can easily be exchanged or they can be run
simultaneously. Our platform helps to integrate ma-
chine learning algorithms into typical IoT platforms.
This simplifies the development and research on ma-
chine learning algorithms for failure detection in IoT
environments. Furthermore, our data generation com-
ponent speeds up the learning process for these algo-
rithms, leading to faster results. Nevertheless, the al-
gorithms can be improved by further learning from
real data, using the FPP. For evaluation purposes, we
showed how to apply different algorithms for failure
prediction in the IoT using the FPP. We integrated dif-
ferent algorithms into the platform, trained and exe-
cuted them based on the FPP data generator.
In future work, we plan to apply the FPP to a real
scenario and evaluate which algorithms are most use-
ful in predicting failures in IoT environments. We fur-
ther consider the distinction of real data and injected
false data by training the models accordingly.
A Failure Prediction Platform for Internet of Things Applications
147

REFERENCES
Aggarwal, C. C. (2015). Data mining: the textbook.
Springer.
Ara, T., M, P., and Bali, M. (2020). Fault prediction in
wireless sensor networks using soft computing. In
2020 International Conference on Smart Technologies
in Computing, Electrical and Electronics (ICSTCEE),
pages 532–538.
Bekkar, M., Djemaa, H. K., and Alitouche, T. A. (2013).
Evaluation measures for models assessment over im-
balanced data sets. J Inf Eng Appl, 3(10).
Bordes, A. and Bottou, L. (2005). The Huller: a simple and
efficient online SVM. In Machine Learning: ECML
2005, Lecture Notes in Artificial Intelligence, LNAI
3720, pages 505–512. Springer Verlag.
Chen, B., Wan, J., Shu, L., et al. (2018). Smart Factory
of Industry 4.0: Key Technologies, Application Case,
and Challenges. IEEE Access, 6:6505–6519.
Chen, T. and Guestrin, C. (2016). XGBoost: A Scalable
Tree Boosting System. In Proceedings of the 22nd
ACM SIGKDD International Conference on Knowl-
edge Discovery and Data Mining, KDD ’16, page
785–794, New York, NY, USA. Association for Com-
puting Machinery.
Choi, M., Park, W.-K., and Lee, I. (2015). Smart office en-
ergy management system using bluetooth low energy
based beacons and a mobile app. In IEEE Interna-
tional Conference on Consumer Electronics (ICCE),
pages 501–502.
Ferri, C., Hern
´
andez-Orallo, J., and Modroiu, R. (2009).
An experimental comparison of performance mea-
sures for classification. Pattern Recognition Letters,
30(1).
Franco da Silva, A. C., Hirmer, P., Schneider, J., et al.
(2020). MBP: Not just an IoT Platform. In IEEE In-
ternational Conference on Pervasive Computing and
Communications Workshops (PerCom Workshops).
Friedman, J. H. (2001). Greedy Function Approximation: A
Gradient Boosting Machine. The Annals of Statistics,
29(5):1189–1232.
Goodfellow, I., Bengio, Y., and Courville, A. (2016). Deep
Learning. MIT Press.
Hastie, T., Tibshirani, R., and Friedman, J. (2009). The el-
ements of statistical learning: data mining, inference,
and prediction. Springer Science & Business Media.
Hossin, M. and M.N, S. (2015). A Review on Evaluation
Metrics for Data Classification Evaluations. Interna-
tional Journal of Data Mining & Knowledge Manage-
ment Process, 5:01–11.
Jiang, F., Sui, Y., and Cao, C. (2013). An incremental de-
cision tree algorithm based on rough sets and its ap-
plication in intrusion detection. Artificial Intelligence
Review, 40(4):517–530.
Ketkar, N. (2017). Stochastic Gradient Descent, pages 113–
132. Apress, Berkeley, CA.
Lian, G., Chen, W., and Huang, S. (2019). Cloud-based on-
line ageing monitoring for iot devices. IEEE Access,
7:135964–135971.
Narasimhan, H., Pan, W., Kar, P., et al. (2016). Optimiz-
ing the Multiclass F-Measure via Biconcave Program-
ming. In IEEE 16th International Conference on Data
Mining (ICDM), pages 1101–1106.
Opitz, J. and Burst, S. (2021). Macro F1 and Macro F1.
Paul, T. and Ueno, K. (2020). Robust Incremental Lo-
gistic Regression for Detection of Anomaly Using
Big Data. In 19th IEEE International Conference on
Machine Learning and Applications (ICMLA), pages
1167–1173.
Rafiuzzaman, M., Gascon-Samson, J., Pattabiraman, K.,
et al. (2019). Failure Prediction in the Internet of
Things Due to Memory Exhaustion. In Proceedings of
the 34th ACM/SIGAPP Symposium on Applied Com-
puting, SAC ’19, page 292–301, New York, USA. As-
sociation for Computing Machinery.
Risteska Stojkoska, B. L. and Trivodaliev, K. V. (2017). A
review of Internet of Things for smart home: Chal-
lenges and solutions. Journal of Cleaner Production,
140:1454–1464.
Saito, T. and Rehmsmeier, M. (2015). The Precision-Recall
Plot Is More Informative than the ROC Plot When
Evaluating Binary Classifiers on Imbalanced Datasets.
PLOS ONE, 10(3):1–21.
Sokolova, M. and Lapalme, G. (2009). A systematic analy-
sis of performance measures for classification tasks.
Information Processing & Management, 45(4):427–
437.
Solanas, A., Patsakis, C., Conti, M., et al. (2014). Smart
health: A context-aware health paradigm within smart
cities. IEEE Communications Magazine, 52(8):74–
81.
Soualhia, M., Fu, C., and Khomh, F. (2019). Infrastructure
Fault Detection and Prediction in Edge Cloud Envi-
ronments. In Proceedings of the 4th ACM/IEEE Sym-
posium on Edge Computing, SEC ’19, page 222–235,
New York, NY, USA. Association for Computing Ma-
chinery.
Su, K., Li, J., and Fu, H. (2011). Smart city and the appli-
cations. In International Conference on Electronics,
Communications and Control (ICECC), pages 1028–
1031.
Suga, N., Yano, K., Webber, J., et al. (2019). Prediction
of QoS Outage Probability for Wireless Communica-
tion in Factory Environments. In International Con-
ference on Internet of Things, Embedded Systems and
Communications (IINTEC), pages 124–129.
Vermesan, O. and Friess, P., editors (2013). Internet of
Things: Converging Technologies for Smart Environ-
ments and Integrated Ecosystems. River Publishers
Series in Communication. River, Aalborg.
Wang, A., Wan, G., Cheng, Z., and Li, S. (2009). An in-
cremental extremely random forest classifier for on-
line learning and tracking. In 16th IEEE International
Conference on Image Processing (ICIP), pages 1449–
1452.
Zhang, T. (2004). Solving Large Scale Linear Prediction
Problems Using Stochastic Gradient Descent Algo-
rithms. In Proceedings of the Twenty-First Interna-
tional Conference on Machine Learning, ICML ’04,
page 116, New York, NY, USA. Association for Com-
puting Machinery.
IoTBDS 2022 - 7th International Conference on Internet of Things, Big Data and Security
148
