
Driving Events Identification and Operational Parameters
Correlation based on the Analysis of OBD-II Timeseries
Dimitrios Rimpas
1a
and Andreas Papadakis
2b
1
Department of Electrical and Electronics Engineering, University of West Attica, Egaleo, Athens, Greece
2
Department of Electrical and Electronics Engineering Educators, School of Pedagogical and Technological Education,
Athens, Greece
Keywords: OBD-II, Driving Event Identification, Gear Change, Timeseries, Correlation.
Abstract: On board diagnostics, OBD-II, allowsmonitoring and understanding of the engine operations through
continuous access to engine sensors, detection and diagnosis of errors. In this work, we select a set of OBD-
II parameters, Short-Term Fuel Trim, Manifold Absolute Pressure, Absolute Throttle Position, Revolutions
Per Minute, Calculated Engine Load, Engine Coolant temperature, Vehicle Speed, Catalytic Converter
Temperature, to create a set of driving timeseries. A subset of the values belongs to an existing OBD-II dataset
with automatic transmission, while the other subset has been retrieved from scratch, using OBD-II, with
manual transmission and during characterized driving conditions (cruising, idle and accelerations). We have
designed and implemented a set of rules, to recognise three driving events, i.e., idle, gear change, and
accelerations in both manual and automatic transmission. The frequency of these events in combination with
the parameter values have led to the identification of driving style differences and the impact in fuel
consumption. In addition, we have investigated the correlation among the (OBD-II) driving operational
parameters during the three driving modes (idle, cruising and acceleration) using the catch22 timeseries
analysis framework. The implemented mechanisms are extensible, in terms of considered vehicles, for
constant parameter monitoring and cloud-based storing, paving the way for transparent engine status, service
maintenance history and other added value services.
1 INTRODUCTION
Monitoring engine operations has attracted
researchers to understand the behaviour and improve
certain characteristics of the engine operations.
Gilman presented a driving assistant system, Driving
Coach, which monitors parameters to help increase
fuel efficiency depending on the driving style
(Gilman et al., 2015). Logged OBD-monitored data
can be transmitted to a telematics centre via mobile
network. This data is used for a prognostics model, as
built on correlations among fault codes
(cautions/warnings from sensors in the vehicle), to
prevent potential components breakdown (Szalay et
al., 2015).
In our previous work we have obtained and
analysed data through CANBus to calculate the
impact of different driving styles on fuel consumption
a
https://orcid.org/0000-0001-5832-759X
b
https://orcid.org/0000-0003-1890-5898
(Rimpas et al., 2020). OBD-II data are also used for
provisional or direct maintenance strategies (Peppes
et al., 2021; Kulakov et al., 2021; Gajek, 2016; Prytz
et al., 2015) by detecting the diagnostic trouble code
(DTC) (Beig et al., 2020; Oluwaseyi and Sunday,
2020; Jhou et al., 2013). This can facilitate tracking
errors and performing repairs in terms of costs and
work. Driving and maintenance records can be stored
in a trustworthy manner, providing information for
the vehicle performance and reliability. Advice on
safe and economical driving has been provided
through data analysis for driver assistance and risk
prediction and management (Pan et al., 2017). In this
work, we select a set of key driving parameters, as
retrieved by OBD-II readings, to form driving
timeseries. An existing third-party dataset is used
(
Kwak
et al., 2016), while we also create our own sets
of vehicle operation in different driving modes.
Rimpas, D. and Papadakis, A.
Driving Events Identification and Operational Parameters Correlation based on the Analysis of OBD-II Timeseries.
DOI: 10.5220/0011036400003191
In Proceedings of the 8th International Conference on Vehicle Technology and Intelligent Transport Systems (VEHITS 2022), pages 257-264
ISBN: 978-989-758-573-9; ISSN: 2184-495X
Copyright
c
2022 by SCITEPRESS – Science and Technology Publications, Lda. All rights reserved
257

The main objectives are two-fold:
a) To design and validate rules for the
identification of three driving fundamental
conditions (idle, gear change in manual and
automatic transmission, acceleration).
b) To identify and quantify, based on analysis
tools, the existence or lack of relationships
(correlation) among driving parameters (such
as engine load, RPM, and STFT).
The main paper contribution includes the event-
identification rules and their evaluation, in automatic
and manual transmission modes. These rules can
support labelling / characterization of existing
timeseries. The identified events can support the
identification of differences in driving styles in an
explainable and quantitative manner. This acts
complementarily with AI-based works which pursue
driving style identification but perform that in an
opaque manner (in terms of the timeseries analysis
and the interim results). Another contribution of the
paper is the identification of the correlation of the
operational parameters during different driving
modes, using an open, well-known analysis
framework (Ezzini et al., 2018). This is
complemented by the explanation of the correlations
identified from the perspectives of fuel efficiency,
and engine preservation.
The structure of the paper is as follows: Section 2
discusses the methodology, describing the
operational parameters to be monitored, the event-
recognition rules, and the correlation analysis
framework. Section 3 describes the identification of
driving events per driver, and the association with the
driving style. It identifies correlations among the
operational parameters under different driving
modes. Section 4 discusses the results achieved, the
conclusions and the planning for future work.
2 METHODOLOGY
2.1 Datasets and Equipment
We have initially considered the dataset consisting of
OBD-II readings from 10 drivers, performing a
specified route, starting from Korea university to
Seoul world cup stadium and vice versa. Each driver
has completed about 46 km of both residential and
high road mostly with light traffic. The vehicle
employed has been KIA Soul (1600T) with automatic
transmission (the dataset is referred as ‘KIA dataset’).
The total duration has been 23 hours resulting in over
90,000 values. The OBD-II scanner CarbigsP has
been used with Android software. We have observed
that the driving pattern of drivers #1, #3, #4, #7, and
#10 has more frequent events of interest and less
idling segments. For each of them a set of 500 values
has been used per trip including all interesting states.
As the dataset lacks labelling in terms of driving
mode (for example cruising, idle, acceleration), we
have created our own dataset consisting of these
modes. For each of these modes we have investigated
the correlation among operational parameters. The
new (own) dataset has been captured on a Toyota iQ
1000cc (1KR-FE engine) model with a manual
gearbox. The dataset has been based on a single trip
and a single driver. The test has been performed so
that the driving conditions and the temperature (25
Celsius) are similar to those of existing dataset. The
distance covered, has been a 5-kilometer residential
roadway with mixed traffic. ELM327 scanner with
ScanMaster 2.1 software has been utilized, connected
through cable to a laptop with quad-core CPU, 8GB
RAM and 256GB of SSD drive. Sampling has been
performed with fixed time intervals of 0.8sec.
2.2 Selection of Engine Operation
Parameters
The selection of engine parameters has been based on
their importance in the engine operations and their
fundamental nature. They refer to a physical measure,
while other parameters are dependent upon them.
They are also common, and they can be retrieved
using typical OBD-II scanners. The first objective has
been whether the selected parameter set, and relevant
processing can lead to a) the characterization of
driving style, and b) the understanding of the vehicle
status for preventive maintenance and error
diagnostics. These parameters include the following,
and they are summarized in Table 1along with the min
and max values.
1. The Short-Term Fuel Trim (STFT) as the fuel
adjustment by the ECU to handle engine load.
2. The Manifold Absolute Pressure (MAP),
revealing the pressure of the air intake.
3. The Absolute Throttle Position (ATP), as the
percentage of the acceleration pedal pressed
by the driver
4. The engine speed as Revolutions Per Minute
(RPM), indicating the motor stress.
5. The Calculated Engine Load (CEL).
6. The Engine Coolant Temperature (ECT) in the
engine block.
7. The Vehicle Speed, in Km per hour.
8. The Fuel Consumption and the Instant Fuel
Consumption as a common value.
VEHITS 2022 - 8th International Conference on Vehicle Technology and Intelligent Transport Systems
258
9. The Lambda Equivalence Ratio (LER), as the
air-fuel ratio.
10. The Catalyst Temperature (CT), the catalytic
converter temperature in degrees Celcius.
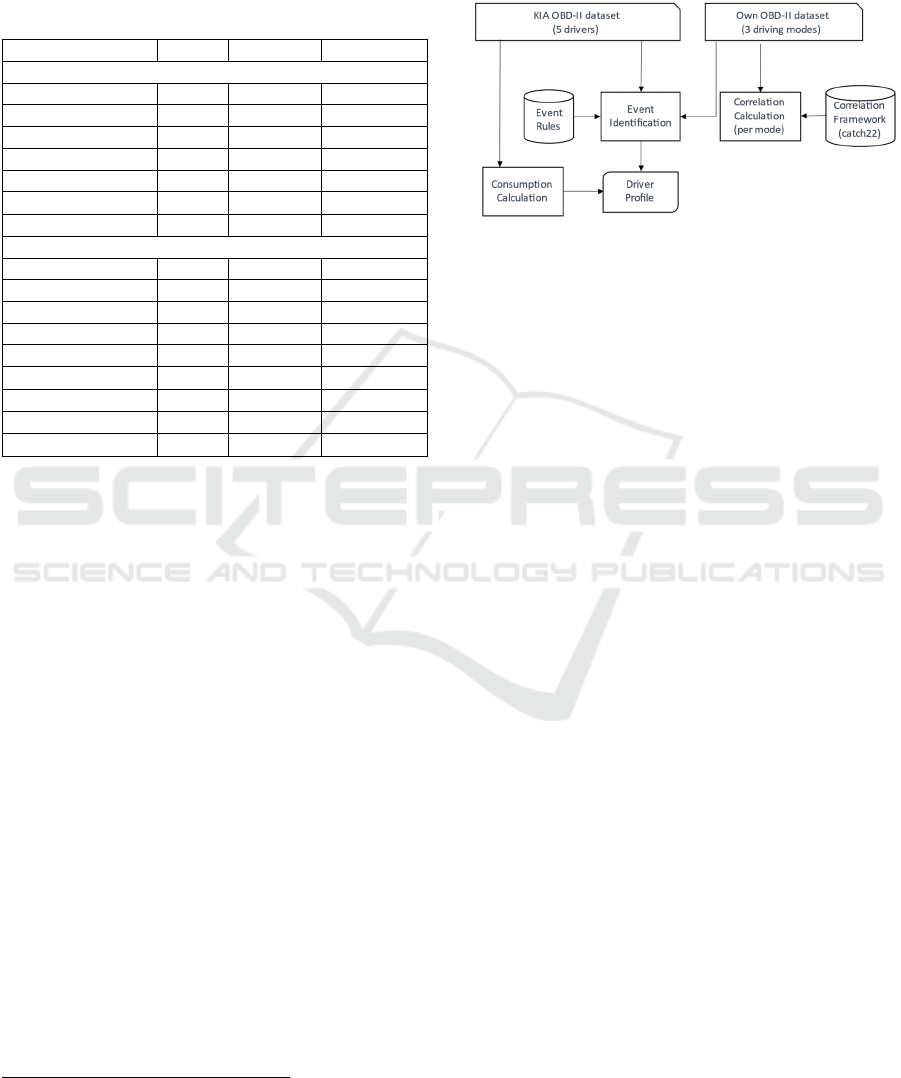
Table 1: Selected operational parameters for automatic-
manual gearbox, including minimum and maximum values.
Parameter Min Max Unit
Automatic transmission (KIA Dataset)
STFT -9 10.2 %
MAP 0 145 kPA
ATP 18 84.3 %
RPM 648 5,529 rpm
CEL 18 97 %
ECT 86 99
C
Vehicle s
p
eed 0 111 Km/h
Manual transmission (Own Dataset)
STFT -10 6.5 %
MAP 17 95 kPA
ATP 14.9 40 %
RPM 738 3,869 r
p
m
CEL 20 96 %
ECT 80 90
C
Vehicle s
p
ee
d
0 72 Km/h
LER 0.83 1.24 -
CT 502 650
C
The measurements series include the selected
parameters, the timestamp, and the driver. The
Lambda Equivalence Ratio (LER) variance has been
(statistically) insignificant, as new engines keep the
air-fuel ratio close to stoichiometric value (LER≈1),
so LER has not been considered further.
2.3 Event Identification Rules
Each driving set consists of discrete, sequential
events, related to the driver intentions, the engine and
road conditions. While they do not form an exclusive
list, typical events include a) the gear change, b) the
acceleration and c) the engine idling. The
identification of such events (framed with the
‘default’ cruising conditions) can quantitatively
characterize a driving session.
For the event identification, the timeseries are
sequentially split into small (time) segments with hop
length of 1 for gear change and of 2 for idle and
acceleration. The behaviour of specific parameters is
checked per case, typically comparing the difference
of the values between the beginning and the end of
each segment. The objective has been to make the
3
The Load Value measured from CarBigsP app
corresponds the Calculated Engine Load (CEL).
rules straightforward and involve only the necessary
parameters.
The overall workflow for a) event identification
and b) the calculation of the operational parameter
correlation is presented in Figure 1.
Figure 1: Workflow for event identification and engine
operation parameter correlation.
Gear change is characterized by a mild drop in
RPM and Vehicle Speed and a decrease in throttle
position (approaching the idle throttle position).
These observations are expressed as relationships (1),
(2) and (3). Timepoint START is the value at the
beginning of the segment and END denotes the
corresponding value at the segment end.
RPM(START)-RPM(END)>0.06*RPM(END)
(1)
VS(START)-VS(END)≥VSdrop,
with VSdrop=0
(2)
Thr(END)-ThrAtIdle < 0.6*ThrIdle,
with ThrAtIdle=18
(3)
Acceleration is characterized by increased MAP,
throttle position and Calculated Engine Load (CEL)
values. For each segment, their mean values are
compared with a threshold MAP, throttle position and
Calculated Engine Load (CEL)
3
values. E.g.
mean(blockMAP(:)) denotes the mean of all MAP
values of the segment (block). Another condition is
the increasing vehicle speed (implemented through
the verification that the values are ‘sorted’).
mean(blockMAP(:))≥ minAccelMAP,
with minAccelMAP=40
(4)
(mean(blockThr(:))≥ minAccelThr,
with minAccelThr=20
(5)
(mean(blockALV(:))≥ minAccelALV
with minAccelALV=4
(6)
issortedrows(blockVS(:))
Driving Events Identification and Operational Parameters Correlation based on the Analysis of OBD-II Timeseries
259

Idle is characterized by lower RPM values than a
threshold.
mean(blockRPM(:))<=RpmIdleMax
(7)
While these rules can be applied upon different
vehicle models, custom weights and thresholds may
apply. The implementation consists of a) timeseries
segmentation and b) rule validation with the aim to
identify the events. The implementation platform has
been Matlab 2021.
2.4 Calculation of the Correlation
among Operational Parameters
Engine operation parameters are measured from
different modules and pertain to different physical
quantities, including temperature, engine load,
acceleration, speed, and fuel consumption. Some of
them are associated with each other, as they monitor
the operation of a single engine, while others are
independent. The correlation among them can also
change, depending on the driving mode, i.e., cruising,
acceleration and idle. Verification of correlation (or
lack of it) can pave the way for additional verification
of measurements, rules for anomaly detection as well
as prediction models.
To identify the correlation among different
parameters, we employ timeseries analysis methods
to identify and evaluate the relationship and
correlation among engine parameters under different
driving conditions. Specifically, we extract and
compare a set of 22 representative features from each
of the measured parameters using the catch22
framework. Such features should have strong
classification performance and minimal redundancy.
They have been selected from a superset of 4791
features from the highly comparable timeseries
analysis toolbox using statistical prefiltering,
performance filtering and redundancy minimization
(Lubba et al., 2019). The features include histograms,
period between successive extreme events, minimum
of autocorrelation function, centroid of Fourier power
spectrum, time-reversibility.
After the extraction of the features, the Euclidean
distance per feature pairs has been calculated and
normalized in [0, 1]. If the distance is closer to zero,
the correlation is stronger and vice versa (distance
closer to 1 denotes independence between the
parameters).
3 RESULTS
3.1 Driving Events Identification
3.1.1 Automatic Gearbox
Regarding gear change identification, we have
compared the events resulting from the rules with
ground truth, considering the Continuously Variable
Transmission (CVT) gearbox and the manual
transmission. CVT consists of two variable-diameter
pulleys driving each other via a belt (Jawad and Ali,
2020). The diameter ratio of the pulleys determines
the current gear ratio. Hence, no gears are required
achieving smooth shifting and high durability.
Possible adjustments involve intake pressure and load
values criteria, as well as the fact that gear change in
automatic transmission does not involve withdrawal
of the acceleration pedal. However, the risk of
converging with deceleration status can affect
classification accuracy.
Table 2 presents the event identification results as
applied on the dataset with automatic gearbox (KIA).
In each cell the first number is the number of the
identified events, the second is the number of
correctly identified (true positive) and the third the
actual number of events.
Table 2: Events identified in the automatic transmission per
driver (KIA dataset).
Gear Changes Accelerations Idles
D1 127 (126,134) 47 (46,50) 7 (6,7)
D3 158 ( 155,163) 57 (55,60)_ 2 (2,2)
D4 182 (180,187) 21 (19,22) 12 (11,13)
D7 75 ( 72,79) 25 (24,27) 5 (5,5)
D10 164 ( 160,170) 48 (46,50) 9 (8,9)
Total 706 (693,733) 198 (190,209) 35 (32,36)
Regarding accelerations, the position of the
acceleration pedal is affecting air intake and load
values with these three parameters closely related.
The time intervals of acceleration and the absolute
throttle value suggests the style of acceleration (mild
or abrupt). The accuracy reaches 91%, while the rest
(9%) is recognized as cruising condition, as the driver
accelerates at a very slow rate with low RPM, for fuel
efficiency. However, the recognition of these patterns
is challenging even for an experienced engineer.
Regarding idle identification, 89 % accuracy was
achieved, with errors found at low load and throttle
values condition correlation. Idle state is identified
when the throttle position is stable (13.3 to 14.7%).
Challenges emerge at low engine temperature like
cold start, where engine runs richer to achieve optimal
operating temperature quickly (Zheng et al., 2020).
VEHITS 2022 - 8th International Conference on Vehicle Technology and Intelligent Transport Systems
260

Additionally, idling in traffic is initially accompanied
with higher engine load, because the brake booster is
filling with air to enhance braking potential.
Regarding gear changes reaches 95%. With
automatic cars, if a steady vehicle speed increment is
achieved, gear changes progress normally, so engine
speed is sustained at optimal range and torque (Malik
and Nandal, 2021). This is the main pattern, affecting
fuel consumption and extending engine life, provided
that those accelerations are not sharp with increased
throttle values.
In terms of driving characterization, accelerations
and gear changes can be associated with aggressive
driving. Drivers 1, 3 and 10 have similar driving
styles according to accelerations, while they differ in
the frequency of gear changes. This is affecting fuel
consumption and engine stress. Drivers 4 and 7 have
similar acceleration patterns with different gear
change sequence, which implies aggressive driving
for driver 7. For the experiment, idle suggest stopping
at traffic lights.
3.1.2 Manual Gearbox
For manual transmission we have considered three
typical driving modes a) cruising, b) acceleration,
employing our own dataset (Toyota IQ). The values
are sampled with a period of 800 ms. The cruising set
is characterized by relatively long periods of stable
speed with none to mildly active throttle, while the
acceleration style being characterized by repeating
acceleration (from 0 to approximately 70km/h). The
dataset consists mainly of cruising and acceleration
(with idle status only in the beginning of the trip).
Both aggressive and mild accelerations are taken into
consideration. Τhe duration of cruising has been
double that of acceleration. The gear changes have
been recorded as ‘ground truth’ and compared with
events identified by the code.
Table 3 indicates the identified interesting events
per driving mode. The number of accelerations is
equivalent, while the individual gear changes are
approximately 50% less frequent in the acceleration
driving mode. This lower frequency can be explained,
as the car has been tested specifically for performance
(so higher engine speed is required for more
horsepower).
Table 3: Events identified in manual transmission per
driving mode (own dataset).
Gear Changes Accelerations Idles
Cruising
(6.54 min)
37 (36,40) 20 (18,22) 1 (1,1)
Accel
(3.17.5 min)
19 (18,21) 15 (14,17) 1 (1,1)
Total 56 (54,61) 35 (32,39) 2 (2,2)
The corresponding accuracies for gear changes is
88.5%, for accelerations 82% and for idles 100%. In
principle, the impact upon the operational parameters
due to a gear change is less intense in the manual
transmission and this proves that a fine-tuning of the
weights may achieve better accuracy. Driving with a
manual gearbox, requires specific timing in shifting
to avoid damaging the gears and clutch. The driver
should weigh in the vehicle speed, road incline (if
available) and engine load to shift (change gear)
within optimal torque range, for maximum
performance and fuel efficiency. Even in this case,
engine speed (RPM) drop is adequate and easily
noticeable while in automatic transmission
everything is smoothly handled by the control module
with no interruption.
3.2 Fuel Consumption Calculation
To calculate the fuel consumption, since the MAF
sensor is not present, the MAP value equivalent is
used. Hence, the following equations (8) – (11) are
used for automatic and manual transmission
(Meseguer et al., 2017; Lightner, 2011):
IMAP= 𝑅𝑃𝑀 ∗
(8)
MAF=
∗
∗𝐸𝐷∗
(9)
Fuel flow (l/hr) =
∗,
∗
(10)
Fuel Cons. (lt/100km) =
∗ 100 (11)
IMAP: Intake manifold Sub-parameter
MAF: The equivalent mass air flow in g/s
IAT: Ambient temperature, for KIA dataset of 25C,
based on weather reports according to stated season
VE: Volumetric efficiency of the engine – a typical 85%
for both new engines applied (Nutter, 2017)
ED: Engine displacement – 1,591 for Kia Soul and 997
for Toyota iQ (UltimateSpecs, 2021)
MM: Average molecular mass of air (28.97 g/mole)
R: Ideal Gas Constant (8.314 J/ K * mole)
AFR: Stoichiometric Air Fuel Ratio (14.7)
Fd: Gasoline fuel density, 770kg/m
3
(Acea, 2019)
At Idling, the fuel consumption is not meaningful
to calculate as the vehicle speed equals to zero, and
only fuel flow is computed. In our previous work, it
Driving Events Identification and Operational Parameters Correlation based on the Analysis of OBD-II Timeseries
261
has been verified that the calculated fuel consumption
values are aligned (as mean) with those retrieved
from OBD-II (with a percentage of 99%). In Section
4, we discuss the fuel consumption measurements in
relation with the driving style.
3.3 Correlations among Engine
Operation Parameters
As discussed in Section 2.2., the following
parameters have been considered for the estimation of
the correlation: 1) Calculated Load Value (CEL), 2)
Engine Coolant Temperature (ECT), 3) STFT, 4)
Intake MAP, 5) Absolute throttle Position (ATP), 6)
Lambda Equivalence Ratio (LER), 7) Catalyst
Temperature (CT), 8) Engine RPM, and 9) Vehicle
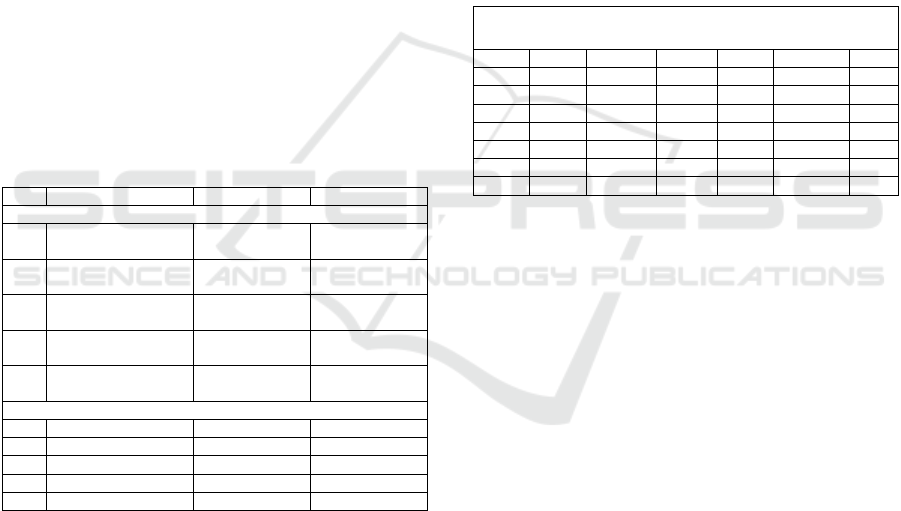
Speed. Table 4 presents the five more and the five less
correlated parameters in pairs for the three situations
(cruising, idle and acceleration). Each row includes
the correlated pair, while the number in parenthesis is
the ‘correlation index’ belonging to [0, 1]. The closer
the index is to zero, the more significant the
correlation, while 1 indicates independence of the two
variables.
Table 4: Correlation calculated in the three driving modes.
Cruise Idle Accel
Most correlated parameters (decreasing correlation)
#1 MAP, STFT (0.063) RPM. LER
(0.11)
MAP, CEL
(0.015)
#2 MAP, ATP (0.12) RPM, MAP
(0.18)
MAP, ATP
(0.034)
#3 MAP, LER (0.13) LER, MAP
(0.22)
MAP, LER
(0.047)
#4 STFT, LER (0.14) CT, ATP (0.35) ATP, CEL
(0.048)
#5 STFT, ATP (0.16) CT, CEL (0.47) CEL, LER
(0.056)
Least correlated parameters (decreasing independence)
#1 STFT, CT (1) ECT, MAP (1) CEL, CT (1)
#2 STFT, RPM (1) ECT, ATP (1) RPM, LER (1)
#3 STFT, Speed (1) ECT, LER (1) Speed, LER (1)
#4 ECT, LER (0.99) ECT, CT (1) CT, LER (0.99)
#5 ECT, MAP (0.98) ECT, RPM (1) CT, ATP (0.95)
In cruising, the highest correlation is identified
between MAP and the parameters STFT, ATP
(Absolute Throttle Position) and LER (Lambda
Equivalence Ratio). Similarly, STFT correlates with
LER and ATP. On the other hand, the CT (Catalyst
Temperature), the RPM and the Speed appear
independent of the STFT, where the lack of
correlation almost reaches the maximum value (i.e.,
1). CT is also independent of LER and MAP.
In the idle status, the correlation is decreased due
to its distinctive features. Indeed, during idling there
is a constant fuel flow via a forced operation, the
battery is not charging properly, engine lubrication is
deficient, and the catalytic converter has low
temperature. During acceleration strongest
correlations appear. MAP is correlated with CEL, the
ATP and the LER. Similarly, the CEL is correlated
with the ATP and the LER.
4 DISCUSSION
In this section, we combine the observations of
Sections 2 and 3 to discuss the impact of the driving
style on fuel consumption and vehicle lifecycle. Table
5 includes the mean values (from KIA dataset) of
MAP, RPM, speed, load (CEL), ATP and fuel
consumption.
Table 5: Engine operation parameters (mean values) and
fuel consumption.
Engine operation parameters and fuel consumption
(mean values)
Num. MAP RPM Speed CEL ATP Fuel
1 62.1 1,701.4 37.8 48.3 24.2 12.4
3 38,2 1,877.4 52.6 50.7 28.3 7
4 13.2 1,311.5 21.7 38.9 22.7 5.16
7 53.9 1,642 40.5 42.5 20 9.68
10 56.1 1,743.4 43,3 40.8 23.7 10.3
C
r
uis 36 2,064.3 38.3 38 19 5.2
Acc. 47,6 2,097.2 39.5 50.1 22 7.4
Driver 1 has the most ‘aggressive’ driving
behaviour according to Tables 4 and 5. Although
MAP value is not the highest, the engine speed
reaches a maximum of 5.5k RPM which is high and
typically contributes to higher fuel consumption (as
indicated in Table 5). The mean value of engine load
is constrained due to idles states (7 idles have been
identified, e.g., due to traffic). Driver 4 is softer on
acceleration, achieving a larger number of gear
changes so engine is kept at optimal range. We notice
that minimum MAP value is zero, like driver 3 and
that is an indication that cruising was exploited to
highest level, so fuel efficiency is maximum. MAP
and ATP are strongly collated to fuel trims (STFT),
as indicated in Table 5. So, if they are kept low while
cruising, fuel consumption is limited. The analysis of
these data results in Table 6. Load values are the same
for each driver as they are associated with specific
route limitations. Drivers 3 and 4 achieve zero MAP
values as both exploit cruising status.
VEHITS 2022 - 8th International Conference on Vehicle Technology and Intelligent Transport Systems
262

Table 6: MAP, RPM, CEL and ATP minimum and
maximum values for driving style characterization.
Differentiation of Data
–
Kia Soul
Num MAP RPM CEL ATP
Min Max Min Max Min Max Min Max
1 21 99 648 5529 18 91 18 78
3 0 145 665 3692 18 91 18 82
4 0 106 657 3718 18 91 18 78
7 22 99 660 2829 18 91 18 42
10 20 100 663 3483 18 91 18 82
Considering the values of Table 6, the driving
style of each driver is characterized in Table 7. Even
though driver 3 has the highest MAP, load and
throttle values, fuel economy efficiency is second
best, as cruising status is vastly utilized. In this case,
the stressing upon the vehicle engine is limited,
contributing to the extension of the engine lifecycle.
Table 7: Driver aggression categorization.
Most aggressive driver from left to right
1 10 7 3 4
Similar pattern is followed in our own experiment
where the acceleration mode is characterized by
greater MAP, load, and ATP values. This results in
almost 50% higher fuel consumption than cruising,
up. This is aligned with analysis performed in our
previous work (Rimpas et al., 2020), where constant
acceleration has been associated with engine stressing
and decreased fuel efficiency.
5 CONCLUSIONS – FUTURE
WORK
The consideration of the OBD-II periodic readings as
timeseries measurements has allowed us to apply
relevant methodologies a) for driving event
identification and b) for parameter correlations. We
consider that such as consideration can open new
perspectives (in terms of methodologies and tools) in
engine operation monitoring and added value
services. The event identification rules have proved
to be robust, providing reliable results for different
drivers, driving modes and automatic / manual
transmission. The characterization of the driving style
has been verified through parallel calculation of fuel
consumption. Similarly, correlation of engine
operation parameters correlation per driving mode
has been coherent.
As future work we consider further elaboration
OBD-II readings. These can include the identification
of non-typical values, in the context of preventive
maintenance. Sensor operation can allow for prompt
vehicle and engine inspection and prevent future
malfunctions. The availability of readings, available
in the cloud or locally and offered in a trustworthy
manner can allow access to a complete and coherent
history of the vehicle (Voulkidis, 2022), interesting to
potential buyer and state agencies, revealing poor
maintenance or unhandled malfunctioning. From
another perspective, this work can be combined used
with more complex (and opaque) AI/deep learning
approaches for the creation of labelled timeseries and
to enhance the ‘explainability’ of the results.
ACKNOWLEDGEMENTS
The authors acknowledge financial support for the
dissemination of this work from the Special Account
for Research of ASPETE through the funding
program ‘Strengthening ASPETE’s research.
REFERENCES
Gilman, E., Keskinarkaus, A., Tamminen, S., Pirttikangas,
S., Röning, J., & Riekki, J. (2015). Personalised
assistance for fuel-efficient driving. Transportation
Research Part C: Emerging Technologies, 58, 681–705.
https://doi.org/10.1016/j.trc.2015.02.007
Szalay, Z., Kanya, Z., Lengyel, L., Ekler, P., Ujj, T.,
Balogh, T., & Charaf, H. (2015). ICT in road vehicles
— Reliable vehicle sensor information from OBD
versus CAN. 2015 International Conference on Models
and Technologies for Intelligent Transportation
Systems (MT-ITS). pp.469–476. https://doi.org/
10.1109/mtits.2015.7223296
Rimpas, D., Papadakis, A., & Samarakou, M. (2020). OBD-
II sensor diagnostics for monitoring vehicle operation
and consumption. Energy Reports, 6, 55–63.
https://doi.org/10.1016/j.egyr.2019.10.018
Peppes, N., Alexakis, T., Adamopoulou, E., &
Demestichas, K. (2021). Driving Behaviour Analysis
Using Machine and Deep Learning Methods for
Continuous Streams of Vehicular Data. Sensors,
21(14), 4704. https://doi.org/10.3390/s21144704
Kulakov, A., Muhametdinov, E., Tsybunov, E., & Badriev,
A. (2021). Development of on-board Diagnostic
Systems for Vehicles to Improve their Reliability.
MATEC Web of Conferences, 334,
https://doi.org/10.1051/matecconf/202133401037
Gajek, A. (2016). Diagnostics monitor of the braking
efficiency in the on board diagnostics system for the
motor vehicles. IOP Conference Series: Materials
Science and Engineering, 148, 012038.
https://doi.org/10.1088/1757-899x/148/1/012038
Prytz, R., Nowaczyk, S., Rögnvaldsson, T., & Byttner, S.
(2015). Predicting the need for vehicle compressor
repairs using maintenance records and logged vehicle
Driving Events Identification and Operational Parameters Correlation based on the Analysis of OBD-II Timeseries
263

data. Engineering Applications of Artificial
Intelligence, 41, 139–150. https://doi.org/10.1016/
j.engappai.2015.02.009
Beig, H., Nema, S., & Kr, S. (2020). Development of Error
Consolidator Tool for On-Board Diagnostic Errors.
International Journal of Computer Applications,
176(17), 18–21. https://doi.org/10.5120/ijca2020920
127
Oluwaseyi, M.M. and Sunday, A.M. (2020). Specifications
and Analysis of Digitized Diagnostics of Automobiles:
A Case Study of on Board Diagnostic (OBD II).
International Journal of Engineering Research and
Technology, 9(1), pp.91–105. https://doi.org/10.17577/
ijertv9is010045
Jhou, J. S., Chen, S. H., Tsay, W. D., & Lai, M. C. (2013).
The Implementation of OBD-II Vehicle Diagnosis
System Integrated with Cloud Computation
Technology. 2013 Second International Conference on
Robot, Vision and Signal Processing. pp. 9-12.
https://doi.org/10.1109/rvsp.2013.55
Pan, Y. J., Yu, T. C., & Cheng, R. S. (2017). Using OBD-
II data to explore driving behavior model. 2017
International Conference on Applied System
Innovation (ICASI). pp. 1816-1818.
https://doi.org/10.1109/icasi.2017.7988297
Kwak, B.I., Woo, J. and Kim, H.K. (2016). Know your
master: Driver profiling-based anti-theft method. 2016
14th Annual Conference on Privacy, Security and Trust
(PST), pp. 211-218.
https://doi.org/10.1109/PST.2016.7906929
Ezzini, S., Berrada, I., & Ghogho, M. (2018). Who is behind
the wheel? Driver identification and fingerprinting.
Journal of Big Data, 5(1). https://doi.org/10.1186/
s40537-018-0118-7
Lubba, C. H., Sethi, S. S., Knaute, P., Schultz, S. R.,
Fulcher, B. D., & Jones, N. S. (2019). catch22:
CAnonical Time-series CHaracteristics. Data Mining
and Knowledge Discovery, 33(6), 1821–1852.
https://doi.org/10.1007/s10618-019-00647-x
Adnan Jawad, Q., & K. Ali, A. (2020). Comparison of CVT
Performance with the Manual and Automatic
Transmission for Evaluation the Fuel Consumption and
Exhaust Emissions. Basrah Journal of Engineering
Science, 20(1), 15–22. https://doi.org/10.33971/
bjes.20.1.4
Zheng, X., Lu, S., Yang, L., Yan, M., Xu, G., Wu, X., Fu,
L., & Wu, Y. (2020). Real-world fuel consumption of
light-duty passenger vehicles using on-board diagnostic
(OBD) systems. Frontiers of Environmental Science &
Engineering, 14(2). pp. 33-42 https://doi.org/10.1007/
s11783-019-1212-6
Malik, M., & Nandal, R. (2021). A framework on driving
behavior and pattern using On-Board diagnostics
(OBD-II) tool. Materials Today: Proceedings.
https://doi.org/10.1016/j.matpr.2021.07.376
Meseguer, J. E., Toh, C. K., Calafate, C. T., Cano, J. C., &
Manzoni, P. (2017). Drivingstyles: a mobile platform
for driving styles and fuel consumption
characterization. Journal of Communications and
Networks, 19(2), 162–168. https://doi.org/10.1109/
jcn.2017.000025
MAP and MAF-Based Air/Fuel Flow Calculator. (2011).
Lightner, B.D. November 7, 2021, from
http://www.lightner.net/obd2guru/IMAP_AFcalc.html
Volumetric Efficiency and What it Means to Performance.
(2017). Nutter, B. Retrieved November 4, 2021, from
https://www.onallcylinders.com/2017/05/11/volumetri
c-efficiency-and-what-it-means-to-performance/
Toyota iQ 1.0 VVT-i Technical Specs, (2019).
UltimateSpecs. Retrieved November 1, 2021, from
https://www.ultimatespecs.com/car-
specs/Toyota/11209/Toyota-iQ-10-VVT-i.html
Kia Soul 2017 1.6 GDi Technical Specs, (2019).
UltimateSpecs. Retrieved November 7, 2021, from
https://www.ultimatespecs.com/car-
specs/Kia/109780/Kia-Soul-2017-16-GDi-Eco-
Dynamics.html
Worldwide Fuel Chapter. (2019). ACEA. Retrieved
October 20, 2021, from https://www.acea.auto/
files/WWFC_19_gasoline_diesel.pdf
Voulkidis, A., Zahariadis, T., Papadakis, A., & Ipektsidis,
C. (2022). Enablers to Boost Blockchain Adoption in
EU. International Journal of Network Security & Its
Applications, 14(1), 27–41. https://doi.org/10.5121/
mijnsa.2022.14102
VEHITS 2022 - 8th International Conference on Vehicle Technology and Intelligent Transport Systems
264
