
Digital Device and Mathematics: Multilevel vs Machine Learning Models
for Value-added Ranking in Italy
Donatella Papa
a
National Institute for the Evaluation of the Education and Training Educational System (INVALSI), Rome, Italy
Keywords:
Education, Mathematics, ICT, Multilevel, Machine Learning.
Abstract:
With the COVID-19 pandemic and the development of distance education programs, digital learning is popular
and strategic in many learning fields. The deployment of Information and Communications Technology and its
impact on both national and international learning programs are becoming increasingly significant. This study
seeks to explore in the Italian context both the effectiveness of digital learning in Mathematics Education and
which features and how affect value-added at the classroom level. To explore Information and Communica-
tions Technology contribution and value-added scoring, the study takes into consideration the analytical power
of classical multilevel models concerning the predictive power of different types of machine learning models.
The study aims to investigate how Information and Communications Technology, and related concepts, im-
pact the Weighted Likelihood Estimates in Mathematics for students in the lower secondary school, using data
from the INVALSI of the school year 2017/2018. The main finding is that Personal Computer ownership at
home plays an important role in mathematical learning. Finally, a machine learning model incorporated in the
educational domain can be an interesting starting point for developing class-predictive policies.
1 INTRODUCTION
The idea of digital learning has recently caught the
attention of the general public to the gap created by
online learning throughout the COVID-19 pandemic
for lots of students around the world. Distance or on-
line learning needs careful exploration to develop an
overall read of the actions taken and to be undertaken
at the government and school levels. At the sunrise
of the digital age, it’s essential to know what pro-
portion and how digital learning is affirmed in terms
of the possession and use of technologies, to avoid
new types of exclusion from the numerous areas of
information and knowledge society. The strategic ob-
jective formalized with the investments in hardware
and software made by Italy in recent years and in the
function of the EU2020 Lisbon Strategy, which in the
school began through the Digital School Plan with
particular attention to some regions of Southern Italy,
which had the aim of faster and wider dissemination
of the Information and Communications Technology
(ICT) among students at all school levels. If Europe is
moving towards the so-called gigabit society, starting
not by a chance from the places where the knowledge
of children and young people are formed to achieve
a
https://orcid.org/0000-0001-5261-3026
an increasingly interconnected society, Italy remains
in the latter places, after a small leap forward in 2019,
with the 25th place in 28th of the DESI 2020 rank-
ing (Commission, 2020). Exploring the involvement
of macro-territorial areas, moreover, is a key issue to
describing and understanding the emergence of differ-
entiated ICT practices. The Istat data from the “Mul-
tipurpose survey on households and ICT” 2018 un-
doubtedly has highlighted the existence of a differ-
ent acceleration in the digitization process that runs
through the country and with Italian families.
Figure 1: Family without the Internet at home by reason
(ISTAT, 2018).
In southern Italy, 41.6% of households say they
do not own a computer at home (compared to an av-
erage of about 30% in other areas of the country) and
Papa, D.
Digital Device and Mathematics: Multilevel vs Machine Learning Models for Value-added Ranking in Italy.
DOI: 10.5220/0011042700003182
In Proceedings of the 14th International Conference on Computer Supported Education (CSEDU 2022) - Volume 2, pages 171-178
ISBN: 978-989-758-562-3; ISSN: 2184-5026
Copyright
c
2022 by SCITEPRESS – Science and Technology Publications, Lda. All rights reserved
171

only 14.1% have at least one computer available for
each component. Among the families who declared
that they did not have an Internet connection at home,
about 30% of cases reside in the South, declaring
that the absence is determined by economic reasons
in 10% of cases, while more than 60% declare that
they do not have an Internet connection because no
one would have been able to use it (in a greater per-
centage in the northeast) and about 20% because they
do not find it useful or interesting.
The purpose of this study was to examine the hier-
archical relation between students, class, and the terri-
torial context about the school learning of Mathemat-
ics in the last grade of lower secondary school for Ital-
ian context regarding the use of technology devices
(please see below the research question Q1). An in-
depth study is needed to improve discussions on the
impact of digital technologies in the classroom and
at home on mathematics education in Italy. More-
over, the focus of the policy should also be on the op-
portunity to have access to digital resources provided
by ICT for learning and territorial development. At
the same time, the purpose is to evaluate the value
added by the classroom and the predictive potential
of machine learning models is explored, comparing
them with the traditional multilevel regression ap-
proach (please see below the research question Q2).
2 THE DIGITAL DIVIDE IN
EDUCATION
The literature suggests that having an Internet con-
nection and a Personal computer at home can have
positive effects on school performance (Wittwer and
Senkbeil, 2008). However, the more recent studies
of the impact of instructional computer use in school
settings have found mixed results and that vary across
countries (Eickelmann et al., 2012; Hu et al., 2018;
Carstens et al., 2021). Indeed, it is not the sim-
ple access to home or school to ICT that can influ-
ence in positive terms school learning (which instead
would give negative outcomes) as much as the rela-
tive use and control that is provided. From this point
of view, inequalities in access to Personal comput-
ers and the Internet connection and their implications
have been known for some decades with the debated
term of the digital divide (NTIA, 1995; DiMaggio
et al., 2001). There are differences in their origin and
are attributable, at the same time, to those who ar-
gue that these lacks are linked to the structural nature
of the students, such as the socio-economic and cul-
tural status of the original family, and those who ar-
gue that the absences are subjective; hence, all these
facts are partly linked to the different ways in which
knowledge is processed and internalized by the differ-
ent subjects. Overcoming this dichotomy, in the per-
spective of the study of digital inequalities, the focus
is on the uses that are introduced and the skills that
can be exploited (DiMaggio et al., 2001; van Dijk,
2005). There is no doubt, that technology contributes
to a better distribution of knowledge. The complexity
of its use and fruition, as well as the resulting costs,
can intensify existing social inequalities, or, as the au-
thor reasons, large groups of misfits, people who are
ill-adapted to the information society. Among the in-
dividual variables, beyond gender and the migratory
background, the prevailing language spoken in the
family will be considered because of what van Dijk
also argued that for non-natives (p. 177): “The fu-
ture is considerably less bright for migrants and eth-
nic minorities with low education in a network society
dominated by natives and ethnic majorities. Usually,
they lack digital skills and, what is worse, they do not
speak or command the native or dominant language
sufficiently. So, they run the risk of missing out on
the technical and communicative skills required in a
network society. The major handicap is having in-
sufficient command of the dominant language. The
only exception is to be able to speak and write in En-
glish”(van Dijk, 2005).
2.1 What Is the Relationship between
Digital Learning and Learning
Mathematics in the Classroom?
From the review of the international literature, about
the relationship between digital learning and learn-
ing in the classroom, the students have greater diffi-
culty using the computer equipment effectively when
teachers do not work in the classroom to develop
shared practices in the use of technology (Kozma,
2003; Balanskat et al., 2006; Burns, 2013; Drijvers,
2015; Bray and Tangney, 2017; Viberg et al., 2020).
In the present work, the exploration will start with
the creation of operationalized indicators from the fre-
quency of PC usage in the classroom with the super-
vision of the Mathematics teacher (INVALSI, 2017;
Rutkowski et al., 2013). The purpose is to distinguish
between established practices of PC usege and their
connotations (positive and/or negative) on individual
Mathematics learning and the relative influence on
classrooms/peers. For the cooperative learning, the
students tend to enjoy Mathematics and this fun mo-
tivates them to learn (Davidson, 1990). The impor-
tance of computer-supported learning is an emerging
branch of pedagogical sciences that deals with study-
ing how people can learn with the help of computers.
CSEDU 2022 - 14th International Conference on Computer Supported Education
172

2.1.1 Machine Learning Models in Education
As reported in the work ”Contrasting Classical and
Machine Learning Approaches in the Estimation
of Value-Added Scores in Large-Scale Educational
Data”(Levy et al., 2020), the computational sciences
and social sciences have been collaborating for some
time to achieve greater and better results in the ap-
proaches of machine learning in the educational field,
because of the growth potential in a wide range of
areas of the society of supervised and unsupervised
machine learning models. The school and didactic
learning outcomes were evaluated with linear and/or
nonlinear regression methods, such as Support Vector
Machine, Random Forest, Extreme Gradient Boost-
ing, Neural Network, etc. Despite the wide vari-
ety of regression models, there is still no consensus
on which model is the ”best” (Papadogiannis et al.,
2020). Even with this, it may be possible to intervene
with institutions in advance to limit and/or manage
the phenomenon of students with a lesser chance of
effective learning. This includes their socio-economic
and cultural status, territorial and scholastic features,
thereby improving the school system’s effectiveness
in terms of student performance. There are several
possible applications of prediction data derived so far
for machine learning in the educational context (Pa-
padogiannis et al., 2020). Due to the implementa-
tion of policy actions in lower and upper secondary
schools, machine learning models will be developed:
to prevent students from leaving school too early; to
provide feedback to assist at-risk students; to differ-
entiate didactic planning at the classroom/peer level
in terms of mobile technology, etc.
3 RESEARCH PROBLEM &
OBJECTIVES
Due to the global economic crisis COVID-19 is ex-
periencing, the use of ICT and distance learning has
become a necessary teaching method. This implies
the application of new didactic strategies and peda-
gogical approaches to improve strategic skils. Fur-
thermore, it is just as important to make sure no one
is left behind in this digital competition and to explore
at the classroom context to understand which one of
the exogenous factors (from the scholastic) may con-
tribute to widening the gap. The educational process
is improved by exploring whether and to what extent
digital know-how developed at home and at school
have an equal impact on mathematical ability. It is
important to distinguish between existing practices
and connotations (positive and/or negative) concern-
ing individual mathematics learning, as well as its in-
fluence on classes and peers, in collaboration activ-
ities with the mathematics teacher, supported by the
computer or in teacher continuing education. Specif-
ically, this work uses data from the National Large-
Scale Computer-Based Survey conducted by the Na-
tional Institute for the Evaluation of the Education
System (INVALSI) to assess the knowledge and skill
of eighth grade students in mathematics for the school
year (SY) 2017/2018. The following research ques-
tions are addressed in this study: Q1. Combined with
“exogen” features to the scholastic institution, for ex-
ample, gender, socio-economic and cultural status,
linguistic background and other contextual aspects,
how and how much ICT features contribute to the
value-added ranking? Q2. For the Italian context,
could be the analytic power of traditional multilevel
models relaunched by the predictive rule of different
types of machine learning approaches?
4 MATERIAL AND TOOLS
Although the National INVALSI test produces cen-
sus data, it also extracted a two-stage probabilistic
sample: in the first stage, the schools are sampled
and in the second one, two classes for each school
selected from the previous stage (INVALSI, 2018).
The sample extracted for the SY 2017/2018 is 29
359 lower secondary school students, representative
of the general population of 567 986 students. It is
decided to proceed with the analysis of the sample
rather than the entire population for the need to an-
alyze the features of teachers, contained in the ques-
tionnaire for Mathematics teachers administered only
to sample classes participating in the National Sur-
veys (INVALSI, 2017). What’s more, it was neces-
sary to study to the s.y. 2017/2018, instead of the
most recent, because that teacher’s questionnaire was
not administered (neither to the population nor to the
sample). Which exogen variable is considered to eval-
uate value-added score is a long-term question. First
of all, it is necessary to point out that the dependent
variable and the independent variables adopted in this
paper have different nature, detection, and synthesis
procedures. The data is collected through different
sources: the school administration, teacher and the
student questionnaire and the standardized INVALSI
test. The independent variables about students are:
• the school career (here ”late enrolled student”);
• the measure of socio-economic and cultural status
(here ”ESCS”, corrected by the exclusion of the
two items of a computer and internet ownership at
home);
Digital Device and Mathematics: Multilevel vs Machine Learning Models for Value-added Ranking in Italy
173

• PC availability at home and Internet availability at
home (here ”PC/Internet avaiability at home”)
• the immigration background (here ”native”,
”I gen imm” and ”II gen imm”);
• the gender (male),
• the language is spoken at home (italian, here
”lang”),
• the math score in grade 7 (the dichotomized writ-
ten scoring in Mathematics at grade 7, where in-
sufficient value is equal to 1 otherwise 0, here
”math score grade 7”).
For all these variables, macro variables have also
been prepared at the class level by aggregations (with
mean) of the subset of students that make up the
same class. By the teacher questionnaire, seven vari-
ables are administered for detecting the frequency of
ICT use by the Mathematics teacher in the classes,
such as Computer, multimedia interactive whiteboard
(MIW), educational and computer software, digital
camera, tablet, and smartphone. These variables
are synthesized through Principal Component Anal-
ysis (PCA). The first component is responsible for
high scores in the variables related to teaching activ-
ities (the MIW, educational and computer software,
here ”PC use Classroom didactics”); while the sec-
ond one is linked to high scores in other activities
(use of digital camera, tablet and smartphone, here
”PC use Classroom other”). Other ten variables are
administered through the items of the Likert scale
for the updating activities in the last 2 SY (2016-17
and 2017-18) declared by the classroom Mathematics
teacher. Also, these variables are summarized through
PCA. Only one component is relevant for the present
study and considers the updating of teachers in the
last two school years for Didactics and the Integration
of Information Technologies in the teaching of Math-
ematics (here ”teacher update ICT”). Furthermore,
also a dummy variable related to the use in class of
peer activities is selected from the teacher question-
naire. Non-response data is more common with self-
administered questionnaires when specific questions
are left unanswered. In this study, albeit with a re-
duced incidence, these missing data occurred for data
such as administrative and/or teacher or student ques-
tionnaires. The missing data are concentrated among
the categorical variables and have a percentage of less
than 10%. In this regard, it was deemed best to use the
single imputation technique, which focuses on substi-
tuting each missing value using mode as a statistical
method.
4.1 Analysis of the WLE Distribution
The dependent variable considered is the mathemat-
ical Weighted Likelihood Estimates (WLE) score at
the INVALSI scale (with Mean = 200 and Standard
Deviation = 40). The estimate is based on the concur-
rent calibration of the INVALSI data from the Main
Study based on the Rasch model of measurement
(Rasch, 1960). As described in the INVALSI tech-
nical report (INVALSI, 2018), standardized weakly
parallel multiple test-forms were assembled from a
large item bank, developed by INVALSI and based
on the Rasch unidimensional model of measurement.
Taking into account the main international research
on mathematics education, the theoretical framework
is aligned with the National System of Evaluation
(SNV). Further details on grade 8 assessment de-
sign, item bank characteristics, test-form assembly,
and psychometric properties are reported in the cor-
responding chapter of the INVALSI technical report
(Desimoni, 2018). For the inferential models, the data
of the unweighted sample will be used. This is be-
cause the main goal of the machine learning model
is different from weighted analyses obtained with the
adjusted population estimates. Indeed, the machine
learning techniques were not developed to explain re-
lationships, but for predictive purposes.
5 RESULTS
This work seeks to identify which machine learning
regression model is closest to the results obtained by
the multi-level hierarchical model to improve the ed-
ucational system with more innovative and proactive
predictive, organizational, and institutional develop-
ments. For this evaluation, the first step was either the
adaptation to the INVALSI data and the previously ex-
posed hypotheses of the procedure exposed by Levy
and colleagues (Levy et al., 2020) through the R
Project 4.1.0 software (with the ”lmer4”, ”caret”,
”nlme”, “kernlab”, ”nnet”, ”xgboost” libraries). Be-
fore moving on to the analysis of the results, it is nec-
essary to point out that in the far and the fitting train-
ing we have opted for a reduction to 10 k-fold valida-
tion for each regression and tree model. As noted in
the literature, repeated cross-validation of ”k-folds”
has the advantage of improving the estimation of the
average performance of the model at the cost of adopt-
ing and evaluating many more models (James et al.,
2013). It is also recalled that for the implementa-
tion of machine learning models, intending to predict
Mathematics performance, this work has drawn on the
set of independent variables of the multilevel regres-
CSEDU 2022 - 14th International Conference on Computer Supported Education
174
sion model described above, preferring the simpli-
fied multilevel regression model to random intercept.
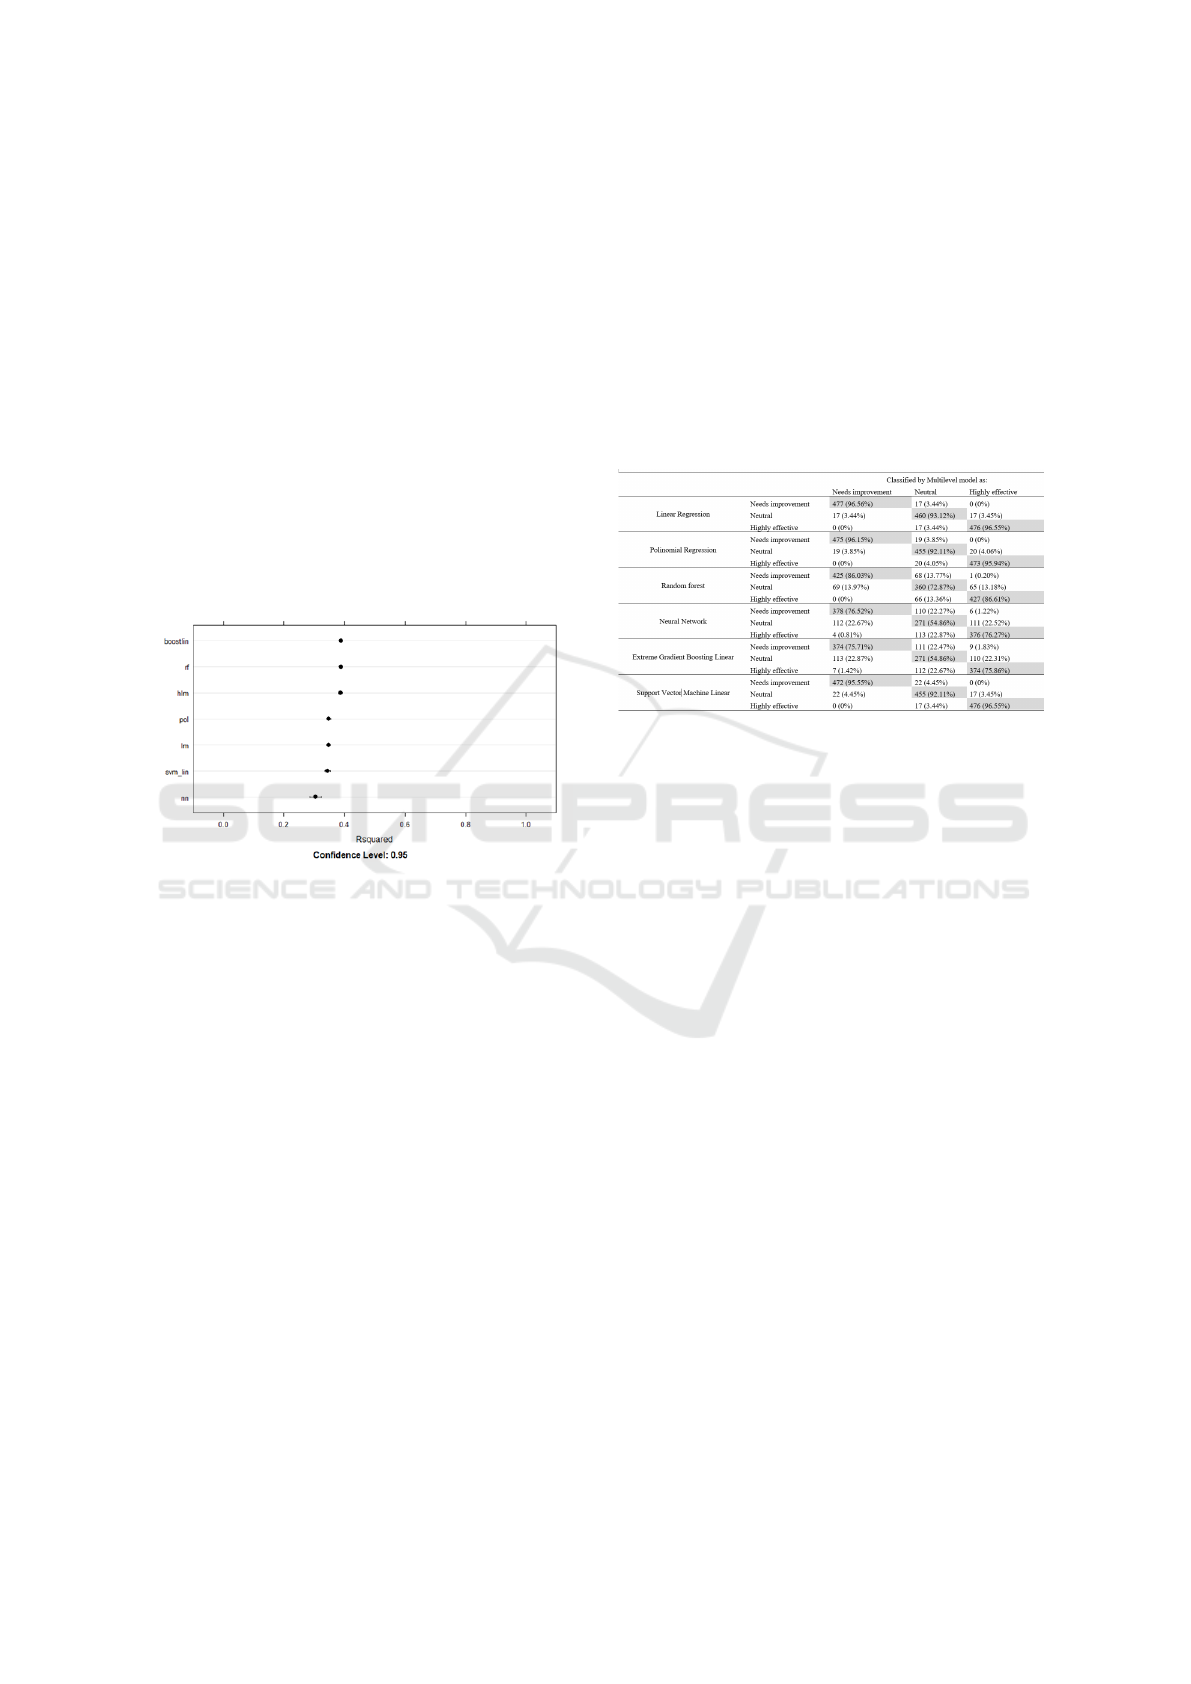
From a first analysis, as shown in Figure 2, the dif-
ferent models provide results very close to each other
with a better-predicted error, as well as for the mul-
tilevel model (abbreviated as hlm), for the Extreme
Gradient Boosting (boostin) and the Random Forest
(rf). The peculiarity of these last two ”tree” regression
models is precisely to consider exhaustively the pres-
ence of relationships between the variables belonging
to different hierarchical levels of a data matrix and
their breakdown of the variance in the terminal nodes
(e.g., classes), considering both the net effect on sta-
tistical units (ad.es. students) and the interactions
present in them. Among the models that have less re-
liable results in terms of R
2
are the polynomial (pol)
and linear regression (lm), the linear Support Vector
Machine (svmlin) and the Neural Network (nn).
Figure 2: R2 distribution by the statistical model.
Value-added (VA) is defined as the difference be-
tween the expected and the actual performance. Each
VA score was computed based on average residuals
per classroom. The positive sign indicates that stu-
dents in each class have achieved a better-predicted
result in Mathematics (net of factors that cannot be
affected by a class), while a negative sign indicates
that a worse result has been obtained. The comparison
was made by classifying the added value scores into
three quartiles, calculated based on the average resid-
uals per classroom (the residuals represent precisely
what cannot be attributed to the personal, social, and
economic characteristics of the students and thus de-
pends on belonging to a given classroom). Based
on the classification obtained by three quartiles, the
classes were divided into these categories of added
value: ”Needs improvement”, ”Neutral”, ”Highly ef-
fective”. It is apparent that the central class is the
one that does not have a positive or negative impact
on the students within; the classes with ”Highly Ef-
fective” labels are usually those that have achieved
results that are significantly higher than those that
are on average obtained by students attending classes
with comparable characteristics (based on the socio-
demographic profile and level of the previous school
year); the classes with ”Needs Improvement” labels
have achievement levels that are significantly below
those achieved by students attending classes with sim-
ilar characteristics. As can be seen from Table 3, with
the multilevel classification, the maximum disagree-
ment is 23% for Extreme Gradient Boosting Linear,
22% for Neural Network and 14% for RF.
Table 1: Crosstable of Multilevel model by Machine learn-
ing models VA classifications.
The results are shown highlighting the need for
additional exploration for decision tree algorithms.
In another word, the best models are the linear al-
gorithms, confirming linearly separable data. The
largest difference between linear regression models
and multilevel model is that there is potentially a dif-
ferent intercept and a different slope coefficient for
every level 2 variable for the classroom (Levy et al.,
2019). In other words, the students are clustered in
the classroom in multilevel analysis, giving more ac-
curacy to the results, while in linear regression models
it is not available.
5.0.1 Ensemble Methods vs. Multilevel Model
Going deeper into the analysis of the results for the
ensemble method (decision tree algorithms), the Fig-
ures 3 show the variables ordered by the models of
Extreme Gradient Boosting Linear and Random For-
est (the best in terms of adaptation to the model). The
differences in the first positions derive from the de-
termination of the importance of the explanatory vari-
ables for which the ”variants” of the basic regressor
of the two models are produced. The Extreme Gra-
dient Boosting produces variants with a greater focus
on ”difficult” examples and produces a reduction of
the forecast error in sequential terms, while the Ran-
dom Forest produces variants by introducing random-
ness into the tree construction process thanks to the
bootstrap aggregation meta-algorithm that guides the
Digital Device and Mathematics: Multilevel vs Machine Learning Models for Value-added Ranking in Italy
175
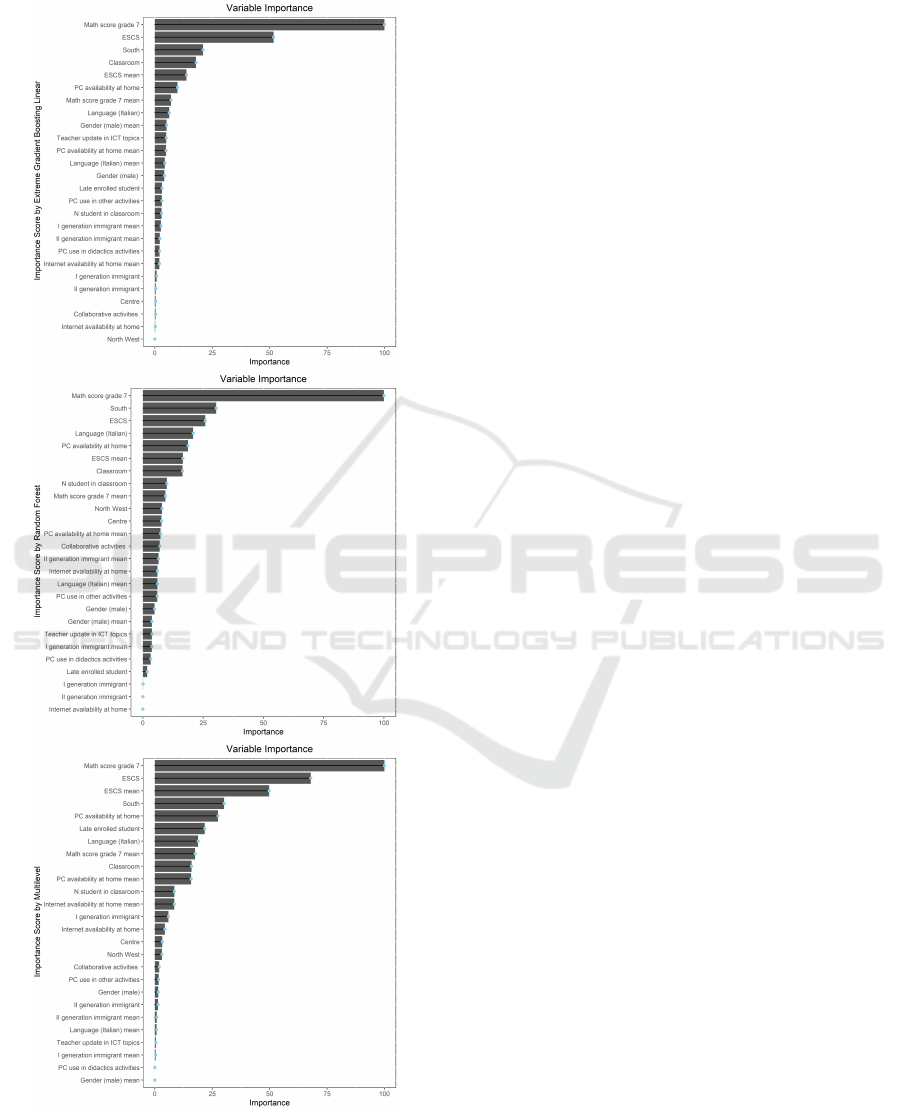
random choice predictors to use for each tree (James
et al., 2013).
Figure 3: Variable importance score by Extreme Gradient
Boosting, Random Forest and Multilevel models.
Which of these produces a more ”accurate” im-
portance of the variables is difficult to pinpoint with
certainty (Breiman et al., 1984). However, the impor-
tance of each independent variable is calculated based
on the reduction of the ”impurity” compared to the av-
erage of all decision trees: it is nothing more than the
weighted average of each explanatory variable in the
creation of the node. As usual in machine learning
algorithms, the importance of the predictors is calcu-
lated with training that reduces the error propagated
in each subsequent training step and the important
values of the predictors vary from 1 to 0 (and trans-
formed into a percentage below). Focusing on the
analysis of variables with greater relative importance
in the training process, observing the jump in the Fig-
ures 3, the most important predictors are the aver-
age class ESCS, the class, the computer ownership
at home, the prevailing language is spoken at home
(Italian), the ESCS, the belonging to a class of South-
ern Italy, insufficient scoring in grade 7 in Mathemat-
ics, both at individual and class level. The insufficient
scoring in grade 7 is predominant, both at the indi-
vidual and class level because it is the student’s en-
try rating according to the evaluation of the teacher’s
performance. The effects of all other characteristics
diminish, even at the class level, indicating how the
favourable class context, in terms of prior preparation
in Mathematics, is crucial on individual outcomes of
the Standardized Invalsi test. As expected, obviously
along with the socio-economic and cultural status of
the household, computer equipment at home at the
individual level is important on individual outcomes
of the test, while one must scroll through the graphs
a bit to discern that of the class. Hence, ICT plays
an important role, specifically in the PC ownership
at home or to belonging to a class with a high av-
erage of PC ownership at home. What’s more, the
language spoken in the household is particularly in-
fluential on outcomes across models, along with the
class size and collaborative classroom activities (for
the RF model). The different models also highlight
the lower importance of the immigrant background (I
and II generation immigrant) and Internet connection
at home, in addition to gender (male) and classroom
activities with a personal computer.
6 CONCLUSION AND
DISCUSSION
This paper examined the contributions of Information
and Communication Technology to mathematics ed-
ucation (Q1) and the process for analyzing the mul-
tilevel value-added current approach, which included
CSEDU 2022 - 14th International Conference on Computer Supported Education
176

several statistical improvements (Q2). It started by
giving a formal problem description of digital device
and its definition related to mathematics, some re-
lated literature was discussed in which the more re-
cent studies of the impact of instructional computer
use in school settings has found mixed results and
vary across countries (Eickelmann et al., 2012; Hu
et al., 2018; Carstens et al., 2021), while further stud-
ies on the Internet connection and a Personal com-
puter at home shown positive effects on school per-
formance (Wittwer and Senkbeil, 2008). It is not sim-
ply having access to an ICT at home or in school that
can influence in positive terms school learning (which
instead would provide negative outcomes) but rather
the relative ability to use and control it. From the
review of the international literature, about the rela-
tionship between digital learning and learning in the
classroom, the students have greater difficulty using
the computer equipment effectively when teachers do
not work in the classroom to develop shared prac-
tices in the use of technology (Kozma, 2003; Balan-
skat et al., 2006; Burns, 2013; Drijvers, 2015; Bray
and Tangney, 2017; Viberg et al., 2020). According
to the research question Q1, confirmed from the ma-
chine learning models, the most important predictors
for mathematics education at the classroom level are
the ESCS, both at individual and classroom level, the
Personal Computer ownership at home, the language
is spoken at home (Italian), the belonging to a class-
room of Southern Italy (maybe in a pejorative con-
notation), the math score at grade 7, both at individ-
ual and class level. Here, Information and Commu-
nications Technology plays a part in the value-added
approach, specifically in terms of Personal Computer
ownership at home or belonging to a class with high
Personal Computer ownership at home. However,
the role of Information and Communication Tech-
nologies is a minor part compared to the ascribed
characteristics. Indeed, it can occasionally discour-
age students’ trouble and logical thinking if educa-
tion systems don’t borrow technology to meet their
tutoring needs. Therefore, it is essential to develop
a more articulated model in the Italian context, pos-
sibly taking cues from international efforts (Fraillon
et al., 2014), which discusses self-efficacy and the
use of Information and Communication Technology
also in the classroom setting. In addition, the value-
added score analysis suggests that technology-based
professional development by teachers is not so es-
sential. However, for a future where technologies
are crucial, school principals cannot ignore their im-
portance (Karakose et al., 2021). The capability to
break fine problems with group conditioning in the
school class tends to induce a disadvantage in the per-
formance of the individual test. The calculation test
score gap between first-generation immigrants, na-
tives and second-generation emigrants has verified the
OECD framework (Pe
˜
na-L
´
opez et al., 2017)) that’s
the language walls the key to explaining differences in
performance between these two groups of students, as
well as a major disadvantage in terms of implicit per-
ceptivity with access from home to a particular com-
puter. It remains to be explored how peer collabora-
tion activities are structured and how they interact in
the use of new information technologies. Recent stud-
ies show that the effectiveness of peer group activities
is strongly correlated with the strategies introduced
by the teacher to make it work, such as role assign-
ment, group contracts, anonymous peer assessments,
etc. (Chang and Brickman, 2018). Finally, the multi-
level hierarchical model is fully superimposable with
machine learning models that are recommended for
ranking added value. It should therefore be noted that
if a hierarchical model is not applicable, and there are
many other applications, the Extreme Gradient Boost-
ing models and the Random Forest could prove com-
plementary to hierarchical analysis to discover and
test complex relationships between variables in the
educative field also exploiting their predictive poten-
tial. However, it must be pointed out that it is still
challenging, especially for concepts such as value-
added scores in classes, where the goal is still to in-
terpret and know in depth what are the factors that
influence the effectiveness of one class rather than an-
other, to use machine learning models without a con-
solidated conceptual scheme.
REFERENCES
Balanskat, A., Blamire, R., and Kefala, S. (2006). The ict
impact report. European Schoolnet, 1:1–71.
Bray, A. and Tangney, B. (2017). Technology usage in
mathematics education research–a systematic review
of recent trends. Computers & Education, 114:255–
273.
Breiman, L., Friedman, J., Olshen, R., and Stone, C. (1984).
Cart. Classification and Regression Trees; Wadsworth
and Brooks/Cole: Monterey, CA, USA.
Burns, M. (2013). Success, failure or no significant dif-
ference: Charting a course for successful educa-
tional technology integration. International Journal
of Emerging Technologies in Learning, 8(1).
Carstens, K. J., Mallon, J. M., Bataineh, M., and Al-
Bataineh, A. (2021). Effects of technology on stu-
dent learning. Turkish Online Journal of Educational
Technology-TOJET, 20(1):105–113.
Chang, Y. and Brickman, P. (2018). When group work
doesn’t work: Insights from students. CBE—Life Sci-
ences Education, 17(3):ar52.
Digital Device and Mathematics: Multilevel vs Machine Learning Models for Value-added Ranking in Italy
177

Commission, E. (2020). Shaping europe’s digital future.
Davidson, N. (1990). Cooperative Learning in Mathemat-
ics: A Handbook for Teachers. ERIC.
Desimoni, M. (2018). I livelli per la descrizione degli esiti
delle prove invalsi.
DiMaggio, P., Hargittai, E., Neuman, W. R., and Robinson,
J. P. (2001). Social implications of the internet. An-
nual review of sociology, 27(1):307–336.
Drijvers, P. (2015). Digital technology in mathematics edu-
cation: Why it works (or doesn’t). In Selected regular
lectures from the 12th international congress on math-
ematical education, pages 135–151. Springer.
Eickelmann, B., Drossel, K., Wendt, H., and Bos, W.
(2012). Ict-use in primary schools and children’s
mathematics achievement-a multi-level approach to
compare educational systems through an international
lens with timss data. In Joint AARE APERA Interna-
tional Conference, WERA focal meeting, Sydney, vol-
ume 2012.
Fraillon, J., Ainley, J., Schulz, W., Friedman, T., and Geb-
hardt, E. (2014). Preparing for life in a digital age:
The IEA International Computer and Information Lit-
eracy Study international report. Springer Nature.
Hu, X., Gong, Y., Lai, C., and Leung, F. K. (2018). The
relationship between ict and student literacy in math-
ematics, reading, and science across 44 countries: A
multilevel analysis. Computers & Education, 125:1–
13.
INVALSI (2017). Nota metodologica sul questionario in-
segnante revisione 2017 2018.
INVALSI (2018). Le prove computer based per la rile-
vazione nazionale degli apprendimenti invalsi 2018:
aspetti metodologici.
ISTAT (2018). Indagine multiscopo sulle famiglie, aspetti
della vita quotidiana.
James, G., Witten, D., Hastie, T., and Tibshirani, R. (2013).
An introduction to statistical learning, volume 112.
Springer.
Karakose, T., Yirci, R., and Papadakis, S. (2021). Exploring
the interrelationship between covid-19 phobia, work–
family conflict, family–work conflict, and life sat-
isfaction among school administrators for advancing
sustainable management. Sustainability, 13(15):8654.
Kozma, R. B. (2003). Technology and classroom practices:
An international study. Journal of research on tech-
nology in education, 36(1):1–14.
Levy, J., Brunner, M., Keller, U., and Fischbach, A.
(2019). Methodological issues in value-added mod-
eling: an international review from 26 countries. Ed-
ucational Assessment, Evaluation and Accountability,
31(3):257–287.
Levy, J., Mussack, D., Brunner, M., Keller, U., Cardoso-
Leite, P., and Fischbach, A. (2020). Contrasting clas-
sical and machine learning approaches in the estima-
tion of value-added scores in large-scale educational
data. Frontiers in psychology, 11:2190.
NTIA (1995). Falling through the net: A survey of the
”have nots” in rural and urban America. ERIC Clear-
inghouse.
Papadogiannis, I., Poulopoulos, V., and Wallace, M. (2020).
A critical review of data mining for education: what
has been done, what has been learnt and what remains
to be seen. International Journal of Educational Re-
search Review, 5(4):353–372.
Pe
˜
na-L
´
opez, I. et al. (2017). Oecd digital economy outlook
2017. OECD Publishing.
Rasch, G. (1960). Studies in mathematical psychology: I.
probabilistic models for some intelligence and attain-
ment tests.
Rutkowski, D., Rutkowski, L., B
´
elanger, J., Knoll, S.,
Weatherby, K., and Prusinski, E. (2013). Teaching
and learning international survey talis 2013: Concep-
tual framework. OECD Publishing.
van Dijk, J. A. (2005). The deepening divide: Inequality in
the information society. Sage Publications.
Viberg, O., Gr
¨
onlund,
˚
A., and Andersson, A. (2020). Inte-
grating digital technology in mathematics education:
a swedish case study. Interactive Learning Environ-
ments, pages 1–12.
Wittwer, J. and Senkbeil, M. (2008). Is students’ computer
use at home related to their mathematical performance
at school? Computers & Education, 50(4):1558–
1571.
CSEDU 2022 - 14th International Conference on Computer Supported Education
178
