
Selection of Hydrographic Objects in NHD 100K Streams from NHD
24K Streams using Drainage Networks Derived from Digital
Elevation Models
K. Mirzayev
1
and T. Gökgöz
2a
1
Graduate School of Science and Engineering, Yildiz Technical University, 34220 Esenler, Istanbul, Turkey
2
Department of Geomatic Engineering, Civil Faculty, Yildiz Technical University, 34220 Esenler, Istanbul, Turkey
Keywords: Cartographic Generalization, Hydrographic Objects, Digital Elevation Models, Hydrologic Analysis,
Drainage Networks.
Abstract: The hydrographic objects in 100K NHD (National Hydrographic Dataset) are conventionally derived by
generalization. Besides, drainage networks may also be derived from the digital elevation models according
to the stream thresholds. This study aims to derive the streams in 100K NHDs from 24K NHDs by means of
drainage networks derived from a 10 m resolution digital elevation models. For this purpose; 1) 24K streams
corresponding to 100K streams, 2) 24K streams as many as the number of 24K streams corresponding to
100K streams, 3) 24K streams as many as the number of objects calculated by Töpfer’s formula, and 4) 24K
streams as many as the number of midpoints of 24K streams corresponding to 100K streams are selected by
means of drainage networks derived from a 10 m resolution digital elevation model. Twelve experiments were
conducted to test the suitability of the four approaches in three sub basins (i.e. Big Run, Seneca and Strait in
South Branch Potomac Basin in the WV, USA) chosen as the study areas. As a result, none of the approaches
was able to select all 24K streams corresponding to 100K streams without any over- or under-represented
24K streams.
1 INTRODUCTION
Spatial databases that store multiple representations
of the same geographic phenomena are called as
multi-representation databases. Multi-representation
databases can be mainly created via cartographic
generalization. In other words, smaller scale
representations can be obtained from a single large-
scale database via cartographic generalization
mainly. Cartographic generalization is considered as
one of the most intellectually and technically
challenging components of mapmaking. In
cartographic generalization, the first step is the
selection of objects and attributes from the initial
database (McMaster and Shea, 1992; Chaudhry and
Mackaness, 2008; Gökgöz et al., 2015; Stum, et al.,
2017). The early work related to the selection issue
was inspired by the “Selection Principle” or “Radical
Law” of Töpfer and Pillewiser (1966), which
a
https://orcid.org/0000-0001-8716-6131
computes the number of objects to be selected with
(1).
𝑛
=𝑛
𝑚
𝑚
⁄
(1
)
where 𝑛
is the number of objects that can be shown
at the derived scale, 𝑛
is the number of objects
shown on the source map, and 𝑚
and 𝑚
are the
scale denominators of the source and the derived map,
respectively. Radical law is still unique from the view
of the quantitative dimension of generalization. It has
been widely used for many types of objects such as
buildings, road networks, stream networks, contour
lines, etc. in a spatial database, even if it does not
reveal which of the objects should be chosen.
However, there have been some more specific
attempts to develop approaches/methods that are
especially geared towards the stream networks
(Horton, 1945; Strahler, 1957; Richardson, 1994;
Thompson and Brook, 2000; Itzhak et al., 2001; Ai et
130
Mirzayev, K. and Gökgöz, T.
Selection of Hydrographic Objects in NHD 100K Streams from NHD 24K Streams using Drainage Networks Derived from Digital Elevation Models.
DOI: 10.5220/0011064800003185
In Proceedings of the 8th International Conference on Geographical Information Systems Theory, Applications and Management (GISTAM 2022), pages 130-137
ISBN: 978-989-758-571-5; ISSN: 2184-500X
Copyright
c
2022 by SCITEPRESS – Science and Technology Publications, Lda. All rights reserved
al., 2006; Touya, 2007; Stanislawski, 2009; Sen and
Gokgoz, 2012; Sen et al., 2014; Sen and Gokgoz,
2015; Stanislawski, et al., 2017; Gokgoz and Hacar,
2019; Li, et al., 2020). This study aims to select the
stream objects by means of drainage networks
derived from digital elevation models (DEMs). This
study is the extension of the study performed by
Gokgoz and Hacar (2019) for the same purpose.
The determinant parameter in deriving the
drainage networks from DEMs is stream threshold
that is defined as a number of cells indicating where
a stream should start. Stream threshold can be
determined in accordance with the several approaches
(Li et al., 2005; Chang, 2006; Ozulu and Gokgoz,
2018). Widely used Geographic Information Systems
tools present 1% of the maximum flow accumulation
value to the user as the default (Oliveira et al., 2002).
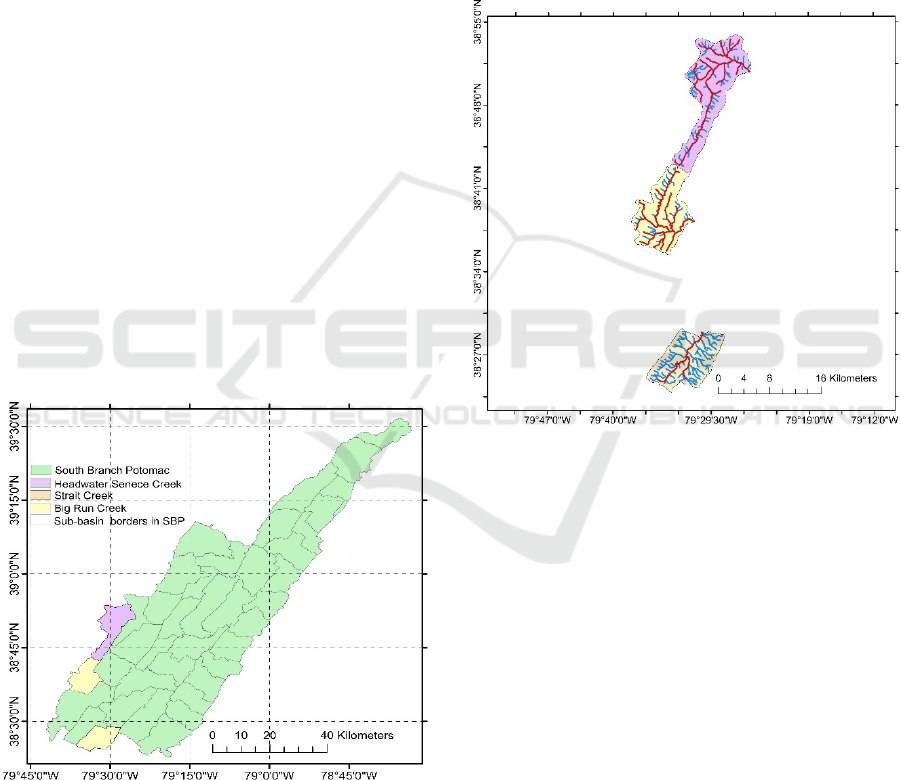
2 STUDY AREAS AND DATA
Three sub-basins, i.e. Big Run, Seneca and Strait,
which lies within South Branch Potomac Basin in the
WV, USA, were chosen as the study areas. South
Branch Potomac Basin is located at middle latitude
zone (between 38.23 and 39.25° latitudes) and
northeast-southwest elongated (between 79.46 and
78.44° longitudes) and it is approximately 3032.05
km
2
(Figure 1).
Figure 1: Sub-basins (Strait, Big Run, Seneca), which lies
within South Branch Potomac.
Data obtained from USGS by means of “USGS
TNM 2.0 Viewer” in Geographic Coordinate System
(WGS 1984) was transformed to Albers projection. In
hydrological analyzes, length and area information
are more important than angle (shape) information.
For these reasons, Albers equal-area conical
projection was preferred in this study.
24K (1:24,000) and 100K (1:100,000) streams in
the boundary of the sub-basin Big Run, Seneca and
Strait are represented in Figure 2. The numbers of
24K (blue) and 100K (white) streams in the boundary
of sub-basin Big Run are 71 and 21, in Seneca are 131
and 25 and in Strait are 129 and 3, respectively. The
number of 24K streams corresponding to 100K
streams in Big Run, Seneca and Strait are 43, 72 and
26, respectively.
Figure 2: 24K (blue) and 100K (red) streams in Big Run,
Seneca and Strait.
3 METHODOLOGY
In order to derive the streams in 100K NHD dataset
from 24K dataset, 1) 24K streams corresponding to
100K streams, 2) 24K streams as many as the number
of 24K streams corresponding to 100K streams, 3)
24K streams as many as the number of objects
calculated by Töpfer’s formula, and 4) 24K streams
as many as the number of midpoints of 24K streams
corresponding to 100K streams are selected by means
of drainage networks derived from a 10 m resolution
digital elevation model. Hereafter, these four
approaches are called as “Equal Object”, “Equal
Number of Objects”, “Töpfer” and “Midpoints”
approaches, respectively. In each approach, the
appropriate stream threshold is determined by trial
and error.
Selection of Hydrographic Objects in NHD 100K Streams from NHD 24K Streams using Drainage Networks Derived from Digital
Elevation Models
131
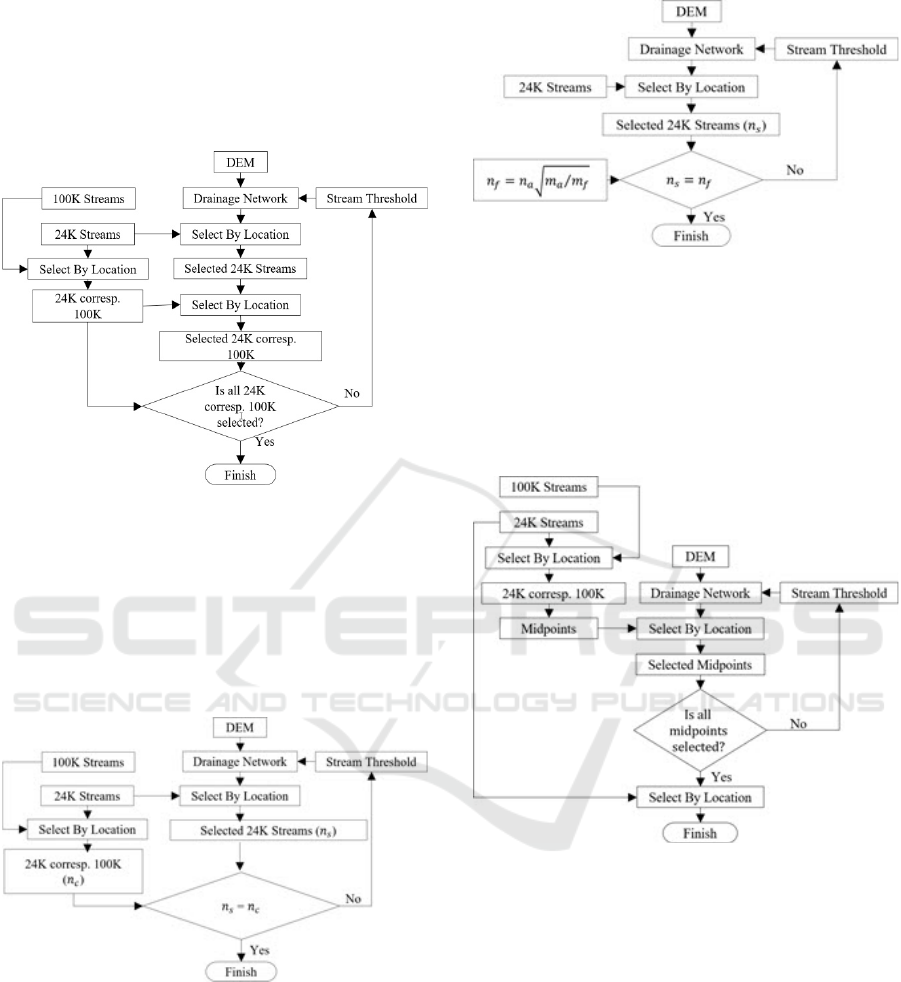
3.1 The First Approach: Equal Object
In this approach, it is aimed to select all 24K streams
corresponding to 100K streams and accordingly the
steps shown in the flow chart in Figure 3 are
conducted.
Figure 3: Flow chart of the Equal Object.
3.2 The Second Approach: Equal
Number of Object
In this approach, it is aimed to select 24K streams as
many as the number of 24K streams corresponding to
100K streams and accordingly the steps shown in the
flow chart in Figure 4 are conducted.
Figure 4: Flow chart of the Equal Number of Objects (n
is
the number of selected 24K streams and n
is the number
of 24K streams corresponding to 100K streams).
3.3 The Third Approach: Töpfer
In this approach, it is aimed to select 24K streams as
many as the number of objects calculated by (1) and
accordingly the steps shown in the flow chart in
Figure 5 are conducted.
Figure 5: Flow chart of the Töpfer.
3.4 The Fourth Approach: Midpoints
In this approach, it is aimed to select 24K streams as
many as the number of midpoints of 24K streams
corresponding to 100K streams and accordingly the
steps shown in the flow chart in Figure 6 are
conducted.
Figure 6: Flow chart of the Midpoints.
4 RESULTS
4.1 Result of the Equal Object
In the experiment conducted according to the first
approach, the desired drainage networks in Big Run,
Seneca and Strait were derived from DEM entering
the value of 5059, 4104 and 25554 as stream
thresholds, respectively.
In Big Run, Seneca and Strait, the number of
white and blue lines are 58 and 43 (Figure 7); 108 and
72 (Figure 8); 35 and 26 (Figure 9), respectively. It is
shown that each blue line overlaps a white line. It
means that all of the 24K streams corresponding to
GISTAM 2022 - 8th International Conference on Geographical Information Systems Theory, Applications and Management
132
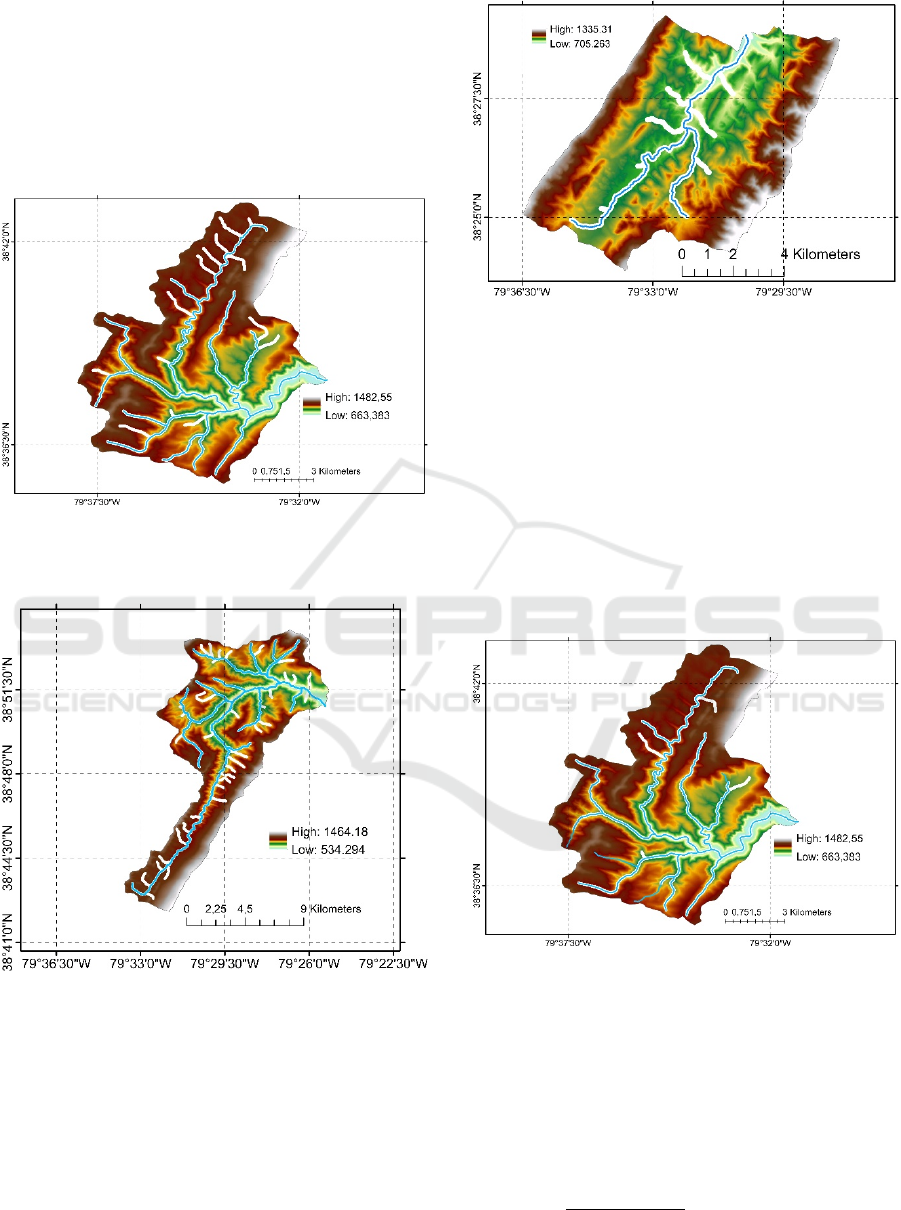
100K streams was selected by the drainage network
obtained according to the first approach. However,
15, 36 and 9 more 24K streams which do not
correspond to 100K streams were selected by the
drainage network. In other words, there were 15, 36
and 9 over-represented 24K streams in the output of
the first approach for Big Run, Seneca and Strait
respectively.
Figure 7: 24K streams selected by the drainage network
obtained according to the first approach (white) and 24K
streams corresponding to 100K streams (blue) in Big Run.
Figure 8: 24K streams selected by the drainage network
obtained according to the first approach (white) and 24K
streams corresponding to 100K streams (blue) in Seneca.
4.2 Result of the Equal Number of
Objects
In this experiment, the desired drainage networks in
Big Run, Seneca and Strait were derived from DEM
entering the value of 15355, 13410 and 56838 as
stream thresholds, respectively. The numbers of 24K
streams in each network are the same (i.e. 43, 72 and
Figure 9: 24K streams selected by the drainage network
obtained according to the first approach (white) and 24K
streams corresponding to 100K streams (blue) in Strait.
26, respectively). However, the streams in each
network do not overlap completely. While 4, 8 and
again 4 more 24K streams which do not appear in the
blue network were selected by the drainage network,
4, 8 and 4 of 24K streams which appear in the blue
network were not selected by the drainage line. In
other words, there were 4, 8 and 4 over-represented
and 4, 8 and 4 under-represented 24K streams in the
output of the second approach for the Big Run,
Seneca and Strait, respectively.
Figure 10: 24K streams selected by the drainage network
obtained according to the second approach (white) and 24K
streams corresponding to 100K streams (blue) in Big Run.
4.3 Result of the Töpfer
In the experiment conducted according to the third
approach, the numbers of streams to be selected by
the drainage networks in Big Run, Seneca and Strait
were firstly calculated by (1) as follows.
𝑛
=71
24000 100000
⁄
=34.78 ≅ 35
(Big Run)
Selection of Hydrographic Objects in NHD 100K Streams from NHD 24K Streams using Drainage Networks Derived from Digital
Elevation Models
133
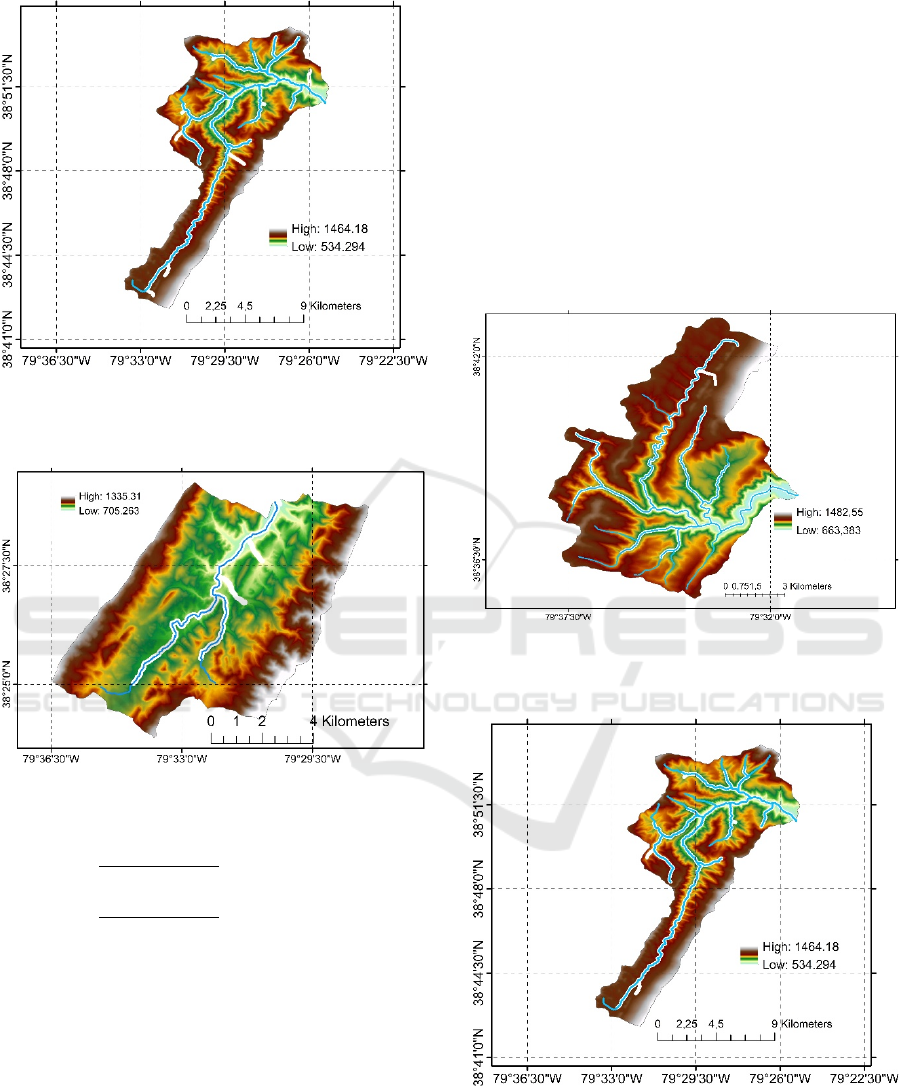
Figure 11: 24K streams selected by the drainage network
obtained according to the second approach (white) and 24K
streams corresponding to 100K streams (blue) in Seneca.
Figure 12: 24K streams selected by the drainage network
obtained according to the second approach (white) and 24K
streams corresponding to 100K streams (blue) in Strait.
𝑛
=131
24000 100000
⁄
= 64.17 ≅ 64
(Seneca)
𝑛
=126
24000 100000
⁄
= 61,72 ≅ 62
(Strait)
where 𝑛
is the number of 24K streams to be selected
by the drainage network; 71, 131 and 129 are the
number of 24K streams in Big Run, Seneca and Strait,
respectively.
The desired drainage networks in Big Run, Seneca
and Strait were derived from DEM entering the value
of 19213, 18060 and 11217 as stream thresholds,
respectively.
In Big Run and Seneca, the numbers of white and
blue lines are 35 and 43; 64 and 72, respectively. The
numbers of same and different 24K streams in each
network are 34 and 10; 60 and 16, respectively. While
1 and 4 more 24K streams which do not appear in the
blue network were selected by the drainage network,
9 and 12 of 24K streams which appear in the blue
network were not selected by the drainage network.
In other words, there were 1 and 4 over-represented
and 9 and 12 under-represented 24K streams in the
output of the third approach for Big Run (Figure 13)
and Seneca (Figure 14).
In Strait, as shown in Figure 15, the number of
white and blue lines are 62 and 26, respectively. It is
shown that each blue line overlaps a white line.
Meaning there were 36 over-represented 24K streams
in the output of the third approach.
Figure 13: 24K streams selected by the drainage network
obtained according to the third approach (white) and 24K
streams corresponding to 100K streams (blue) in Big Run.
Figure 14: 24K streams selected by the drainage network
obtained according to the third approach (white) and 24K
streams corresponding to 100K streams (blue) in Seneca.
GISTAM 2022 - 8th International Conference on Geographical Information Systems Theory, Applications and Management
134
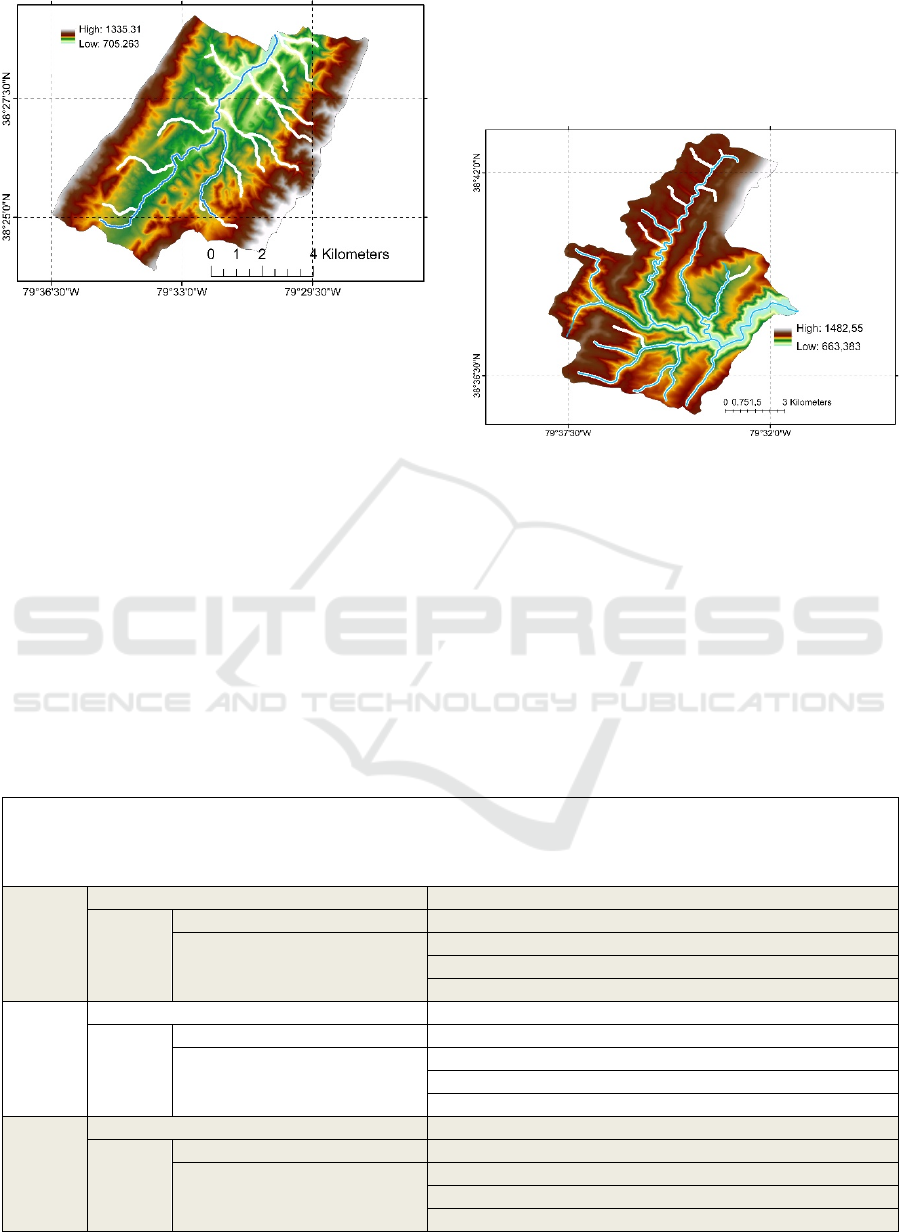
Figure 15: 24K streams selected by the drainage network
obtained according to the third approach (white) and 24K
streams corresponding to 100K streams (blue) in Strait.
4.4 Result of the Midpoints
In the experiment conducted according to the fourth
approach, the desired drainage networks in Big Run,
Seneca and Strait were derived from DEM entering
the value of 8645, 8679 and 64170 as stream
thresholds, respectively.
In Big Run, Seneca and Strait, the numbers of
white and blue lines are 50 and 43; 81 and 72; 25 and
26, respectively. The numbers of same and different
24K streams in each network are 41 and 11 for Big
Run, 67 and 19 for Seneca, 22 and 7 for Strait. While
9, 14 and 3 more 24K streams which do not appear in
the blue network were selected by the drainage
network, 2, 5 and 4 of 24K streams which appear in
the blue network were not selected by the drainage
network. In other words, there were 9, 14 and 3 over-
represented and 2, 5 and 4 under-represented 24K
streams in the output of the last approach for Big Run,
Seneca and Strait, respectively
Figure 16: 24K streams selected by the drainage network
obtained according to the last approach (white) and 24K
streams corresponding to 100K streams (blue) in Big Run.
By comparing the statistical results at Table 1, it
is obvious that, as the stream threshold values
increases, the number of 24K streams selected by
derived drainage networks decreases.
Table 1: The statistics results of the experiments.
Equal
Object
Midpoints
Equal
Number
of
Objects
Töpfer
Big Run
Stream Threshold Value 5059 8645 15355 19213
24K
Streams
Selected by Drainage Network Number 58 50 43 35
Corresponding to 100K Streams
Same 43 41 39 34
Under-Rep. 0 2 4 9
Over-Rep. 15 9 4 1
Seneca
Stream Threshold Value 4104 8679 13410 18060
24K
Streams
Selected by Drainage Network Number 108 81 72 64
Corresponding to 100K Streams
Same 72 67 64 60
Under-Rep. 0 5 8 12
Over-Rep. 36 14 8 4
Strait
Stream Threshold Value 25554 64170 56838 11217
24K
Streams
Selected by Drainage Network Number 35 25 26 62
Corresponding to 100K Streams
Same 26 22 22 26
Under-Rep. 0 4 4 0
Over-Rep. 9 3 4 36
Selection of Hydrographic Objects in NHD 100K Streams from NHD 24K Streams using Drainage Networks Derived from Digital
Elevation Models
135
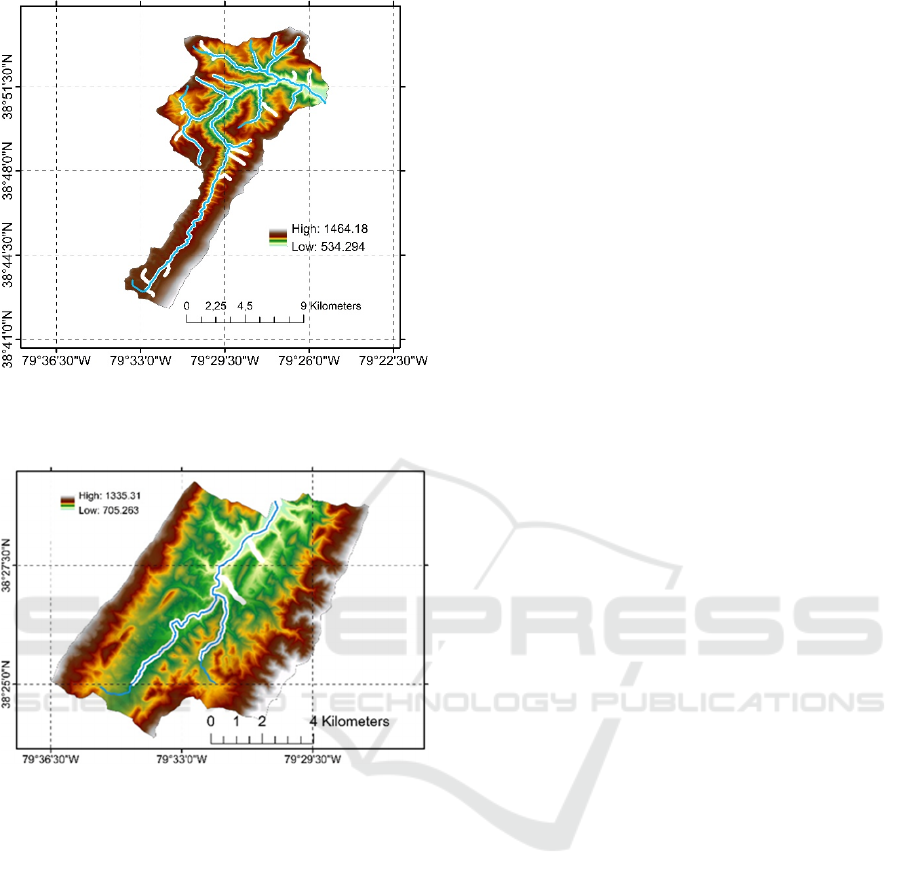
Figure 17: 24K streams selected by the drainage network
obtained according to the last approach (white) and 24K
streams corresponding to 100K streams (blue) in Seneca.
Figure 18: 24K streams selected by the drainage network
obtained according to the last approach (white) and 24K
streams corresponding to 100K streams (blue) in Strait.
5 CONCLUSIONS
Similar to the results of the early study performed by
Gokgoz and Hacar (2019), no correlation is observed
between the percentage of the increase in the stream
threshold and the percentage of the decrease in the
24K stream. Furthermore, none of the approaches is
able to select all 24K streams corresponding to 100K
streams without any over- or under-represented 24K
streams. However, when evaluating the results of this
study, the Strait should be especially taken into
account: it seems that far fewer rivers have been
selected by the cartographer than they should have
been. On the other hand, 100K streams could not be
already derived from 24K streams according to an
approach directly in practice: 24K streams selected
according to an approach are usually edited by the
cartographer. Therefore, the proposed approaches,
especially the fourth one (i.e. Midpoints), could be
useful for the cartographer.
REFERENCES
McMaster, R.B and Shea, K.S. (1992). Generalization in
Digital Cartography; Association of American
Geographers: Washington, DC, USA.
Chaudhry, O. and Mackaness, W.A. (2008). Automatic
identification of urban settlement boundaries for
multiple representation databases. Comput. Environ.
Urban Syst., 32, 95–109.
Gökgöz, T., Sen, A., Memduhoglu, A. and Hacar, M.
(2015). A new algorithm for cartographic simplification
of streams and lakes using deviation angles and error
bands. ISPRS Int. J. Geo-Inf., 4, 2185-2204.
Stum, A.K., Buttenfield, B.P. and Stanislawski, L.V., 2017.
Partial polygon pruning of hydrographic features in
automated generalization. Transactions in GIS, 21(5),
pp.1061-1078.
Töpfer, F. and Pillewizer, W. (1966). The principles of
selection. Cartogr J., 3, 10–16.
Horton, R.E. (1945). Erosional development of streams and
their drainage basins; hydrophysical approach to
quantitative morphology. Bull Geol Soc Am., 56, 275–
370.
Strahler, A.N. (1957). Quantitative analysis of watershed
geomorphology. Geophys Union., 38, 913–920.
Richardson, D. (1994). Generalization of spatial and
thematic data using inheritance and classification and
aggregation hierarchies. 6th International Symposium
on Spatial Data Handling, Sept 5–9, Edinburgh, UK.
Thomson, R.C. and Brooks, R. (2000). Efficient
generalization and abstraction of network data using
perceptual grouping. 5th International Conference on
GeoComputation, Aug 23–25, Greenwich, London,
UK.
Itzhak, E., Yoeli, P., Doytsher, Y. (2001). Analytic
generalization of topographic and hydrologic data and
its cartographic display – intermediate results. 20th
International Cartographic Conference. Aug 6–10,
Beijing, China.
Ai, T., Liu, Y., Chen, J. (2006). The hierarchical watershed
partitioning and data simplification of river network. In
Progress in spatial data handling; Riedl, A., Kainz, W.,
Elmes, G.A., Eds., Springer, Berlin, pp. 617–632.
Touya, G. (2007). River network selection based on
structure and pattern recognition. 23rd International
Cartographic Conference, Aug 4–9, Moscow, Russia.
Stanislawski, L.V. (2009). Feature pruning by upstream
drainage area to support automated generalization of
the United States national hydrography dataset. Comput
Environ Urban Sys., 33, 325–333.
GISTAM 2022 - 8th International Conference on Geographical Information Systems Theory, Applications and Management
136

Sen, A. and Gokgoz, T. (2012). Clustering approaches for
hydrographic generalization. GIS Ostrava 2012, Jan
23–25, Ostrava, Czech Republic.
Sen, A., Gokgoz, T., Sester, M. (2014). Model
generalization of two different drainage patterns by
selforganizing maps. Cartogr. Geogr. Inf. Sci., 41, 151–
165.
Sen, A. and Gokgoz, T. (2015). An experimental approach
for selection/elimination in stream network
generalization using support vector machines.
Geocarto International, 30(3), 311-329.
Stanislawski, Lawrence V., and Barbara P. Buttenfield.
(2017). "Preserving Line Sinuosity in Hydrographic
Feature Simplification.". Boulder Colorado, U.S.,
Gökgöz, T. and Hacar, M. (2019). Selection of
hydrographic objects in topo50 database from topo25
database using drainage networks derived from digital
elevation models. International Symposium on Applied
Geoinformatics (ISAG-2019), Nov 7–9, Istanbul,
Turkey.
Li, C., Wu, W., Wu, P., Yin, Y. and Dai, Z., 2020. Selection
Method of Dendritic River Networks Based on Hybrid
Coding for Topographic Map Generalization. ISPRS
International Journal of Geo-Information, 9(5), p.316.
Li, Z., Zhu, C., Gold, C. (2005). Digital terrain modeling:
principles and methodology. CRC Press, New York,
NY, USA.
Chang, K.T. (2006). Introduction to geographic
information systems. McGraw-Hill, New York, NY,
USA.
Ozulu, İ.M. and Gökgöz, T. (2018). Examining the stream
threshold approaches used in hydrologic analysis.
ISPRS Int. J. Geo-Inf., 7, 201.
Oliveira, F., Furnans, J., Maidment, D.R., Djokic, D., Ye,
Z. (2002). Arc Hydro: GIS for water resources. In Arc
Hydro: GIS for Water Resources; Maidment, D.R., Ed.;
ESRI, Inc.: Redlands, CA, USA; Volume 1, pp. 55–86.
Selection of Hydrographic Objects in NHD 100K Streams from NHD 24K Streams using Drainage Networks Derived from Digital
Elevation Models
137
