
Analyzing the Determinant Characteristics for a Good Performance at
ENADE Brazilian Exam Stratified by Teaching Modality: Face-to-face
versus Online
Eric Gondran
1 a
, Giancarlo Lucca
1 b
, Rafael Berri
1 c
, Helida Santos
1,2 d
and Eduardo N. Borges
1 e
1
C3, Universidade Federal do Rio Grande, Av. It
´
alia km 08, Rio Grande, Brazil
2
ISC, Universidad Publica de Navarra, Campus Arrosadia, Pamplona, Spain
Keywords:
ENADE, Feature Selection, Educational Data Mining, Data Science.
Abstract:
The National Student Performance Exam (ENADE) annually evaluates different Brazilian higher education
courses. This exam considers both face-to-face and distance learning courses. Distance learning is growing
increasingly, especially during the coronavirus (COVID-19) pandemic. This study applies different techniques
for selecting ENADE 2018 database characteristics, like information gain, gain rate, symmetric uncertainty,
Pearson correlation, and relief F. The objective of the work is to discover which personal and socioeconomic
characteristics are decisive for the student’s performance at ENADE, whether the student is in the context of
Distance Education or face-to-face. It can be concluded, among other results, that: the father’s level of edu-
cation directly influences performance; the higher the income, the better the performance; and white students
have better performance than black and brown-skinned ones. Thus, the results obtained in this study may
initiate analyzes of public policies towards improving performance at ENADE.
1 INTRODUCTION
Higher education is booming in Brazil, and according
to CES (acronym in Portuguese for Higher Education
Census) (Inep, 2019), from 2009 to 2019, enrollment
in higher education increased by 43,7%. CES con-
stitutes an essential instrument for obtaining data to
generate information that subsidizes public policies’
feeding, monitoring, and evaluation. In 2019, stu-
dents enrolled in higher education reached 8,6 mil-
lion, a growth of 5,4% compared to 2018. This in-
crease is due to distance learning (DL) (Barreto and
Amaral, 2019) which, from 2009 to 2019, increased
378,9 %. DL is a form of education in which learning
occurs at a distance (physical and temporal), mediated
by a technology tool that allows communication and
interaction between participants.
Directly linked to teaching, we have the National
Student Performance Exam (ENADE), an assessment
a
https://orcid.org/0000-0002-0013-3298
b
https://orcid.org/0000-0002-3776-0260
c
https://orcid.org/0000-0002-5125-2756
d
https://orcid.org/0000-0003-2994-2862
e
https://orcid.org/0000-0003-1595-7676
that annually analyzes the different Brazilian higher
education courses. This exam considers both on-site
and distance learning courses. The National Institute
of Educational Studies and Research An
´
ısio Teixeira
(Inep), a federal agency linked to the Ministry of Ed-
ucation (MEC), currently applies and elaborates this
exam. ENADE microdata is generated through the
examination, the minor level of granularity of col-
lected data. They meet the demand for specific in-
formation by providing tests, templates, information
about items (manual and dictionary), grades, and the
student questionnaire, which contains different infor-
mation regarding the candidate.
Considering the microdata from ENADE, this
work aims to find which personal and socioeconomic
characteristics are decisive for the student’s perfor-
mance, whether he/she is a DL or a face-to-face (F2F)
student. To achieve our objective, this work employs a
well-established methodology called Knowledge Dis-
covery in Database (KDD) (Tan et al., 2016). Ap-
plying data mining techniques in the field of edu-
cation has shown promising results, giving rise to a
new area of scientific investigation called Educational
Data Mining (EDM) (Baker et al., 2011).
234
Gondran, E., Lucca, G., Berri, R., Santos, H. and Borges, E.
Analyzing the Determinant Characteristics for a Good Performance at ENADE Brazilian Exam Stratified by Teaching Modality: Face-to-face versus Online.
DOI: 10.5220/0011070600003179
In Proceedings of the 24th International Conference on Enterprise Information Systems (ICEIS 2022) - Volume 1, pages 234-242
ISBN: 978-989-758-569-2; ISSN: 2184-4992
Copyright
c
2022 by SCITEPRESS – Science and Technology Publications, Lda. All rights reserved

This article is organized as follows. In Section 2,
we find the related works. In Sect. 3, feature selec-
tion techniques are presented. In Sect. 4, the adopted
methodology is described. The results are presented
in Sect. 5, and we have the conclusions in Sect. 6.
2 RELATED WORK
The possibilities for applying EDM techniques in
Brazil are presented by (Baker et al., 2011). The
study demonstrates how this area of research can con-
tribute to a better understanding of teaching and learn-
ing processes and student motivation. (Gottardo et al.,
2012) proposes the definition of a broad and gener-
alizable set of attributes used to make inferences re-
garding student performance. Experiments performed
showed indexes of 76% accuracy in predicting perfor-
mance. (Romero et al., 2008) highlights the possibil-
ities of using data mining to extract relevant informa-
tion about students in the educational context.
Specifically, at ENADE, (Ara
´
ujo et al., 2019) pro-
posed the use of knowledge discovery techniques to
develop a tool for exploring the exam data. In addi-
tion to evaluating the structure and distribution of test
data, they also proposed a model based on the CART
(Breiman et al., 1984) algorithm capable of predicting
student performance. (Faria, 2017) work has as its
primary objective the identification of the determin-
ing factors in the performance of students in Business
Administration courses. They used microdata from
ENADE 2012 of the Federal District. The research
has predominantly quantitative analysis characteris-
tics based on descriptive and multivariate statistical
techniques. The multiple regression method was used
to verify whether the student’s characteristics, such as
personal and socioeconomic aspects, the institution,
and the didactic-pedagogical organization, would be
significant variables in explaining the test result. The
results showed that the student relevant factors that
aided in predicting performance were: family income,
male gender, mother’s and father’s education level.
Unlike the works exposed above, our proposal
aims to apply different techniques for feature selec-
tion, to point out which personal and socio-economic
aspects are significant characteristics in explaining
the result of ENADE 2018.
3 FEATURE SELECTION
Feature Selection (FS) is the process of identifying
and removing irrelevant attributes and redundant in-
formation as much as possible (Miao and Niu, 2016).
FS reduces the dimensionality of the data. It improves
the performance of the classifiers, as it eliminates at-
tributes that do not add value to the classification or
deteriorate the results. It contributes to a better under-
standing and analysis of the results obtained and al-
lows learning algorithms to operate more quickly and
effectively. FS main objective is to identify the set of
attributes best representing the useful information in
the data (Tasca, 2015), within a context.
3.1 Entropy
Entropy (Shannon, 1948) is defined as a form of mea-
surement or average degree of uncertainty regarding
sources of information, which consequently allows a
quantification of the information present that flows in
the system. In simple terms, the concept of entropy is
associated with the idea that the more certain the out-
come of a random experiment, the more information
you get from observing its occurrence.
It can also be defined as the amount of uncer-
tainty in a message, which decreases as the sym-
bols are transmitted, that is, as the message becomes
known, then information is obtained, which can be
seen as uncertainty reduction. Entropy is calculated
by: E(A) = −
∑
a∈A
P(a)log
2
P(a), where A is the at-
tribute to be calculated, a is the value of this attribute
and P is the relative frequency of values.
3.2 Information Gain
The information gain (IG) (Hall and Smith, 1998) is
defined as the amount of information obtained about
a random variable or signal from the observation of
another random variable. It measures the significance
of the attribute with the target class; i.e., it measures
the reduction of uncertainty (entropy) as a division
function. As a disadvantage, it tends to prefer divi-
sions that result in numerous partitions, each one be-
ing small but neat. Information Gain is calculated by:
IG(A) = E(C) −
∑
a∈A
n
a
n
E(a), where E denotes the en-
tropy function, C is the class, A is the attribute to be
evaluated, n
a
is the number of instances of the cate-
gory belonging to the attribute, n is the total number
of instances and a is the attribute value.
3.3 Gain Ratio
The gain ratio (GR) (Karegowda et al., 2010) was de-
veloped to solve the IG problem. It is the ratio of IG
and the attribute entropy, which is nothing more than
the relative IG as an evaluation criterion. It adjusts
Analyzing the Determinant Characteristics for a Good Performance at ENADE Brazilian Exam Stratified by Teaching Modality:
Face-to-face versus Online
235

the IG by partitioning entropy, causing high entropy
partitioning (a large number of small partitions) to be
penalized. GR is defined by: GR(A) =
IG(A)
E(A)
, where
IG(A) is information gain and E is the entropy.
3.4 Symmetric Uncertainty
Symmetric uncertainty (SU) (Yu and Liu, 2003) is
a nonlinear correlation measure developed with the
same purpose of GR, that is, an attempt to normalize
the IG of an attribute A with the class C. SU is defined
by: SU(A) = 2 ·
IG(A)
E(A)+E(C)
, where IG(A) is Informa-
tion Gain and E is the entropy.
3.5 Pearson Correlation
Pearson Correlation (PC) (Hall, 1998), also known as
a linear coefficient, measures the degree of correlation
between two metric scale variables. It is a relationship
degree between two quantitative attributes, and it ex-
presses the correlation degree through values between
−1 (negative or inverse correlation) and 1 (positive
linear relationship). A correlation coefficient near
zero indicates no relationship between the attributes.
The PC is given by: PC(A) =
Cov(X,Y )
√
Var(X)∗Var(Y )
, where
Cov is the covariance between the two attributes and
Var is the variance of each attribute. To calculate the
qualitative attributes correlation, data are adapted by
turning them into binary data.
3.6 Relief F
Over the years, a Relief extension called Relief F
(Kononenko, 1994; Kira and Rendell, 1992; Ur-
banowicz et al., 2018) has been developed, aiming to
improve the original algorithm by estimating proba-
bilities more reliably. It handles multiclass and in-
complete datasets, while the complexity remains the
same. It is calculated using a function W defined by:
W (A) = W (A) −
di f f (A,R
i
,H)
m
+
di f f (A,R
i
,M)
m
, where A
is the attribute, W(A) is a vector with each attribute
score, R
i
is the target instance, H is the closest in-
stance of the same class, M is the closest instance to
the other class, m is the number of random instances
selected to be part of the calculation, and the function
di f f calculates the difference between attributes.
4 METHODOLOGY
In this section, we present the methodology used for
this study. We emphasize that the work is supported
by the KDD process, which comprises five stages.
1. Selection. This work takes into account ENADE
2018 microdata. They have 548,127 instances and
137 attributes of the numeric or character type.
The attributes are divided, among others, into the
institution and course information, student infor-
mation, the number of items in the objective part,
types of presence (participant present, absent or
canceled test), test perception questionnaire, and
student questionnaire. The original database was
divided into online students (96,927 instances)
and F2F students (451,200 instances). After an-
alyzing all database attributes, we focus on the
personal, socioeconomic aspects and participant’s
course. We emphasize that at this point, 23 at-
tributes were kept in each database
1
.
2. Preprocessing. The first preprocessing opera-
tion was the application of a filter to select only
those participants who had actually taken the test.
We removed 32,285 participants from the online
modality and 115,765 F2F students. The crite-
ria for removing attributes include absent candi-
dates, candidates with a blank test in the objective
and discursive part of general education, candi-
dates with a blank test in the objective and discur-
sive part of the specific component, participation
with a result disregarded by the Applicator. The
second step verified null or incomplete data, in-
cluding blank test notes and the blank part of the
questionnaire. We excluded 15 online cases and
103 F2F. Online databases had 64,627 instances,
and F2F had 335,332.
3. Transformation. The first operation was to re-
name the attributes. At this stage, 23 attributes
had names referring to the student’s questionnaire
number (QE I01 to QE In). The nominal values
of the attributes (A, B, etc.) were also renamed,
for example, the father’s level of schooling was
renamed to (None, Elementary 1, Elementary 2,
High school, Undergraduate, Graduate).
The courses were also grouped according to their
primary areas, according to the tables provided by
CNPq and CAPES, Brazilian funding agencies.
ENADE’s exam occurs every three years in a spe-
cific set of courses. Not all courses took the test in
2018. The scores obtained by the candidates were
also categorized, with their values discretized into
three frequency categories (low, medium, and
high performance), keeping the original distribu-
tion. Discretized online student grades perfor-
mance: Low (≤ 30), Medium (30 < grade ≤ 60)
1
The original database and the complete list of at-
tributes are available at – https://www.gov.br/inep/pt-
br/acesso-a-informacao/dados-abertos/microdados/enade
ICEIS 2022 - 24th International Conference on Enterprise Information Systems
236
and High (> 60). Discretized grades of face-to-
face students: Low (≤ 31), Medium (31 < grade
≤ 62) and High (> 62).
4. Data Mining. In this step, we apply the five dis-
tinct methods for FS. We consider the database
(online and F2F), taking into account 23 pre-
selected attributes. In Sect. 3 we present the ap-
plied FS algorithms in detail. For each algorithm,
the most relevant characteristics are selected ac-
cording to the ranking generated by the algo-
rithms. We also perform an exploratory analysis
of the most frequent attributes in all methods.
5. Interpretation and Evaluation. After apply-
ing the five FS methods and analyzing the rank-
ing generated by the algorithms, the top-10 most
frequent attributes are considered in at least four
of the FS algorithms, both for the students in
online and F2F modality. After choosing the
best attributes, we perform an exploratory anal-
ysis of each attribute. We generate graphics for
each modality and compare online and face-to-
face modality profiles. In Sect. 5, we present and
discuss the results of the exploratory analysis.
5 RESULTS
This section presents the results of applying the dif-
ferent FS algorithms.
5.1 Online Modality Results
This subsection presents the results obtained for the
FS techniques in the online modality data. Such re-
sults are available in Table 1, where the lines are the
22 attributes considered and the columns are the dif-
ferent FS methods. Each cell values refer to the re-
sult of the operation and the ranking obtained by the
attribute. The top ten values for each method are
underlined. In addition, we highlight in bold the at-
tributes selected in the first ten positions in at least
four of the algorithms used. At the end of the ta-
ble, the column Rank contains the sum of the four
best positions obtained by the different SA methods.
To define the most relevant characteristics to explain
the online students’ performance at ENADE 2018, we
considered the top-10 most frequent attributes in at
least four of the feature selection algorithms.
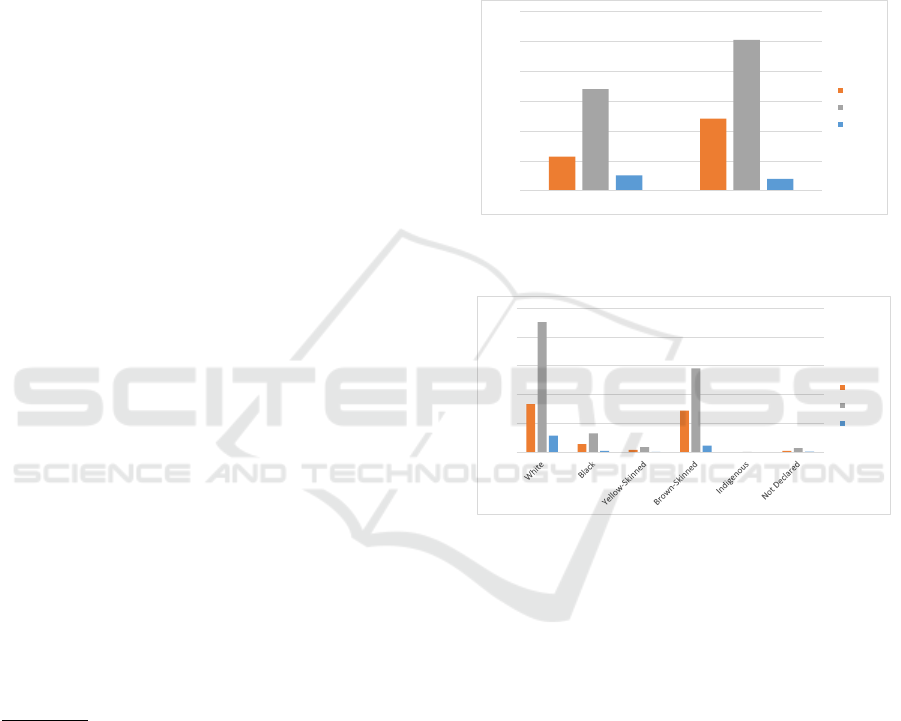
Analyzing the gender (Figure 1), most (60.8%)
of the participants are female, and however, they ob-
tained inferior results compared to the males. Analyz-
ing the skin color (Fig. 2), white people are predom-
inant, with 33,845 participants (52.4% of them) hav-
ing the most outstanding high-performance rates (9%)
and the least low-performance rates (25%). Brown-
skinned people is the second-highest rate of partic-
ipants (35.5%), having the worst high-performance
(5%) and one of the highest low-performance indices
(32%). Similarly, we find low-performance indices
for black, yellow, and indigenous people. Finally, the
best overall performance came from those who did
not declare their skin color.
5,722
12,068
17,013
25,245
2,598
1,981
0
5000
10000
15000
20000
25000
30000
Male Female
Low
Medium
High
Figure 1: Relationship between gender and participant per-
formance in the online modality.
8,364
1,429
428
7,237
64
268
22,575
3,314
937
14,570
107
755
2,906
285
91
1,165
10
122
0
5000
10000
15000
20000
25000
Low
Medium
High
Figure 2: Relationship between skin color and participant
performance in the online modality.
5.2 Face-to-face Modality Results
This subsection presents the results obtained when the
FS techniques are applied in the base that considers
the F2F modality. Such results are available in Table
2, using the same approach seen in Table 1.
The same criterion used in online education was
used to define the most important characteristics.
Most participants (289,580/86.4%) did not receive
any academic scholarship; 10% and 20% of them
presented high and low performances, respectively.
Those with a scholarship (Fig. 3) show a notable supe-
rior performance compared to the ones without it. We
highlight that scientific research and PET (acronym
in Portuguese for Tutorial Education Program) partic-
ipants have the most elevated high-performance (32%
and 35%) and the least low-performance (7% and
8%). Analyzing the weekly study time (Fig. 4), the
Analyzing the Determinant Characteristics for a Good Performance at ENADE Brazilian Exam Stratified by Teaching Modality:
Face-to-face versus Online
237
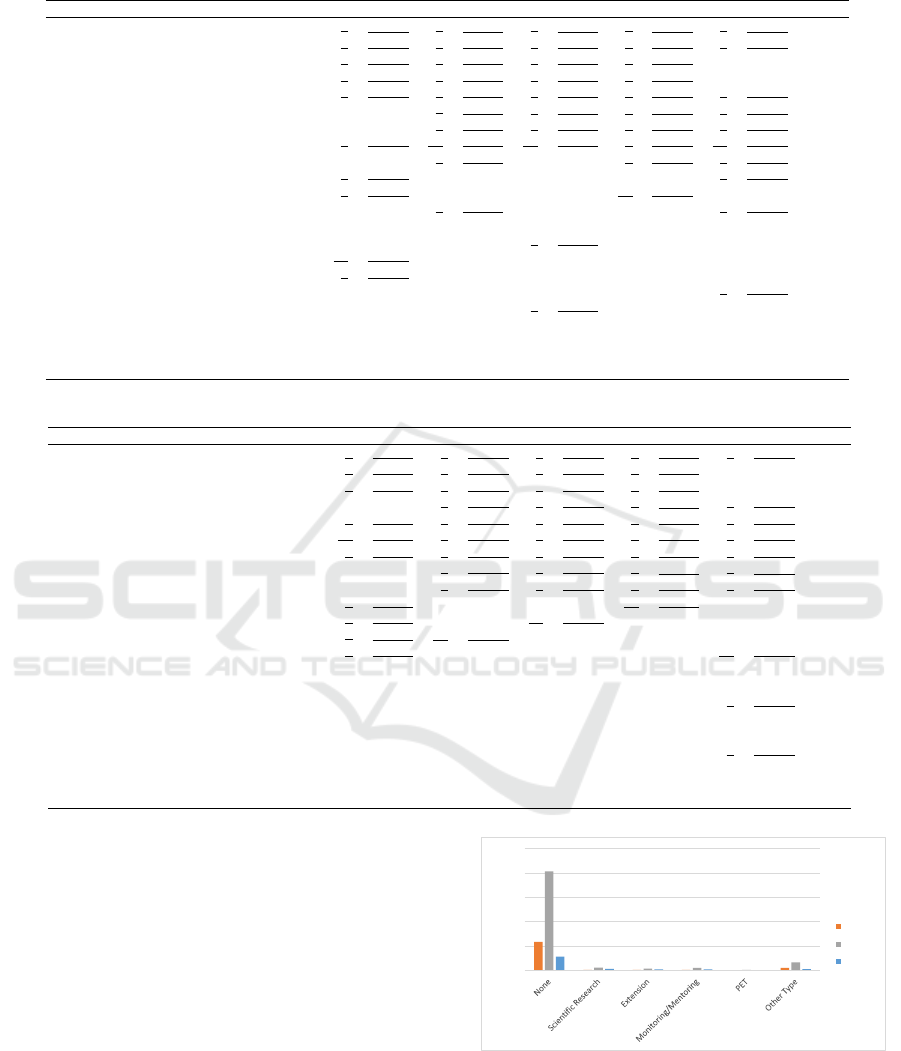
Table 1: Online modality results obtained with different feature selection methods.
# characteristics PC IG GR SU RF Rank
1 Knowledge Area 1 0.1255 2 0.0404 1 0.0377 1 0.0358 1 0.0415 4
2 Family Income 3 0.0445 1 0.0424 2 0.0177 2 0.0237 2 0.0412 7
3 Gender 2 0.0510 5 0.0108 4 0.0112 4 0.0100 13 0.0102 15
4 High School Education 6 0.0390 3 0.0139 3 0.0131 3 0.0124 11 0.0120 15
5 Scholarship/Funding 4 0.0436 7 0.0099 6 0.0050 6 0.0063 3 0.0229 20
6 Father’s Level of Education 17 0.0163 4 0.0113 5 0.0051 5 0.0067 6 0.0190 20
7 Chosen Course 13 0.0229 6
0.0102 7 0.0042 7 0.0057 4 0.0228 24
8 Skin Color 7 0.0373 10 0.0063 10 0.0040 8 0.0046 10 0.0128 35
9 Mother’s Level of Education 18 0.0128 8 0.0070 13 0.0031 9 0.0041 9 0.0173 39
10 Weekly Study Time 9 0.0333 11 0.0058 14 0.0031 12 0.0038 7 0.0189 39
11 Age 8 0.0369 12 0.0057 12 0.0034 10 0.0040 20 0.0029 42
12 Financial Status 15 0.0197 9 0.0069 16 0.0029 11 0.0039 8 0.0189 44
13 High School Modality 12 0.0244 13 0.0046 11 0.0037 13 0.0038 12 0.0111 48
14 Family’s Undergraduate Degree 14 0.0197 15 0.0040 8 0.0042 14 0.0037 14 0.0101 50
15 Work Status 10 0.0314 14 0.0046 15 0.0029 16 0.0033 16 0.0083 55
16 Marital Status 5 0.0402 18 0.0029 17 0.0019 17 0.0021 17 0.0081 56
17 People Living in your Household 19 0.0123 16 0.0039 20 0.0015 18 0.0021 5 0.0211 58
18 Social Inclusion Program 16 0.0163 17 0.0038 9 0.0041 15 0.0036 15 0.0083 60
19 Household Location and People in it 11 0.0310 19 0.0024 19 0.0017 19 0.0019 19 0.0065 68
20 Chosen Education Institution 21 0.0058 20 0.0016 22 0.0008 20 0.0010 18 0.0079 79
21 Academic Scholarship 20 0.0074 21 0.0004 21 0.0012 21 0.0005 21 0.0021 83
22 Student financial aid 22 0.0020 22 0.0001 18 0.0017 22 0.0002 22 0.0001 84
Table 2: Face-to-face modality results obtained with different feature selection methods.
# characteristics PC IG GR SU RF rank
1 Scholarship/Funding 5 0.0272 1 0.0337 2 0.0124 1 0.0173 1 0.0482 5
2 Academic scholarship 2 0.0431 3 0.0166 1 0.0206 2 0.0168 18 0.0080 8
3 High School Education 3 0.0360 4 0.0150 3 0.0111 3 0.0119 13 0.0130 13
4 Family Income 11 0.0196 2 0.0168 5 0.0065 5 0.0090 2 0.0360 14
5 Knowledge Area 1 0.0561 6 0.0124 4 0.0106 4 0.0106 6 0.0246 15
6 Chosen Course 10 0.0205 5 0.0130 6 0.0056 6 0.0075 3 0.0327 20
7 Weekly Study Time 8 0.0218 9 0.0104 7 0.0053 9 0.0066 5 0.0254 29
8 Father’s Level of Education 15 0.0149 7 0.0123 8 0.0052 7 0.0069 8 0.0229 30
9 Mother’s Level of Education 14 0.0155 8 0.0121 9 0.0051 8 0.0068 7 0.0231 32
10 Social Inclusion Program 9 0.0215 11 0.0063 11 0.0050 10 0.0051 11 0.0173 41
11 Family’s Undergraduate Degree 6 0.0229 14 0.0045 10 0.0050 11 0.0043 16 0.0090 41
12 Age 4 0.0297 10 0.0080 16 0.0030 12 0.0041 21 0.0017 42
13 Work Status 7 0.0219 12 0.0058 15 0.0030 14 0.0038 10 0.0174 43
14 Household Location and People in it 16 0.0138 13 0.0053 13 0.0035 13 0.0039 15 0.0093 54
15 Skin Color 17 0.0136 15 0.0040 18 0.0025 15 0.0029 12 0.0158 59
16 Financial Status 20 0.0108 16 0.0037 20 0.0015 19 0.0021 9 0.0229 64
17 Marital Status 13 0.0161 18 0.0030 17 0.0029 16 0.0027 20 0.0054 64
18 Chosen Education Institution 12 0.0182 17 0.0037 19 0.0018 18 0.0023 17 0.0088 64
19 People Living in your household 21 0.0077 19 0.0030 22 0.0011 21 0.0016 4 0.0269 65
20 High School Modality 22 0.0064 20 0.0026 14 0.0031 17 0.0026 19 0.0067 70
21 Student financial aid 19 0.0124 21 0.0015 12 0.0044 20 0.0019 22 0.0014 72
22 Gender 18 0.0135 22 0.0014 21 0.0015 22 0.0013 14 0.0112 75
majority (46.3%) studies from 1 to 3 hours a week,
with a high performance of 8% and a low perfor-
mance of 22%. Clearly, when the number of weekly
study hours increases, high-performance increases
and low-performance decreases. Considering the
mother’s education level (Fig. 5), those whose moth-
ers have no education or have completed just elemen-
tary school 1 and 2 have the worst high-performance
rates and the highest low-performance rates. Mothers
with undergraduate and graduate degree studies imply
better performance on student rates.
58,541
608
531
877
65
4,926
203,274
5,456
3,251
4,758
492
15,852
27,765
2,919
1,510
1,789
304
2,414
0
50000
100000
150000
200000
250000
Low
Medium
High
Figure 3: Relation of the type of academic scholarship and
the participant performance in the face-to-face modality.
ICEIS 2022 - 24th International Conference on Enterprise Information Systems
238
6,389
34,681
15,908
4,757
3,813
18,177
107,710
65,842
22,927
18,427
2,605
12,872
11,270
5,029
4,925
0
20000
40000
60000
80000
100000
120000
None Between 1-3
hours
Between 4-7
Hours
Between 8-12
Hours
Over 12 Hours
Low
Medium
High
Figure 4: Relation of weekly study hours and participant
performance in the face-to-face modality.
4,304
15,628
10,342
22,549
8,503
4,222
12,363
46,453
35,569
81,407
36,695
20,596
1,598
4,585
4,240
12,118
8,385
5,775
0
10000
20000
30000
40000
50000
60000
70000
80000
90000
Low
Medium
High
Figure 5: Relationship of mother’s level of education and
participant’s performance in the face-to-face modality.
5.3 Comparing Results between Online
and Face-to-face Modalities
In this section, we sought to compare the characteris-
tics in common between online and F2F participants,
in which we seek to understand the difference be-
tween these two profiles. Comparisons are shown in
Figures 6 to 11. For each figure (attribute), we will
perform an exploratory analysis.
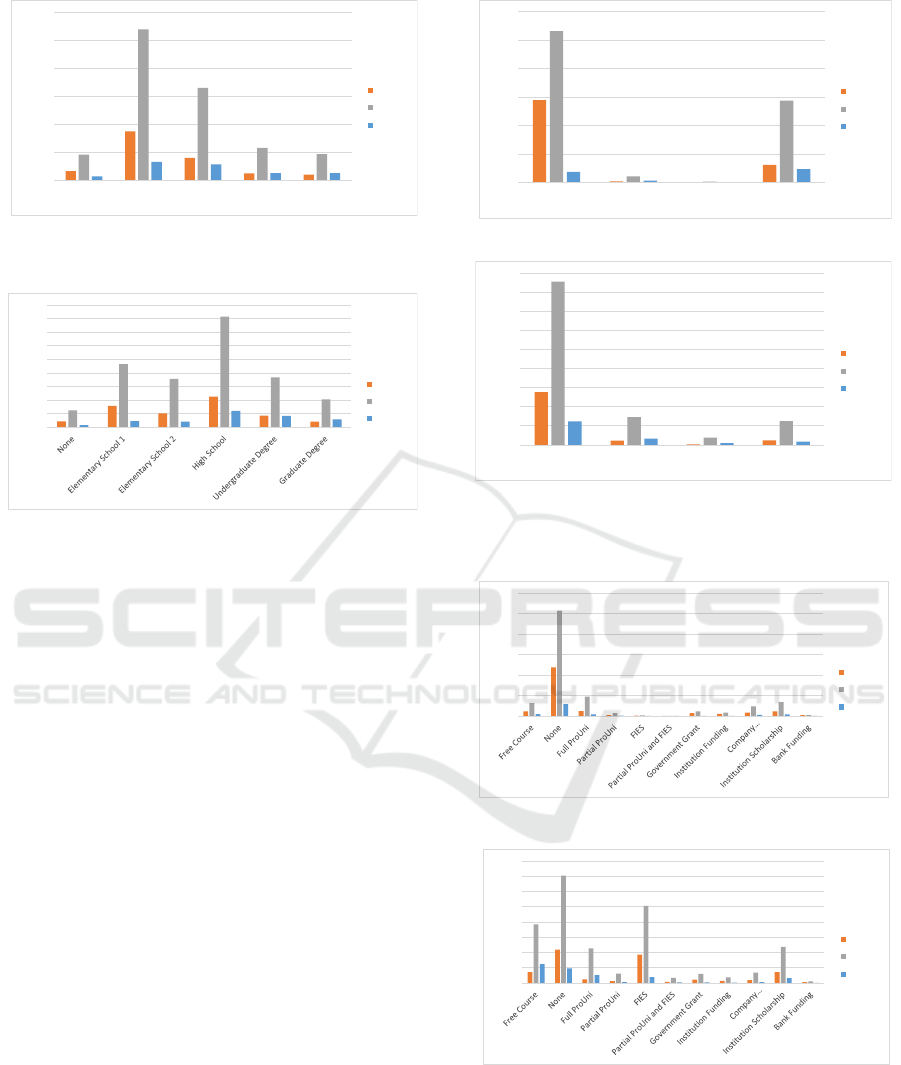
Analyzing Fig. 6, we can see a slight growth of
applied social sciences, going from 66.5% in online
modality to 74.9% in F2F. There is a better distribu-
tion in the F2F data in the other categories. Regard-
ing performance, there is an improvement in the F2F
students in applied social sciences. Among all cat-
egories in the online modality, human sciences have
the best overall performance with rates of 21% (high)
and 11% (low). In the F2F modality, the highlight is
Linguistics, Languages, and Arts with an efficiency of
18% (high) and 8% (low).
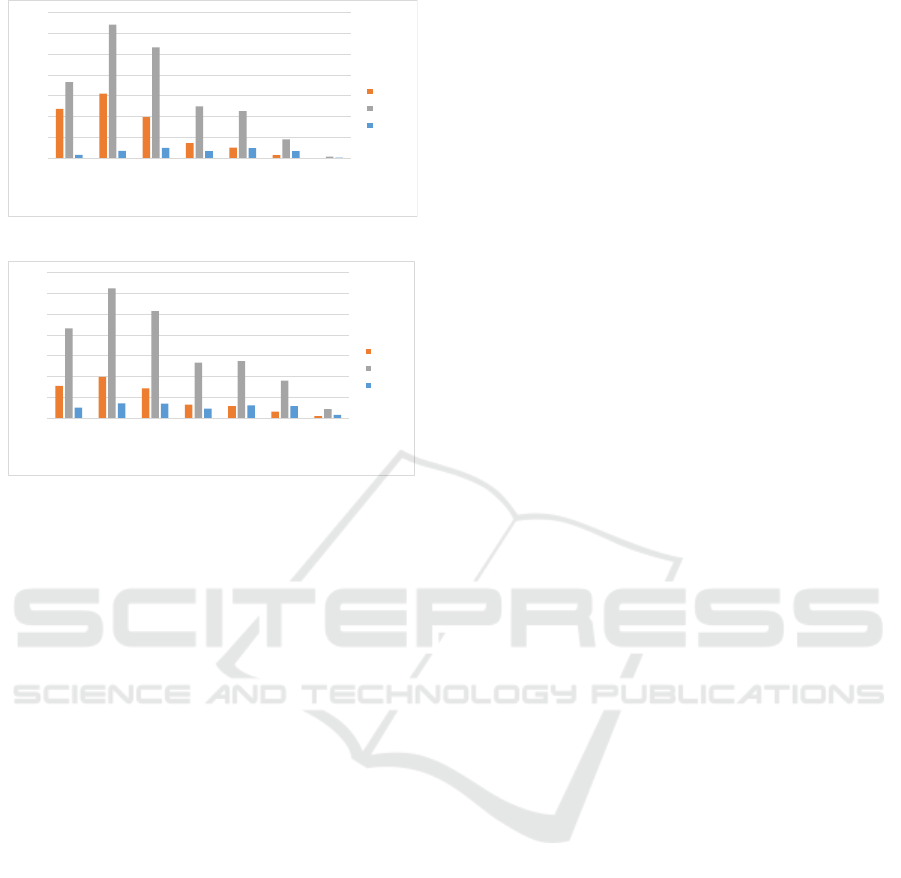
Observing the students who receive scholarships
or funding grants (Fig. 7), there is an increase in the
number of students in free courses and FIES (acronym
in Portuguese for Finance Fund for Higher Educa-
tion Students), in F2F modality. Better overall perfor-
mance can be seen in all on-site students, highlighting
free courses and fully funded ProUni students, who
rose from 10%, 6% to 21%, 17% respectively. Sadly,
14,500
175
11
3,104
26,641
1,096
150
14,371
1,861
336
36
2,346
0
5000
10000
15000
20000
25000
30000
Applied Social
Sciences
Human Sciences Linguistics,
Languages and Arts
Others
Low
Medium
High
(a) Online Modality
55,311
4,573
825
4,839
171,188
29,121
7,743
25,031
24,648
6,636
1,904
3,513
0
20000
40000
60000
80000
100000
120000
140000
160000
180000
Applied Social
Sciences
Human Sciences Linguistics,
Languages and Arts
Others
Low
Medium
High
(b) Face-To-Face Modality
Figure 6: Relation between knowledge area and partici-
pant’s online and face-to-face modality performance.
1,090
11,847
1,228
184
78
22
693
495
820
1,138
195
3,150
25,673
4,685
668
147
47
1,120
823
2,359
3,370
216
474
2,877
387
71
6
4
45
40
285
386
4
0
5000
10000
15000
20000
25000
30000
Low
Medium
High
(a) Online Modality
7,197
21,912
2,459
1,260
18,666
791
2,281
1,441
1,897
7,123
521
38,392
70,443
22,749
6,155
50,591
3,355
6,028
3,688
6,897
23,700
1,085
12,420
9,611
5,110
700
3,796
365
451
288
678
3,165
117
0
10000
20000
30000
40000
50000
60000
70000
80000
Low
Medium
High
(b) Face-To-Face Modality
Figure 7: Relation between scholarship/funding type and
participant’s online and face-to-face modality performance.
those with some scholarship or funding grants are the
worst performers in both modalities.
Considering the school type attended in high
Analyzing the Determinant Characteristics for a Good Performance at ENADE Brazilian Exam Stratified by Teaching Modality:
Face-to-face versus Online
239
14,987
1,312
9
1,013
459
10
33,047
5,045
34
2,534
1,558
40
2,857
1,201
9
274
223
15
0
5000
10000
15000
20000
25000
30000
35000
Public Private Overseas Mostly
Public
Mostly
Private
Partialy
Overseas
Low
Medium
High
(a) Online Modality
46,173
12,574
69
3,694
2,887
151
151,158
61,494
230
10,221
9,258
722
18,114
15,873
57
1,078
1,333
246
0
20000
40000
60000
80000
100000
120000
140000
160000
Public Private Overseas Mostly
Public
Mostly
Private
Partialy
Overseas
Low
Medium
High
(b) Face-To-Face Modality
Figure 8: Relation between participants’ high school type
and their performance in online and F2F modalities.
school (Fig. 8), we see most students are from pub-
lic schools. It is also noticeable that the proportion of
face-to-face students from private schools (26.8%) is
twice as much compared to online students, 11.7%.
Students’ performance from private schools presents
the best results for high and low performance.
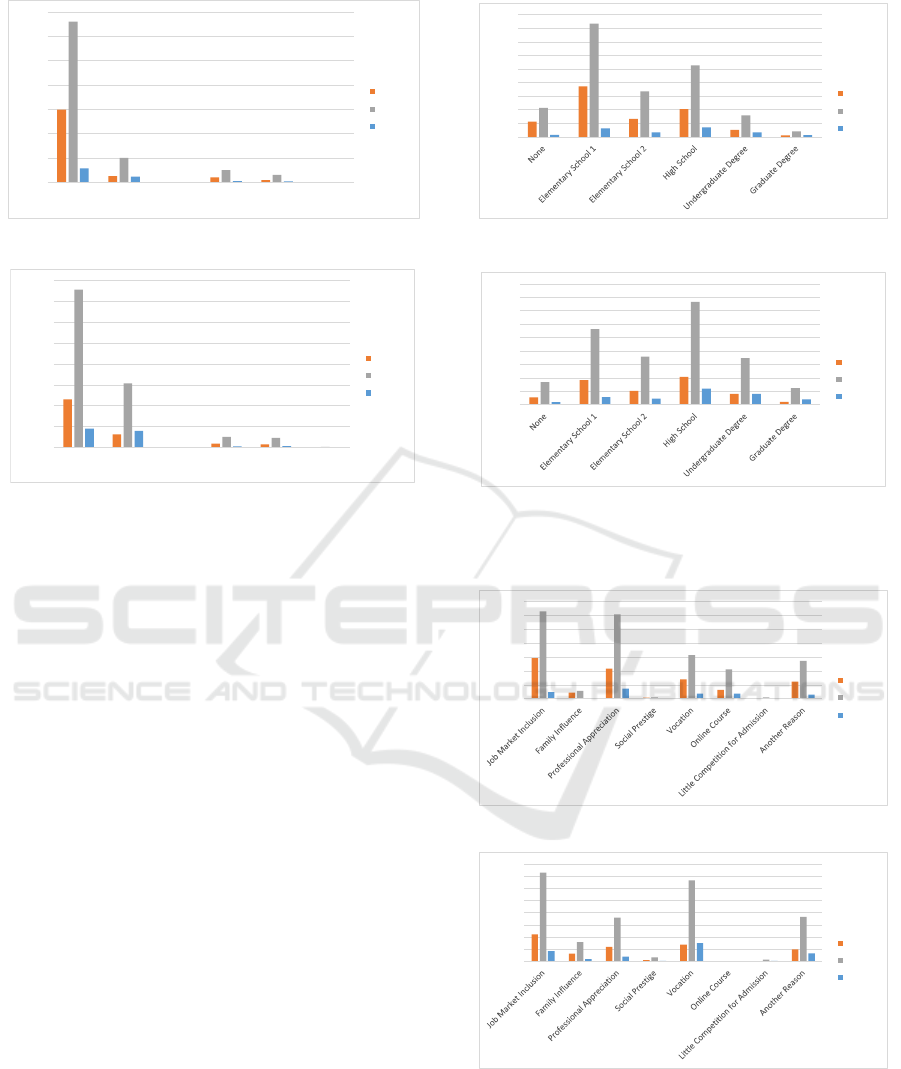
Regarding the parents’ level of education (Fig. 9),
in online modality, elementary school 1 is the major-
ity with 39.4%, whereas, in F2F modality, high school
predominates with 32.6%. There is an increase in
the F2F modality for those with a father having an
undergraduate and graduate degree education. It is
seen that as the level of education increases, the high-
performance index also increases.
The course choice by job market inclusion is
mostly seen in online and F2F modalities, as seen in
Fig. 10. Focusing on F2F participants’ performance,
we notice an increase in performance compared to on-
line students. We note that those who opt for an online
course have the best results in this same modality.
Analyzing the family income (Fig. 11), most stu-
dents have an income lower than 4.5 minimum wages
(mw). There is an increase in F2F students with a
family income above 10 mw. In performance, we ob-
serve F2F students with an income less than 6 mw
increase high performance. In both modalities, as in-
come increases, the high performance also increases.
2,263
7,460
2,673
4,122
1,058
214
4,279
16,714
6,700
10,555
3,179
831
301
1,282
665
1,421
653
257
0
2000
4000
6000
8000
10000
12000
14000
16000
18000
Low
Medium
High
(a) Online Modality
5,576
18,408
10,417
20,802
8,179
2,166
16,991
56,384
35,915
76,565
34,784
12,444
2,136
5,804
4,556
11,997
8,127
4,081
0
10000
20000
30000
40000
50000
60000
70000
80000
90000
Low
Medium
High
(b) Face-To-Face Modality
Figure 9: Relation between parents’ level of education and
participant’s online and face-to-face modality performance.
5,844
864
4,339
172
2,770
1,275
68
2,458
12,594
1,128
12,143
220
6,282
4,234
198
5,459
964
56
1,452
10
744
750
16
587
0
2000
4000
6000
8000
10000
12000
14000
Low
Medium
High
(a) Online Modality
22,155
6,246
11,936
1,151
13,730
22
324
9,984
73,009
15,781
36,053
3,370
66,738
81
1,448
36,603
8,391
1,845
3,989
508
15,073
10
384
6,501
0
10000
20000
30000
40000
50000
60000
70000
80000
Low
Medium
High
(b) Face-To-Face Modality
Figure 10: Relation between reason for choosing the course
and participant’s online and F2F modality performance.
ICEIS 2022 - 24th International Conference on Enterprise Information Systems
240
4,759
6,205
3,948
1,482
1,039
321
36
7,305
12,815
10,637
4,991
4,522
1,818
170
356
732
1,012
711
974
713
81
0
2000
4000
6000
8000
10000
12000
14000
Up to 1.5
Minimum
Wage
From 1.5
to 3
Minimum
Wage
From 3 to
4.5
Minimum
Wage
From 4.5
to 6
Minimum
Wage
From 6 to
10
Minimum
Wage
From 10 to
30
Minimum
Wage
Over 30
Minimum
Wage
Low
Medium
High
(a) Online Modality
15,411
19,739
14,283
6,371
5,712
3,145
887
43,200
62,329
51,408
26,638
27,313
17,948
4,247
4,979
7,017
6,914
4,500
6,104
5,700
1,487
0
10000
20000
30000
40000
50000
60000
70000
Up to 1.5
Minimum
Wage
From 1.5
to 3
Minimum
Wage
From 3 to
4.5
Minimum
Wage
From 4.5
to 6
Minimum
Wage
From 6 to
10
Minimum
Wage
From 10 to
30
Minimum
Wage
Over 30
Minimum
Wage
Low
Medium
High
(b) Face-To-Face Modality
Figure 11: Relation between family income and partici-
pant’s online and F2F modality performance.
6 CONCLUSIONS
In this paper, we applied educational data mining in
ENADE 2018 data set to find the main characteris-
tics related to performance, both in distance learning
and F2F modality. We used five different algorithms
for selecting attributes to 23 pre-selected personal and
socioeconomic characteristics. The essential charac-
teristics selected in both modalities were: knowledge
area, family income, public or private high school,
scholarships and funding, father’s level of education,
and reason for choosing the course. Gender and skin
color were also important for online modality. And
for the F2F modality, the type of academic scholar-
ship, weekly study time, and the mother’s schooling.
Parents’ education directly influenced the results,
and the higher the level of education, the better the
performance. Public universities were protagonists,
as students who paid no fees performed better than
those in private institutions, even if financed by gov-
ernment programs or scholarships from the institu-
tions. We see a direct and proportional relationship
between family income and student performance. The
higher the income, the better the high-performance in-
dex and the lower the low-performance index. Partic-
ipants who attended (fully or partially) private high
schools have an advantage over those who attended
public schools. Finally, we conclude that analyzing
the factors that influence the performance of under-
graduate students significantly contributes to a bet-
ter understanding of the national education panorama.
Besides, this study can help authorities make deci-
sions and propose new public policies concerning
Higher Education.
ACKNOWLEDGEMENTS
This study was supported by CNPq (305805/2021-5)
and PNPD/CAPES (464880/2019-00).
REFERENCES
Ara
´
ujo, R. A. et al. (2019). An
´
alise dos microdados do
enade: Proposta de uma ferramenta de explorac¸
˜
ao uti-
lizando minerac¸
˜
ao de dados. Master’s thesis, Univer-
sidade Federal de Goi
´
as.
Baker, R., Isotani, S., and Carvalho, A. (2011). Minerac¸
˜
ao
de dados educacionais: Oportunidades para o brasil.
Revista Brasileira de Inform
´
atica na Educac¸
˜
ao,
19(02):03.
Barreto, L. S. and Amaral, S. C. S. (2019). An
´
alise da
expans
˜
ao do ensino superior a dist
ˆ
ancia no contexto
brasileiro a partir do censo da educac¸
˜
ao superior de
2016. InterSciencePlace, 13(3).
Breiman, L., Friedman, J., Olshen, R., and Stone, C. (1984).
Classification and Regression Trees. Chapman and
Hall (Wadsworth and Inc.).
Faria, E. d. O. (2017). Uma an
´
alise dos fatores determi-
nantes do desempenho dos alunos dos cursos superi-
ores em administrac¸
˜
ao do distrito federal. Master’s
thesis, Universidade de Bas
´
ılia.
Gottardo, E., Kaestner, C., and Noronha, R. V. (2012).
Avaliac¸
˜
ao de desempenho de estudantes em cursos de
educac¸
˜
ao a dist
ˆ
ancia utilizando minerac¸
˜
ao de dados.
In Workshop de Desafios da Computac¸
˜
ao Aplicada
`
a
Educac¸
˜
ao, pages 30–39.
Hall, M. A. (1998). Correlation-based Feature Subset Se-
lection for Machine Learning. PhD thesis, University
of Waikato, Hamilton, New Zealand.
Hall, M. A. and Smith, L. A. (1998). Practical feature subset
selection for machine learning. In Australasian Com-
puter Science Conference ACSC’98, volume 20, pages
181–191, Berlin. Springer.
Inep (2019). Censo da educac¸
˜
ao superior. Access on: Oc-
tober, 2020.
Karegowda, A. G., Manjunath, A., and Jayaram, M. (2010).
Comparative study of attribute selection using gain ra-
tio and correlation based feature selection. Int. J. In-
formation Technology and Knowledge Management,
2(2):271–277.
Kira, K. and Rendell, L. A. (1992). A practical approach
to feature selection. In Sleeman, D. H. and Edwards,
P., editors, 9th Int. Workshop on Machine Learning,
pages 249–256. Morgan Kaufmann.
Analyzing the Determinant Characteristics for a Good Performance at ENADE Brazilian Exam Stratified by Teaching Modality:
Face-to-face versus Online
241

Kononenko, I. (1994). Estimating attributes: Analysis and
extensions of relief. In Machine Learning: ECML-94,
pages 171–182, Berlin, Heidelberg. Springer Berlin
Heidelberg.
Miao, J. and Niu, L. (2016). A survey on feature selection.
Procedia Computer Science, 91:919–926.
Romero, C., Ventura, S., and Garc
´
ıa, E. (2008). Data
mining in course management systems: Moodle
case study and tutorial. Computers & Education,
51(1):368–384.
Shannon, C. E. (1948). A mathematical theory of communi-
cation. The Bell System Technical Journal, 27(3):379–
423.
Tan, P.-N., Steinbach, M., and Kumar, V. (2016). Introduc-
tion to data mining. Pearson Education India.
Tasca, M. (2015). Contribuic¸
˜
oes ao Problema de Selec¸
˜
ao
de Atributos. PhD thesis, Universidade Federal Flu-
minense, Niter
´
oi, Rio de Janeiro.
Urbanowicz, R. J., Meeker, M., La Cava, W., Olson, R. S.,
and Moore, J. H. (2018). Relief-based feature selec-
tion: Introduction and review. Journal of biomedical
informatics, 85:189–203.
Yu, L. and Liu, H. (2003). Feature selection for high-
dimensional data: A fast correlation-based filter so-
lution. In Proc. Twentieth Int. Conference on Machine
Learning, pages 856–863. AAAI Press.
ICEIS 2022 - 24th International Conference on Enterprise Information Systems
242
