
Analyzing Student Programming Paths using Clustering and Process
Mining
Anis Bey and Ronan Champagnat
Laboratoire Informatique, Image, Interaction (L3i), La Rochelle University, La Rochelle, France
Keywords:
Computer Science Education, Unsupervised Learning, Students’ Behavior, Computer Programming, Behav-
ioral Interactions.
Abstract:
Learning programming is becoming more and more common across all curricula, as seen by the growing
number of tools and platforms built to assist it. This paper describes the results of an empirical study that
aimed to better understand students’ programming habits. The analysis is based on unsupervised classification
algorithms, including features from previous educational data mining research. The k-means method was used
to identify the behaviors of six students profiles. The main and interaction impacts of those behaviors on their
final course scores are tested using analysis of covariance.
1 INTRODUCTION
Computer literacy is currently booming. In Europe,
particularly Germany, and the United Kingdom, pro-
found educational transformations have been initiated
since 2016 to promote digital learning in schools and
prepare learners to acquire 21st-century skills, includ-
ing programming. In France, an educational reform of
High School curricula launched in 2019 offers a Dig-
ital and Computer Science option that includes more
than 350 hours of programming learning. This inter-
est in integrating programming learning skills early in
the curriculum requires prepared teachers and techno-
logical solutions to support them and their students in
their daily practices.
To enhance the instructional scaffold offered to
learners and help instructors make meaningful ped-
agogical decisions, researchers have been interested
in developing new approaches and tools to sup-
port learning programming (McHugh, 1998; Luxton-
Reilly et al., 2018). Recent initiatives based on
big data collections combined with data mining ap-
proaches aim at discovering hidden patterns and bet-
ter understanding learners’ behavior (Sharma, 2015;
Spacco et al., 2015), as previous research have shown
that the choice of resolution strategies in program-
ming affects learners’ performance (Soloway et al.,
1983).
Therefore, it is worth investigating what factors
influence student achievement in learning program-
ming. The present study examines students’ behavior
at a fine granularity level of analysis where we have
looked for students’ behavior at each exercise activity.
This approach goes beyond basic statistics or predic-
tive models based only on features. Learner behav-
ior analysis allows teachers/ITS (Intelligent Tutoring
Systems) to take the appropriate actions.
Consequently, the study addresses the following
research questions:
• How can we identify learners’ programming be-
havior?
• What behavioral interactions lead to suc-
cess/failure in a programming course?
The paper is structured as follows. The follow-
ing section presents prior work, whereas Section 3 ex-
poses the research context and presents how this study
was designed. Section 4 presents the obtained results.
Finally, the conclusion and future works are presented
in Section 5.
2 STATE OF THE ART
In state of the art about analysis of students’ program-
ming behavior, we can find two main research orien-
tations to analyze students’ behavior and predict suc-
cess in programming. The first is based only on fea-
tures extracted from the programming activities such
as the number of submissions, the number of compi-
lation, the difference in code edit, etc. and the second
is interested in students’ educational background and
76
Bey, A. and Champagnat, R.
Analyzing Student Programming Paths using Clustering and Process Mining.
DOI: 10.5220/0011077300003182
In Proceedings of the 14th International Conference on Computer Supported Education (CSEDU 2022) - Volume 2, pages 76-84
ISBN: 978-989-758-562-3; ISSN: 2184-5026
Copyright
c
2022 by SCITEPRESS – Science and Technology Publications, Lda. All rights reserved

external factors such as previous academic year and
computer experience, cognitive skills, personal infor-
mation, performance in other modules, etc. (Bergin
and Reilly, 2006; Bergin and Reilly, 2005). While
others combine the two categories, two obtain multi-
ple data sources for analysis (Koprinska et al., 2015).
Analysis of students’ learning behavior has been
a significant focus for MOOC learning analytics
(Boroujeni and Dillenbourg, 2018; Jiang Zhuox-
uan and Xiaoming, 2015). Like Edx and Cours-
era, MOOC platforms usually provide comprehensive
logs of students’ interactions with the MOOC plat-
form. These data enable researchers to perform learn-
ing behavior analytics at many different granulari-
ties, and behavior categories in MOOCs (Wang et al.,
2019).
On the other hand, numerous studies have been
carried out on information extracted from program-
ming, thanks to the availability of a wide range of
tools dedicated to learning programming. Thus, re-
searchers have become increasingly interested in col-
lecting log data on students’ programming processes
from these platforms and tools to analyze and predict
success/failure in programming.
Sharma et al. (Sharma K., 2018) and Adam et
al. (Carter et al., 2015) compute features per set of
exercises to predict success in the coding exercises.
Indicators from students’ testing behavior, reflecting
the time and effort differences between two succes-
sive unit test runs, were used. The authors tried to
show differences in students’ strategies within differ-
ent success levels based on the success in the coding
exercises. However, using only one local indicator
(success of the exercise) can give only a local insight
into students’ strategies, which could not show how
students evolve.
Wang et al. (Wang et al., 2019) present a work
where they feed the embedded program submission
sequence (as an AST: Abstract Syntax Tree) into a re-
current neural network and train it to predict the stu-
dent’s future performance. This method focuses on a
student’s sequence of submissions within a single pro-
gramming exercise to predict future achievement. By
training on these tasks, the model learns nuanced rep-
resentations of a student’s knowledge, exposes pat-
terns about a student’s learning behavior, and reliably
predicts future performance.
In his paper, Blikstein (Blikstein, 2011) describes
an automated technique to assess, analyze, and visu-
alize students learning computer programming. He
employs different quantitative techniques to extract
students’ behaviors and categorize them in terms of
programming experience.
The review of these studies highlights two criti-
cal points. First, in most studies, students’ program-
ming behaviors have been measured in a single ac-
tivity (i.e., at the level of one exercise, one course)
without flushing out possibly essential relations with
other analysis levels. Second, recent studies mainly
use supervised algorithms to predict students’ perfor-
mance, which requires a pre-processed and annotated
dataset. Unfortunately, annotating a dataset is a rather
tedious process that can be the source of errors. This
algorithm tends to work better when more and more
data are provided, whereas, in Learning Analytics, the
number of learners in a course is an actual limitation.
This paper aims to identify the different students’
programming behavior and the possible interactions
between these behaviors while finding out the rela-
tionships with students’ performance. Using cluster-
ing, we have tried to identify which students are alike
and potentially categorize them therein. After that,
and using those categories, we have used process min-
ing techniques to look for the significant events in the
process of solving exercises in programming for first-
year students.
3 DESIGN OF THE STUDY
In this section, information about the design of the
study is provided. We introduce the instrument used
to identify learners’ behaviors and the selected fea-
tures used.
3.1 Context
The study involves 61 first-year students of an intro-
ductory C++ programming university course. Stu-
dents did not have prior programming knowledge, but
they mastered basic operations to use a computer sys-
tem. The course includes theoretical sessions and one
hands-on session of 2 hours per week. In addition
to these hands-on sessions, students were suggested
to use an automatic assessment tool called Algo+
for solving some programming exercises in hands-on
sessions with an interval of two weeks. This time-
interval aims to obtain a significant evolution of stu-
dents’ behavior. Algo+ lets students write and run
their code and returns immediate feedback as an au-
tomatic grade assessing students’ programs based on
unit tests Algo+. Seventeen exercises were avail-
able through Algo+ to address different concepts of
programming taught during the theoretical sessions.
These exercises were defined and described in terms
of the relevant competencies of the course. Students
had the opportunity to browse the set of exercises and
engage in all, some, or none of the exercises. In other
Analyzing Student Programming Paths using Clustering and Process Mining
77
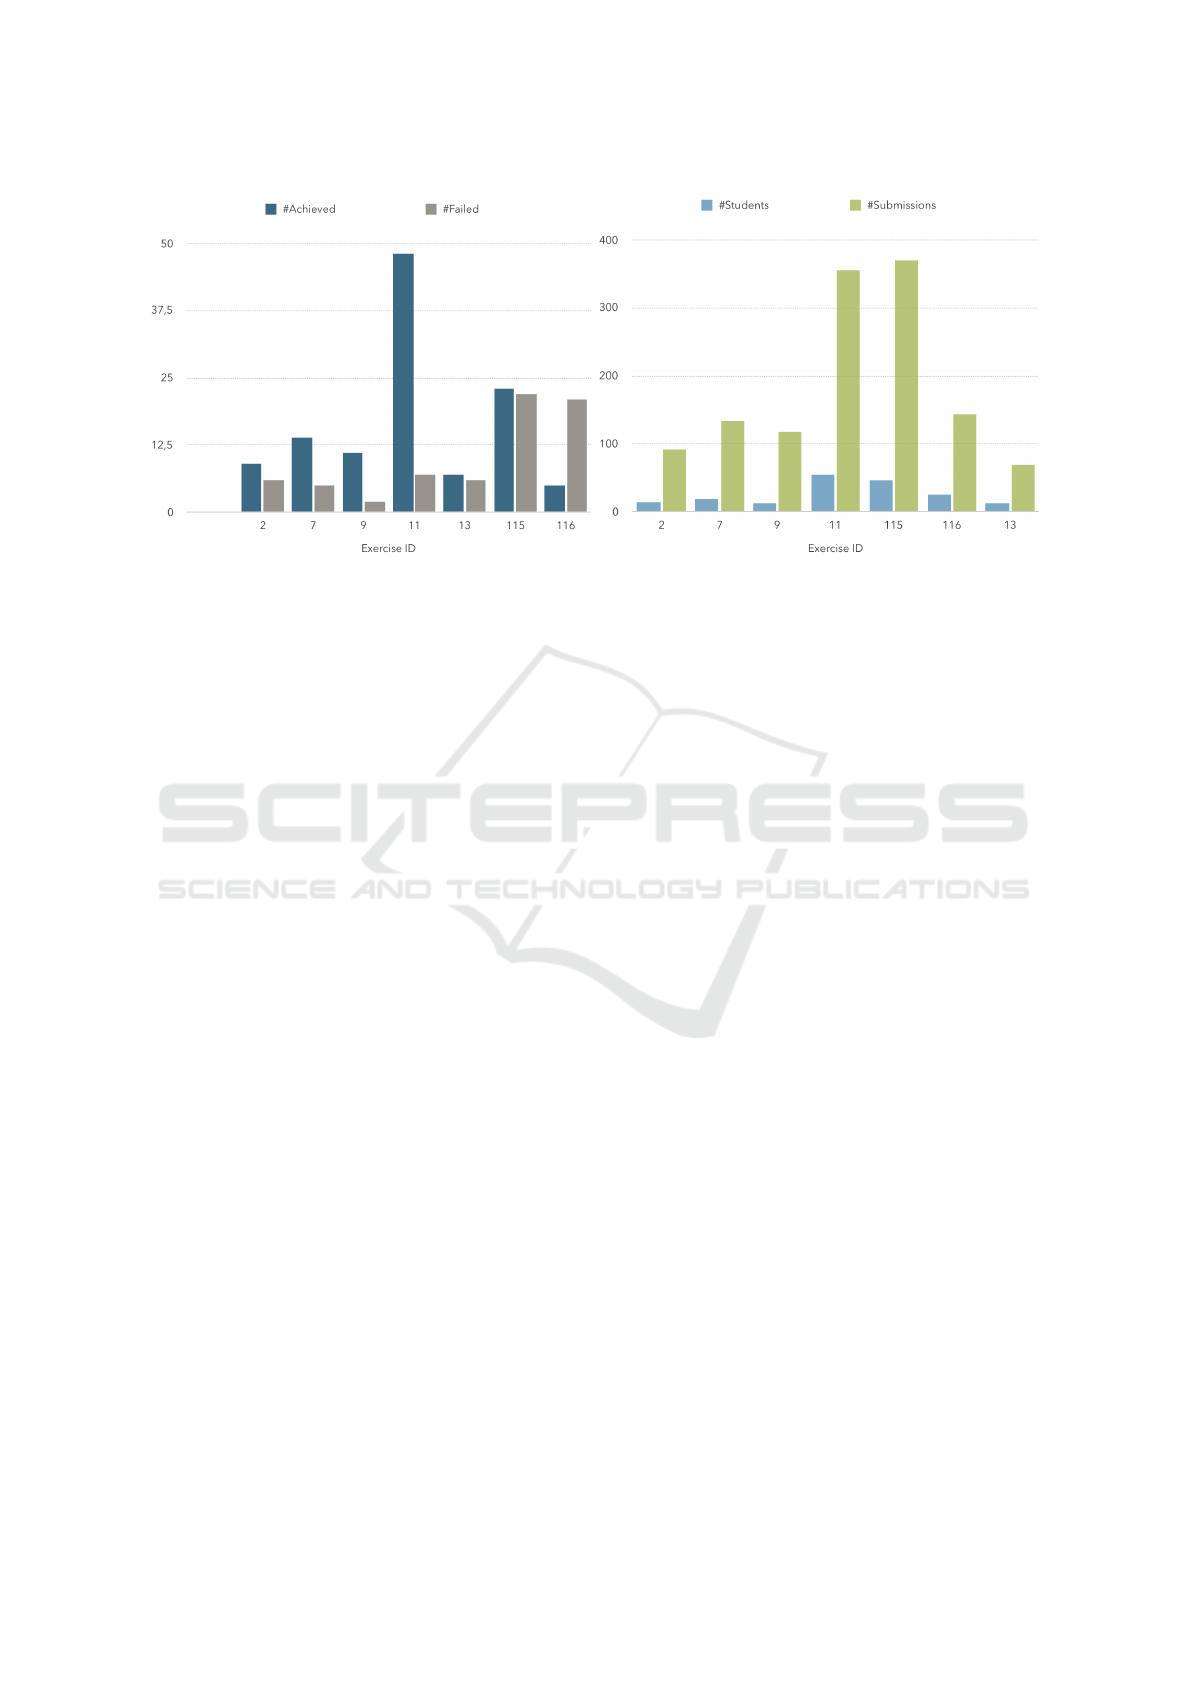
(a) Number of achievements/failures (b) Number of students and submissions
Figure 1: Data distribution per exercise.
words, exercises deployed in Algo+ were not manda-
tory; they were available to students for additional
training material. At the end of the course, students
were delivered a practical exam to evaluate their skills
in C++ programming. Teachers evaluated each exam
manually and assigned a score on a scale between 0
and 20, where 0 is the lowest mark and 20 the maxi-
mum.
3.2 Data Collection and Selected
Features
Data collection was ensured by Algo+. Each time
a student submits a source code, the following data
are collected: (1) the source code of the submission
and, if any, (2) the compiler errors; (3) the submis-
sion score computed by Algo+; and (4) the timestamp
of the submission. Among the 17 exercises, seven of
them were solved by 61 students. In total, 1282 sub-
missions have been produced by the students. Fig-
ure 1 shows the data distribution for these seven exer-
cises.
Starting from the raw data collected by Algo+, we
computed the following indicators:
• Number of submissions: number of submissions
produced by each student.
• Progress: percentage of submissions that passed
at least one unit test.
• Syntactic: percentage of submissions that failed
to compile.
• Error: percentage of submissions that failed all
unit tests.
• Avg. code modification: the average number of
tokens (i.e., words) changed between two submis-
sions.
• Avg. time spent: the average time (in seconds)
elapsed between two submissions.
Also, we used the students’ final course score to
investigate how the behavioral interactions are related
to students’ success. This final course score was used
as a dependent variable. Our goal is to explain stu-
dents’ behaviors from her/his activity and the rela-
tion with the final course score. The normality of the
scores was verified with the Shapiro-Wilk test, and
we categorized students into two groups according to
their score: At-Risk (score < 10) and Good (score ≥
10).
Also, we used another variable provided by Algo+
that represents the achievement of the exercise. An
exercise is considered as achieved/failed if a student
has proposed a solution that has passed all/not all unit
tests.
4 RESULTS
In this section, we will present the results obtained
during the analysis of the collected data. We tried to
analyze students’ behaviors in each exercise. We used
k-means with features described in Section 3.2 com-
puted in each exercise. Six groups of profiles have
been identified. The characteristics of each cluster are
described in Table 1.
ANOVA tests were conducted to validate the clus-
tering results using the clusters as the independent
variable and the features as the dependent variables.
Results of these tests are reported as follows :
CSEDU 2022 - 14th International Conference on Computer Supported Education
78
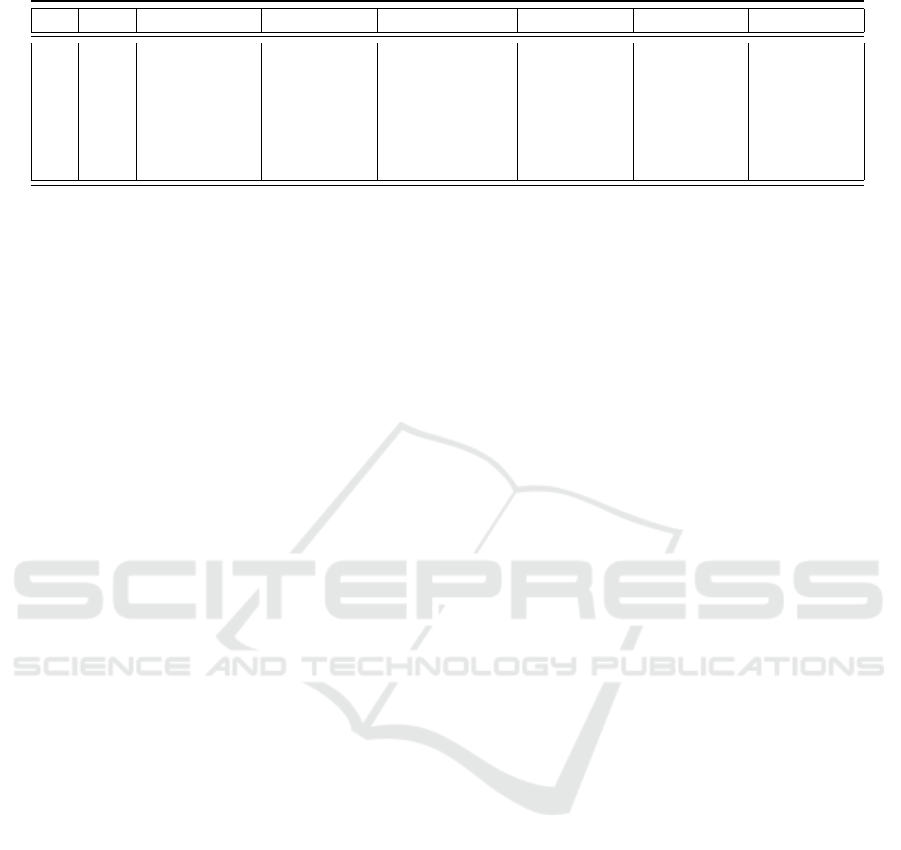
Table 1: Mean and standard deviation of each feature (clusters of level2).
ID Size #Submission %Progress %Compilation %Error Avg.Code Avg.Time
C1 19 4.3 ± 3.9 32.2 ± 24.0 8.1 ± 13.1 4.9 ± 9.0 3.3 ± 4.9 1.4 ± 1.6
C2 9 4.5 ± 1.7 0.0 ± 0.0 26.5 ± 14.2 51.4 ± 5.3 47.9 ± 21.1 15.3 ±24.4
C3 57 7.7 ± 6.1 1.6 ± 4.9 88.0 ± 11.9 3.0 ± 5.4 3.1 ± 4.3 1.3 ± 1.2
C4 23 4.6 ± 3.1 10.5 ± 14.7 6.3 ± 10.0 45.3 ± 6.0 9.3 ± 8.1 2.9 ± 4.7
C5 26 5.8 ± 9.8 0.7 ± 2.5 4.3 ± 8.6 85.6 ± 15.2 3.7 ± 5.7 1.2 ± 2.3
C6 52 8.8 ± 6.3 4.2 ± 8.4 49.9 ± 12.4 30.1 ± 12.6 8.1 ± 6.7 2.0 ± 2.1
• Significant difference on the number of submis-
sions (F[5, 180] = 2.83, p = .01): post-hoc pair-
wise comparisons show that Cluster6 has a high
number of submissions than Cluster1 and Clus-
ter4.
• Significant difference in the percentage of submis-
sions that passed some of the unit test (progress)
(F[5, 180] = 28.12, p < .001): post-hoc pairwise
comparisons show that Cluster 1 has a high per-
centage of submissions in progress than all clus-
ters. Thus Cluster 4 has a significant high percent-
age of submissions in progress than Cluster 5.
• Significant difference in the percentage of syntac-
tical errors (F[5,180] = 309.5, p < .001): post-
hoc pairwise comparisons show that Cluster3 has
the highest percentage of syntactical errors. Clus-
ter6 has a high percentage of syntactical errors
than Clusters 1,2,4 and 5 while Cluster 2 has a
high percentage of syntactical errors than Cluster
4 and 5.
• Significant difference on the percentage of erro-
neous submissions (F[5, 180] = 285.7, p < .001):
post-hoc pairwise comparisons show that Cluster
5 has the highest percentage of erroneous submis-
sions than all clusters. Cluster 2 has a signif-
icant high percentage of erroneous submissions
than Cluster 1,3,4, and 6. Also, Cluster 4 has a
high percentage than Clusters 1, 3 and 6.
• Significant difference in the average number of
changes between two submissions (F[5, 180] =
61.7, p < .001): post-hoc pairwise comparisons
show clearly that Cluster 2 makes important
changes than the rest of the clusters. Cluster 4 and
Cluster 6 make more code changes than Cluster 3.
• Significant difference on the average time spent
between two submissions (F[5, 180] = 10.21, p <
.001): post-hoc pairwise comparisons show that
Cluster2 has a significant average spent time more
than all clusters.
Using the cluster characteristics in Table 1, we de-
scribe each learner profile as follows.
Cluster1 represents students who are good at de-
signing the global solution, but they commit syntac-
tical errors due to their haste to get the assessment
result.
Cluster 2 represents students who move from one
solution to another and change the code profoundly
after each submission.
Cluster3 represents students who have difficulties
compiling their code.
Cluster4 represents good students; they take time
to conceive a solution.
Cluster5 represents students having difficulties de-
signing solutions; they do not spend enough time on
program design.
Cluster6 represents students who submit many
submissions to get feedback and improve the submit-
ted code; they learn from their mistakes.
4.0.1 Validation using Achievement/Failure per
Exercise
A second validation of these 6 clusters is examining
the relationship between achievement/failure. A chi-
square test of independence was performed to exam-
ine the exercise and the six clusters.
The relation between these variables was signifi-
cant, χ
2
(5, N = 209) = 39.93, p < .001. The 6 clus-
ters are associated with the success/failure of exer-
cises. Besides, we want to validate the 6 clusters ac-
cording to the final exam score. To achieve this objec-
tive, we need a student overview of adopted behaviors
during programming activities. The next section in-
troduces this representation and presents the analysis.
4.0.2 Validation with the Course Final Score
To obtain an overview of students’ behavior in all ex-
ercises in terms of the six identified behaviors, we rep-
resented students as 6-dimensional vectors to specify
each cluster’s percentage. In other words, we build
a global representation of students in terms of the
six clusters (see 1) obtained from the analysis. The
six values of each student represent the percentage of
how much the student has adopted each behavior.
First, the correlational relationship between clus-
ters and the final course score has been investigated.
Analyzing Student Programming Paths using Clustering and Process Mining
79
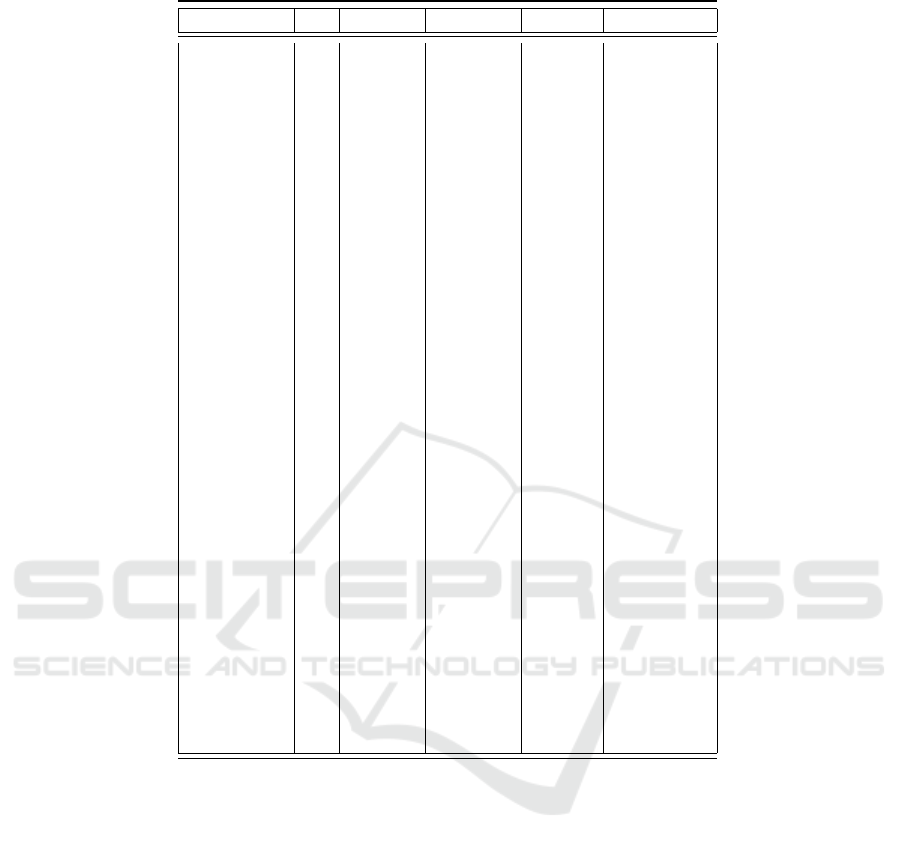
Table 2: ANCOVA analysis of effect of each cluster on students’ academic achievement.
Df Sum Sq Mean Sq F value Pr(> F)
c1 1 75.20 75.20 11.198 0.00221 **
c2 1 7.85 7.85 1.169 0.28821
c3 1 16.08 16.08 2.395 0.13224
c4 1 0.04 0.04 0.005 0.94162
c5 1 21.88 21.88 3.258 0.08113 .
c1:c2 1 6.90 6.90 1.028 0.31870
c1:c3 1 2.23 2.23 0.332 0.56906
c2:c3 1 17.52 17.52 2.609 0.11673
c1:c4 1 0.41 0.41 0.061 0.80590
c2:c4 1 0.01 0.01 0.001 0.97163
c3:c4 1 4.14 4.14 0.616 0.43877
c1:c5 1 10.02 10.02 1.492 0.23136
c2:c5 1 0.11 0.11 0.016 0.90008
c3:c5 1 29.82 29.82 4.441 0.04355 *
c4:c5 1 17.01 17.01 2.534 0.12193
c1:c6 1 2.14 2.14 0.318 0.57690
c2:c6 1 53.54 53.54 7.974 0.00835 **
c3:c6 1 8.05 8.05 1.198 0.28237
c4:c6 1 13.11 13.11 1.953 0.17253
c5:c6 1 8.50 8.50 1.265 0.26955
c1:c3:c4 1 9.65 9.65 1.437 0.23994
c1:c3:c5 1 83.49 83.49 12.433 0.00138 **
c1:c4:c5 1 0.02 0.02 0.003 0.95437
c3:c4:c5 1 0.35 0.35 0.052 0.82193
c1:c3:c6 1 1.11 1.11 0.166 0.68665
c3:c4:c6 1 11.70 11.70 1.742 0.19685
c1:c5:c6 1 9.36 9.36 1.394 0.24696
c3:c5:c6 1 0.43 0.43 0.065 0.80118
c4:c5:c6 1 16.26 16.26 2.422 0.13014
c1:c3:c5:c6 1 2.19 2.19 0.326 0.57249
Residuals 30 201.46 6.72
Signif. codes: ‘***’ 0.001 ‘**’ 0.01 ‘*’ 0.05 ‘.’ 0.1
We found that only Cluster1 has a significant posi-
tive correlation with the final course score while Clus-
ter3 has an almost significant negative correlation
(0.34, p < 0.05).
To investigate more about the relationship be-
tween the other behaviors and the final course score,
an Analysis of covariance (ANCOVA) was used. AN-
COVA is a statistical technique we can use when we
want to focus on the effects of the main response vari-
able on other variables’ effects. The ANCOVA design
is quite similar to the ANOVA design but includes
one or more variables as explanatory variables. It
was assumed that the regression coefficients between
groups were homogeneous (Keppel, 1998). This test
is conducted using the final course score as the depen-
dent variable, and the 6-dimensional vector will be the
student’s attitude in the analysis of covariance (AN-
COVA). This test shows a significant effect of the six
clusters on the final course score, F(2, 30) = 2.30, p =
.02. The ANCOVA analysis results in Table 2 show
that only Cluster1 behavior has the significant main
effect, F(1, 61) = 11.19, p < 0.05, which means that
students who adopt the behavior of cluster1 have high
final exam scores. On the contrary, students who do
not adopt this behavior have low final exam scores.
According to this cluster’s characteristics, stu-
dents adopting this behavior are good at designing the
solution for a given problem. They have a remarkable
progress rate, joining previous research findings on
analyzing programming activities (Lisa Wang, 2017;
Bey A., 2019).
However, we found three highly significant inter-
actions effects between behaviors. 2 illustrates these
interactions. For ease of comparison, we have cate-
gorized the continuous values of the six variables that
express behaviors into two categories: Low (value <
CSEDU 2022 - 14th International Conference on Computer Supported Education
80

5
10
15
high low
cluster6
final_score
cluster2
high
low
(a) Cluster2/Cluster6
5
10
15
high low
cluster5
final_score
cluster3
high
low
(b) Cluster3/Cluster5
(c) Cluster1/Cluster5 (d) Cluster1/Cluster5
Figure 2: Significant interactions of clusters that affects students’ academic achievement score.
50%) and High (value ≥ 50%).
The significant interaction between Cluster3 and
Cluster5 (F(1, 61) = 4.44, p = .04) indicates that the
relationship between Cluster3 and the final score de-
pends on the Cluster5. Figure 1(b) shows that when
Cluster5 is high, there is no effect of Cluster 3 on the
final score. According to the characteristic of clus-
ters, when a student has problems designing solutions
(Cluster5), whether they have syntactic problems or
not, this negatively affects the final score. However,
when Cluster5 is low, there is a negative relationship
between Cluster3 and the final score.
The second significant interaction is between
Cluster2 and Cluster6 (F(1, 61) = 7.97, p = .008). As
shown in Figure 1(a), there is a positive relationship
between Cluster2 and the final score when Cluster6 is
high. However, when Cluster6 is low, there is no ef-
fect of Cluster2 on the final score, and it depends on
Cluster6. According to these clusters’ characteristics,
students who make large changes in their code before
submitting (Cluster2) obtain a high score when they
frequently submit (Cluster6).
Finally, the last significant interaction is be-
tween three clusters: Cluster1, 3 and 5 (F(1, 61) =
12.43, p = .001). That indicates that the impact that
Cluster1 has on academic achievement depends on
Cluster3 and Cluster 5 and reciprocally. When Clus-
ter 3 is high, the score generally depends on Cluster1
and Cluster5. Figure1c shows that the final score is
high when Cluster1 is high and Cluster5 is low. Ac-
cording to these clusters’ characteristics, these can be
explained by the fact that students who take time to
conceive a solution (Cluster1) have a negative relation
with students who have difficulties designing the right
solution (Cluster5) in terms of achievement. How-
ever, when Cluster3 is low (Figure 1(d)), we can ob-
serve little interactions between Cluster1 and 5, which
means that when students have not serious problems
in compiling codes (characteristics of Cluster3), the
success of students depends mainly on the fact that
students are good or not in designing solutions.
5 MINING THE TRAJECTORY
PATTERNS OF HIGH AND LOW
PERFORMING STUDENTS
Different methods have been used to investigate the
navigation patterns of learners. In our case, we use
process mining techniques to inspect trajectory pat-
terns of high and low-performing students. Process
mining provides a set of algorithms, tools, and tech-
niques to analyze event data (van der Aalst, 2011).
Among the main perspectives offered by this domain
is discovery. Discovery techniques allow the interpre-
tation of process models from log data.
Process discovery entails learning a process model
from the event log. An event log was built from the
clusters obtained in the second phase of analysis (see
Analyzing Student Programming Paths using Clustering and Process Mining
81
(a) At-Risk Students (b) Good Students
Figure 3: Process models for each of good and at-risk students (100% activities, 0% paths detail-only most important flows
are shown). There are 6 activities corresponding to the six behaviors. The coloring indicates the frequency of the behavior.
Table 3: The created event log used by the process mining.
Student.ID Activity(Clusters) Categories
1 Cluster1 at-risk
1 Cluster2 at-risk
1 Cluster2 at-risk
1 Cluster2 at-risk
2 Cluster3 good
2 Cluster3 good
2 Cluster3 good
... ... ...
... ... ...
3).
We built this event log using the clustering results.
As we can notice, we did not use any timestamp be-
cause this section aims to find out behavioral changes
of at-risk and good students. This event log is used
as an input to process mining algorithms to visualize
and enact students’ actual behavioral trajectory (se-
quential behavioral changes) (3).
The following difference can be detected when
comparing the process flows for these two groups of
students. The good students start most of the time
as good at designing the global solution. They also
commit some syntactic errors due to their haste to get
the assessment result (characteristics of Cluster1) and
because they are not used to the programming lan-
guage’s syntax. Their transitions from one behavior
to another are often toward Clusters 3, which is char-
acterized by the difficulties of compiling codes. Also,
a loop between Cluster1 and Cluster3 was identified.
However, low-performing students generally start
as trial-and-error; they submit many submissions to
get feedback (Cluster6). A self-loop on Cluster3 was
identified, which means that most low-performer stu-
dents struggle to compile codes. Also, we can see
a noteworthy loop between Cluster3 and Cluster6.
Cluster5, which represents students with difficulties
in designing solutions, is also adopted by this cate-
gory of students who generally have difficulties com-
piling their codes (Cluster3).
These models confirm some results discussed in
the ANCOVA analysis and explain how high and low-
performer students change their behaviors.
For example, in high performer students (3b),
Cluster1 is the first adopted behavior, which means
(according to the characteristics of Cluster1, see Sec-
tion 4) that the right attitude of students to take the
time to design the solution before submitting is a crit-
ical aspect to achieve successfulness. After being in
Cluster1, high-performer students could adopt the be-
havior of Clusters 3 and 6 most of the time. This could
be explained by the fact that after designing the com-
plete solution at the beginning (Cluster1), those stu-
dents may have some syntactical errors that they tried
to correct by compiling many times to get feedback
about the syntactical errors.
However, low-performer students (or at-risk stu-
dents in the 3a) start by belonging into Cluster6 and
CSEDU 2022 - 14th International Conference on Computer Supported Education
82

stay in CLuster3. This means that students who write
a few codes and start by compiling to see the output
and get feedback do not perform better according to
the course final score.
6 CONCLUSION AND FUTURE
WORKS
In this study, we attempted to discover the many be-
haviors that a beginner learner might exhibit when
solving programming problems and how such behav-
iors might affect a student’s performance. Clustering
was used in an educational data mining technique to
identify students’ different groups based on their var-
ious programming behaviors.
We could elicit more complicated actions by using
an exercise to seek out students’ behaviors. We were
able to determine which behaviors and types of con-
nections between behaviors contribute to success or
failure in a programming course, thanks to them. In
other words, we can identify high and low-performing
children by observing their behaviors and determining
what is wrong with them so that appropriate aid can
be provided.
The findings of this study are not about the actions
themselves but rather how they can represent stu-
dents’ behavioral overviews and use this representa-
tion to predict success by identifying students’ short-
comings and strengths. However, we must acknowl-
edge that the current dataset is still insufficient, and
we must confirm our research with a larger dataset.
REFERENCES
Bergin, S. and Reilly, R. (2005). Programming: Factors
that influence success. In Proceedings of the 36th
SIGCSE Technical Symposium on Computer Science
Education, SIGCSE ’05, page 411–415, New York,
NY, USA. Association for Computing Machinery.
Bergin, S. and Reilly, R. (2006). Predicting introduc-
tory programming performance: A multi-institutional
multivariate study. Computer Science Education,
16(4):303–323.
Bey A., P
´
erez-Sanagust
´
ın M., B. J. (2019). Unsupervised
automatic detection of learners’ programming behav-
ior. In Transforming Learning with Meaningful Tech-
nologies. EC-TEL 2019, Lecture Notes in Computer
Science, vol 11722. Springer, Cham.
Blikstein, P. (2011). Using learning analytics to assess stu-
dents’ behavior in open-ended programming tasks. In
Proceedings of the 1st International Conference on
Learning Analytics and Knowledge, LAK ’11, page
110–116, New York, NY, USA. Association for Com-
puting Machinery.
Boroujeni, M. S. and Dillenbourg, P. (2018). Discovery and
temporal analysis of latent study patterns in mooc in-
teraction sequences. LAK ’18, page 206–215, New
York, NY, USA. Association for Computing Machin-
ery.
Carter, A. S., Hundhausen, C. D., and Adesope, O. (2015).
The normalized programming state model: Predict-
ing student performance in computing courses based
on programming behavior. In Proceedings of the
Eleventh Annual International Conference on Inter-
national Computing Education Research, ICER ’15,
page 141–150, New York, NY, USA. Association for
Computing Machinery.
Jiang Zhuoxuan, Z. Y. and Xiaoming, L. (2015). Learning
behavior anal- ysis and prediction based on mooc data.
Journal of computer research and development, 52(3).
Keppel, G., . W. T. D. (1998). Design and analysis: A re-
searcher’s handbook (4th ed.). Upper Saddle River,
NJ: Prentice Hall, 4th edition.
Koprinska, I., Stretton, J., and Yacef, K. (2015). Predicting
student performance from multiple data sources. In
Conati, C., Heffernan, N., Mitrovic, A., and Verdejo,
M. F., editors, Artificial Intelligence in Education,
pages 678–681, Cham. Springer International Pub-
lishing.
Lisa Wang, Angela Sy, L. L. C. P. (2017). Learning to rep-
resent student knowledge on programming exercises
using deep learning. In Proceedings of the 10th In-
ternational Conference on Educational Data Mining,
EDM 2017.
Luxton-Reilly, A., Simon, Albluwi, I., Becker, B. A., Gian-
nakos, M., Kumar, A. N., Ott, L., Paterson, J., Scott,
M. J., Sheard, J., and Szabo, C. (2018). Introductory
programming: A systematic literature review. In Pro-
ceedings Companion of the 23rd Annual ACM Con-
ference on Innovation and Technology in Computer
Science Education, ITiCSE 2018 Companion, page
55–106, New York, NY, USA. Association for Com-
puting Machinery.
McHugh, F. P. D. . J. A. (1998). A survey and critical analy-
sis of tools for learning programming. Computer Sci-
ence Education, 8(2).
Sharma, K., J. P. D. P. (2015). Identifying styles and paths
toward success in moocs. In Proceedings of the 8th
International Educational Data Mining. IEDMS.
Sharma K., Mangaroska K., T. H. L.-C. S. G. M.
(2018). Evidence for programming strategies in uni-
versity coding exercises. In In Proceeding Lifelong
Technology-Enhanced Learning. EC-TEL 2018, EC-
TEL 2018. Springer.
Soloway, E., Bonar, J., and Ehrlich, K. (1983). Cognitive
strategies and looping constructs: An empirical study.
Commun. ACM, 26(11):853–860.
Spacco, J., Denny, P., Richards, B., Babcock, D., Hove-
meyer, D., Moscola, J., and Duvall, R. (2015). Ana-
lyzing student work patterns using programming exer-
cise data. In Proceedings of the 46th ACM Technical
Symposium on Computer Science Education, SIGCSE
’15, page 18–23, New York, NY, USA. Association
for Computing Machinery.
Analyzing Student Programming Paths using Clustering and Process Mining
83

van der Aalst, W. M. P. (2011). Process Mining: Discov-
ery, Conformance and Enhancement of Business Pro-
cesses. Springer Publishing Company, Incorporated,
1st edition.
Wang, Y., Law, N., Hemberg, E., and O’Reilly, U.-M.
(2019). Using detailed access trajectories for learn-
ing behavior analysis. In Proceedings of the 9th Inter-
national Conference on Learning Analytics & Knowl-
edge, LAK19, page 290–299, New York, NY, USA.
Association for Computing Machinery.
CSEDU 2022 - 14th International Conference on Computer Supported Education
84
