
Classification Techniques Use to Empirically Validate Redundancy
Metrics as Reliability Indicators based on Fault-proneness Attribute
Dalila Amara
a
and Latifa Ben Arfa Rabai
b
Universit
´
e de Tunis, Institut Sup
´
erieur de Gestion de Tunis, SMART Lab, Tunis, Tunisia
Keywords:
Software Reliability, Software Redundancy Metrics, Software Metrics Validation, Fault-proneness.
Abstract:
Software metrics are proposed as quantitative measures of internal quality factors like cohesion and complex-
ity. For the external ones such as reliability and maintainability, they are usually predicted by means of various
metrics of internal attributes. In this context, we have focused on a suite of four entropy-based software redun-
dancy metrics considered as software reliability indicators. Despite their important purpose, they are manually
computed and only theoretically validated. Hence, we have implemented an empirical approach for assessing
these metrics, using a set of programs retrieved from real software projects. Given that software reliability
as external attribute, cannot be directly evaluated, we employ other measurable quality factors representing
direct reflections of this attribute. Among them, defect density and fault-proneness are widely used as means
to measure and predict software reliability based on software metrics. The basic idea is to generate an empiri-
cal dataset embodying for each program, the values of the redundancy metrics and the values of one of these
measurable attributes. In our previous work, we have studied their relationship with the defect density attribute
in order to validate them as useful reliability indicators. Promising results indicating the usefulness of these
metrics as defect density indicators are obtained. Classifying modules (functions or classes) as defective or not
defective is also an important reliability indicator. Literature review shows that software reliability counts on
its fault-prone modules and more trusted software consists of less fault-prone units. Therefore, we aim in this
paper to propose an empirical approach to validate the redundancy metrics as significant reliability indicators.
The validation is carried out using the accuracy measure and results show that the fault proneness attribute can
be predicted using the redundancy metrics with a good accuracy rate of 0.82.
1 INTRODUCTION
One common way to verify and validate software
quality is software testing which consists on identi-
fying software faults (Lyu et al., 1996). This process
takes too much time and requires a large amount of
resources (Gondra, 2008). Therefore, methodologies
of predicting software quality prior the testing phase
are required to increase the efficiency of time, effort
and cost usage. Software quality prediction requires
the development of a measurement plan providing
the needed data on software factors (Arvanitou et al.,
2017). Software quality measurement consists on
assigning numbers or symbols to software factors to
evaluate their performance using software metrics
(Nakai et al., 2016; Fenton and Bieman, 2014).
These metrics provide quantitative values of different
software factors related to the process and product
a
https://orcid.org/0000-0001-9938-2384
b
https://orcid.org/0000-0002-5657-4682
entities. In addition, they are used to develop quality
prediction models (Reddivari and Raman, 2019).
Most of software metrics were defined to evaluate
internal quality attributes including coupling and
complexity (Chidamber and Kemerer, 1994). For
external attributes like reliability and maintainabil-
ity, their measurement was usually determined by
combining different metrics measuring internal char-
acteristics (Briand and W
¨
ust, 2002; Jabangwe et al.,
2015). According to (Fenton and Bieman, 2014),
external attributes are more difficult to understand
than internal ones since they depend on the program
behaviour and they are available at later phases
of the development process. Thus, further studies
focusing on the prediction of these attributes still
required. Authors in (Mili et al., 2014) proposed a
suite of metrics to monitor software reliability by
evaluating the code redundancy based on Shannon
entropy measure. The main limitation of this suite is
the lack of an empirical validation showing its utility
Amara, D. and Rabai, L.
Classification Techniques Use to Empirically Validate Redundancy Metrics as Reliability Indicators based on Fault-proneness Attribute.
DOI: 10.5220/0011081900003176
In Proceedings of the 17th International Conference on Evaluation of Novel Approaches to Software Engineering (ENASE 2022), pages 209-220
ISBN: 978-989-758-568-5; ISSN: 2184-4895
Copyright
c
2022 by SCITEPRESS – Science and Technology Publications, Lda. All rights reserved
209

as reliability indicator. As software reliability is an
external attribute that cannot be directly evaluated,
we have focused on measurable attributes that reflect
it to address this issue. In our previous work (Amara
et al., 2021), we have studied the relationship be-
tween the redundancy metrics and the defect density
attribute in order to validate them as useful reliability
indicators. Promising results indicating the useful-
ness of these metrics as defect density indicators
are obtained. Fault-proneness was also identified
as an important reliability indicator (Gondra, 2008;
Singh et al., 2018). Authors in (Verma and Kumar,
2017) noted that software reliability counts on its
fault-prone modules; more trusted software consists
of less faultprone units. Thus, it will be possible
to monitor software reliability by predicting the
number of faultprone modules based on software
metrics (Gyimothy et al., 2005; Olague et al., 2007;
Jabangwe et al., 2015).
Therefore, we aim in this paper to use the fault-
proneness attribute to answer this question: Are
redundancy metrics useful for software reliability
prediction? To perform the empirical assessment
and validation of the redundancy metrics, the data
collection phase is required. For that step, Apache
Common Mathematics Library was deployed in this
research. Given its availability, two main elements of
data are obtained:
• Different classes satisfying the redundancy met-
rics’ assumption (Metrics are computed at
method-level. These methods manipulate input
and output variables. This means programs with
input states represented by the declared variables
and output states represented by the modified
states of these variables (Mili et al., 2014)) are se-
lected to compute them in order to construct an
empirical data set containing the values of these
metrics.
• The bug information of the selected classes
needed to compute the values of the fault-
proneness attribute was unavailable. Therefore, a
fault injection procedure was used to obtain them
and to perform the empirical validation of the re-
dundancy metrics. Thus, in this study, the dataset
we used to perform our validation and to train and
evaluate the classification models contains the val-
ues of the redundancy metrics for each function
and the related fault-proneness (0 or 1) attribute.
Different experiments based on classification tech-
niques are conducted to address these issues. The val-
idation is carried out using the accuracy measure and
results confirm the predictive capability of the redun-
dancy metrics for software fault prediction.
The paper is organized as follows: Section 2 sum-
marizes the purpose of the redundancy metrics and
provides an overview of software fault-proneness pre-
diction. Section 3 presents the empirical validation
approach, the data set collection and analysis proce-
dures. Section 4 describes the performed experiments
and results. Section 5 presents the discussion and
threats to validity. Finally, Section 6 includes the con-
clusion.
2 RELATED WORKS
In this section, we present the purpose of the redun-
dancy metrics. We also provide an overview of soft-
ware fault prediction using software metrics.
2.1 Software Reliability
Software reliability is an important software qual-
ity attribute defined as the probability of failure-free
operation for a specified period of time in a speci-
fied environment. It can be described by other sub-
characteristics like maturity, availability, fault toler-
ance and recoverability (Febrero et al., 2016; Amara
and Rabai, 2017). For (Bansiya and Davis, 2002), it
is one of high-level quality attributes that cannot be
directly observed and measured.
Different models based on direct metrics were
proposed to predict it (Catal and Diri, 2009; Radjen-
ovi
´
c et al., 2013). These models used software met-
rics (called independent variables) to evaluate mea-
surable reliability attributes (called dependent vari-
able) like defect density, fault-proneness and defect
count (Briand and W
¨
ust, 2002). Authors in (Mili
et al., 2014) also proposed a suite of four metrics
to monitor programs reliability based on their redun-
dancy. Different forms of software redundancy were
defined including information redundancy (code re-
dundancy) (Shannon, 2001), functional redundancy
(Asghari et al., 2018) and time redundancy (Dubrova,
2013). The redundancy metrics proposed by (Mili
et al., 2014) assess the information redundancy pro-
vided by the different states of the program (Shannon,
2001). These states reflect the uncertainty about the
outcome of the program’ variables. The terminology
related to program states includes (Mili et al., 2014):
• Software program state: is the set of values given
by its variables which may change by one or more
actions (functions) of the program.
• State space: is the set of values taken by the de-
clared program variables.
ENASE 2022 - 17th International Conference on Evaluation of Novel Approaches to Software Engineering
210

• Initial state space: is the state of the program rep-
resented by its input variables.
• Current state (actual state): represents the differ-
ent states that the program may be in at any given
point in the program.
• Final state space: represents the state of the pro-
gram that is produced by its outputs for the rele-
vant initial states.
• State redundancy: the extra range of values al-
lowed by a program than it is needed to represent
the program states. The state redundancy is rep-
resented by the initial and final state redundancy
metrics defined above.
Example 1 illustrates these definitions.
Example 1: Let a program (method) g defined by:
int s; /∗ state space of g∗/
s=2; /∗ initial state of g ∗/
s=s+1; /∗ internal state 1 of g∗/
s=2∗s; /∗ internal state 2 of g∗/
s=ss=s+12; /∗ final state of g ∗/
2.2 Software Redundancy Metrics Suite
Redundancy metrics were defined based on Shannon
entropy measure of programs code (Shannon, 2001).
Four metrics were defined which are initial state re-
dundancy, final state redundancy, functional redun-
dancy and non-injectivity (Mili et al., 2014).
2.2.1 Initial and Final State Redundancy
Metrics
The state redundancy represents the gap between the
declared state and the actual state (really used) of a
program (Mili et al., 2014; Ayad et al., 2018). For in-
stance, the age of an employee is generally declared
as an integer variable type. However, only a restrict
range i.e between 0 and 120 is really required. This
means that 7 bits are sufficient to store the age vari-
able but the typical 32 bits size of an integer variable
is used. The unused bits measure the code redun-
dancy. The program moves from its initial states (σ
1
)
to its final states (σ
f
), then two state redundancy mea-
sures namely initial state redundancy (ISR) and final
state redundancy (FSR) were defined by:
ISR(g) =
H(S) − H(σ
1
)
H(S)
(1)
FSR(g) =
H(S) − H(σ
f
)
H(S)
(2)
Notation:
ISR is the gap between the declared state and the
initial state of the program.
FSR is the gap between the declared state and the
final state of the program
S is the program’ declared state represented by
its all declared variables.
H(S) is the state space of the program as the max-
imum entropy (bits) taken by its declared
variables.
σ
1
is the initial state of the program g, repre-
sented by its input variables.
H(σ
f
) is the state space (entropy) of the initial pro-
gram’ state.
σ
f
is the final state of the program given by its
output variables.
H(σ
f
) is the entropy of the final program’ state.
To compute the state redundancy (SR) metric (ISR
and FSR), each data type is mapped to its width in
bits. For instance, for Java language, the entropy of
variable declarations of basic data types is illustrated
in Table 1.
Table 1: Entropy for basic data type.
Data type Entropy
Boolean 1
Byte 8
Char, short 16
Int, float 32
Double, long 64
Example 2: Let a program (method) g defined by:
int x, y, z; // the program state is represented by x, y
and z variables
x= 21; // initial state of x
y= 90; // initial state of y
z=(x+y)/2; // final state
The declared space of this program is defined by
three integer variables; x, y and z, hence, using the
metrics definitions, H(S) = 96 bits since 3 integer vari-
ables are used. Its initial state is defined by three
variables; x, y and z. The input variables x and y
require respectively 5 and 7 bits to be stored. The
output variable z has a free range (32 bits). Hence
H(σ
1
) = 5+7+32= 44 bits. For the final state, is de-
termined by the state of the variable z (its entropy),
H(σ
f
) =H((21+90)/2)=6 bits, then: ISR= (96-44)/96
=0.54 FSR= (96-6)/96 =0.93
Classification Techniques Use to Empirically Validate Redundancy Metrics as Reliability Indicators based on Fault-proneness Attribute
211

2.2.2 Functional Redundancy Metric (FR)
According to (Mili et al., 2014; Ayad et al., 2018), the
functional redundancy metric is a function from initial
states to final states. It reflects how initial states are
mapped to final states. For a program (function) g, FR
is the ratio of the output data delivered by g prorated
to the input data received by g and given by:
FR =
H(Y )
H(X)
(3)
Notation
X is a random variable representing the pro-
gram’ input data.
Y is a random variable that represents the pro-
gram’ output data.
H(Y) is the entropy of the output data delivered by
g
H(X) is the entropy of input data passed through
parameters, global variables, read state-
ments, etc.
In Example 2, H(S) = 96 bits. The Random variable
Y is defined by the integer variable z represented
by 32 bits. Then, H(Y ) = log
2
(2
32
) = 32bits.
H(X) is the input data received by g and repre-
sented by the two integer variables x and y. Then,
H(X) = 2 ∗log
2
(2
32
) = 64bits. FR is given by :
FR =
32
64
= 0.5
2.2.3 Non-injectivity (NI)
According to (Catal and Diri, 2009), a major source of
program (function) redundancy is its non-injectivity.
An injective function is a function whose value
changes whenever its argument does. A function is
non-injective when it maps several distinct arguments
(initial states σ
1
) into the same image (final states σ
f
).
NI was defined by:
NI =
H(σ
1
|σ
f
)
H(σ
1
)
=
H(σ
1
) − H(σ
f
)
H(σ
1
)
(4)
In Example 2, NI is equal to (44-6)/44=0.86.
2.3 Overview of Software
Fault-proneness Prediction
Fault-proneness consists on classifying modules
(functions or classes) as defective or not defective
(Singh et al., 2018). For (Rathore and Kumar, 2017;
Kumar et al., 2017), software fault prediction (SFP)
consists on identifying faulty modules as software
parts containing faults. This attribute was usually esti-
mated and predicted using predictive models compro-
mised of software metrics (Gondra, 2008). The early
application of these models helps reducing the test-
ing effort (Singh et al., 2018) as the identified defect-
prone parts are tested with more rigor compared to
other ones. In addition, effective resource allocation
and reduction in cost and development time will be
obtained (Kalaivani and Beena, 2018).
Different software fault prediction models have
been studied since 1990. The development of these
models was performed using classification techniques
as fault-proneness attribute consists on classifying
modules (functions or classes) as defective or not
defective. These models play a crucial role in un-
derstanding, evaluating and improving the quality of
software systems. According to (Singh et al., 2018),
the early application of these models helps to reduce
the testing effort as testing activities will be planned.
Also, the parts of software system identified as defect-
prone will be tested with more rigor in comparison
to other system parts (Gondra, 2008). In the same
context, (Kalaivani and Beena, 2018) noted that the
early identification of faulty software parts provides
an effective resource allocation and reduces the cost
and time of software development. Numerous studies
were defined to predict this attribute based on soft-
ware metrics.
(Menzies et al., 2004) conducted an experiment
where different fault prediction models were con-
structed using CART, NB and J48 algorithms over dif-
ferent projects taken from PROMISE repository. Re-
sults showed that the performance provided by NB is
better than that is provided by J48.
(Olague et al., 2007) investigated six different ver-
sions of Mozilla Rhino project. The goal of the study
was to study the ability of C&K, QMOOD, MOOD
suites of metrics in predicting faulty modules. They
applied the Univariate and multivariate binary logistic
regression to the cited suites. The authors concluded
that C&K and QMOOD suites are very useful for fault
prediction by contrast to the MOOD.
(Zhou et al., 2010) examined C&K metrics suite
for a defect prediction models based on LR, NB, RF
algorithms. The data set under study consists on KC1
project taken from NASA data set. The objective was
to predict the severity of faults. Authors concluded
that the best fault prediction is achieved by most of
C&K metrics expected NOC.
(Catal and Diri, 2009) conducted a comparative
analysis to study the efficiency of RF and NB algo-
rithms in predicting fault-proneness modules. Au-
thors examined C&K metrics suite taken from NASA
data sets. Results showed that for large data sets, RF,
ENASE 2022 - 17th International Conference on Evaluation of Novel Approaches to Software Engineering
212

provides the best prediction, whereas, for small data
sets, NB provides best results.
(He et al., 2015) compared the performance of LR,
J48, NB, SVM, DT and BN algorithms in predicting
faulty classes. They examined 34 releases obtained
from 10 open source’ PROMISE projects. Authors
concluded that SVM and DT perform well in predict-
ing faulty classes.
(Kaur and Kaur, 2018) compared the performance
of Bagging, J48, DT, RF and NB classifiers. They
constructed different defect prediction models based
on C&K and QMOOD metrics. Authors concluded
that only Bagging and J48 are the best defect predic-
tors.
(Lomio et al., 2021) have also compared the per-
formance of Machine and Deep Learning models
models in predicting faults. They have conducted a
case study among 33 Java projects and results showed
that deep learning provide a more accurate fault detec-
tion accuracy.
2.4 Formulation of the Research
Hypothesis
The presented fault prediction studies highlighted the
usefulness and the effectiveness of classification tech-
niques in fault-proneness prediction. Thus, to validate
the redundancy metrics as reliability indicators using
fault-proneness attribute, we have designed the fol-
lowing hypotheses:
• H1 (Alternative Hypothesis): redundancy met-
rics are significant indicators of software fault-
proneness attribute.
• H2 (Null Hypothesis): there is no significant re-
lationship between the redundancy metrics and
fault-proneness attribute.
Through these hypothesis, we aim to verify if a re-
lationship between the different metrics and fault-
proneness attribute exists in order to confirm their
utility in monitoring software reliability.
3 EMPIRICAL VALIDATION OF
REDUNDANCY METRICS AS
FAULT-PRONENESS
INDICATORS
3.1 Empirical Validation Approach
According to (Rathore and Kumar, 2017; Kumar
et al., 2017), the fault prediction was conducted based
on three main steps:
1. Data set collection and exploration. This step con-
sists on collecting data related to software metrics
and faults.
2. Data set analysis and models building. This step
consists on performing the data set analysis, data
splitting into learn and test sets and models build-
ing.
3. Models performance evaluation. Numerous eval-
uation measures were defined to evaluate the over-
all performance of the prediction models.
3.2 Data Set Collection
The development of fault prediction models starts by
data set collection phase that requires two main el-
ements; software metrics and software faults. Data
related to these elements can include data from sim-
ilar software projects or existed software metrics and
historical fault data-sets of previous projects (Tura-
bieh et al., 2019). In this paper, the fault-proneness
attribute indicating whether a module is fault-free
(0) or fault-prone (1) will be considered to perform
our validation work. As explained in our previ-
ous work (Amara et al., 2021), as redundancy met-
rics are computed from the programs states manip-
ulated by its variables, software classes containing
functions of input/output types were selected. This
means programs (functions) with input states repre-
sented by the declared variables and output states
represented by modified states of these variables.
We have focused on Apache Commons Math library
(https://commons.apache.org/) (Kumar and Rathore,
2018) to selected different classes from which the
metrics were computed.
To select the needed repository, we have consid-
ered Apache Commons products library which re-
spects all our requirements and hypothesis. Then,
from the selected repository, we have considered
a set 43 classes (see (Amara et al., 2021)) con-
taining functions manipulating variables in the in-
put and the output state. A description of
each class and its related function is available
at http://commons.apache.org/proper/commonsmath/
javadocs/api-3.6/. As this library contains only the
source code and the associated unit tests, we have
used fault injection procedure to obtain the fault-
proneness values.
One of the well-known fault injection techniques
is mutation testing which consists on automatically
seeding into each class’ code a number of faults (or
mutations). The fault injection procedure is used to
obtain fault data set. This prevents us to compute
fault-proneness values at the class-level as all of the
classes contain faults. Therefore, we ought to com-
Classification Techniques Use to Empirically Validate Redundancy Metrics as Reliability Indicators based on Fault-proneness Attribute
213
pute this attribute at the function-level. The redun-
dancy metrics will be also computed at this level lead-
ing to increase the size of our data set. Details of
the redundancy metrics and fault-proneness comput-
ing are described in the subsequent sub-sections.
3.2.1 Redundancy Metrics Collection
We have computed the redundancy metrics at the
function-level of each class as all classes will contain
faults. The process we used to compute these metrics
consists of the following steps:
• For each class, we have considered each function
separately to generate the different metrics.
• For each function, we have focused on its input
and output variables. Then, we have computed the
metrics for random inputs using their equations
(1) to (4).
• The output of this process is an Excel file in which
the four redundancy metrics values of the different
functions of each class were saved.
These steps were performed using the Eclipse de-
velopment environment (version: Neon.3 Release
(4.6.3)). Details of metrics computing are available
in (Amara et al., 2021).
3.2.2 Fault Data Set Collection
Software fault-proneness attribute is a direct reflec-
tion of software reliability since as noted by (Karim-
ian and Babamir, 2017; Reddivari and Raman, 2019),
more trusted software consists of less fault-prone
units. Software fault prediction (SFP) consists on
classifying modules (functions or classes) as defec-
tive or not defective by identifying the faulty modules
as software parts containing faults (Singh et al., 2018;
Rathore and Kumar, 2017; Turabieh et al., 2019). Ac-
cording to (Gondra, 2008), this attribute can be es-
timated and predicted using prediction models based
on software metrics.
Fault injection procedure is performed based on auto-
mated mutation tools like MuJava, MuEclipse, PiTest
and much more (Delahaye and Du Bousquet, 2013).
In our research work, PiTest is used within Maven en-
vironment. To inject faults, we have adopted the fol-
lowing steps:
• All possible faults which are active by default in
PiTest are injected into the source code of the se-
lected classes These faults include the replace-
ment of binary arithmetic operations by another
ones (+ by -, - by +, * by /, / by *), etc.
• PiTest runs, and related reports are generated.
They indicate for each function, the type and the
location of the injected fault.
• PiTest reports are analyzed to identify for each
function whether it is fault-free or not. Thus, we
have determined the value of fault-proneness at-
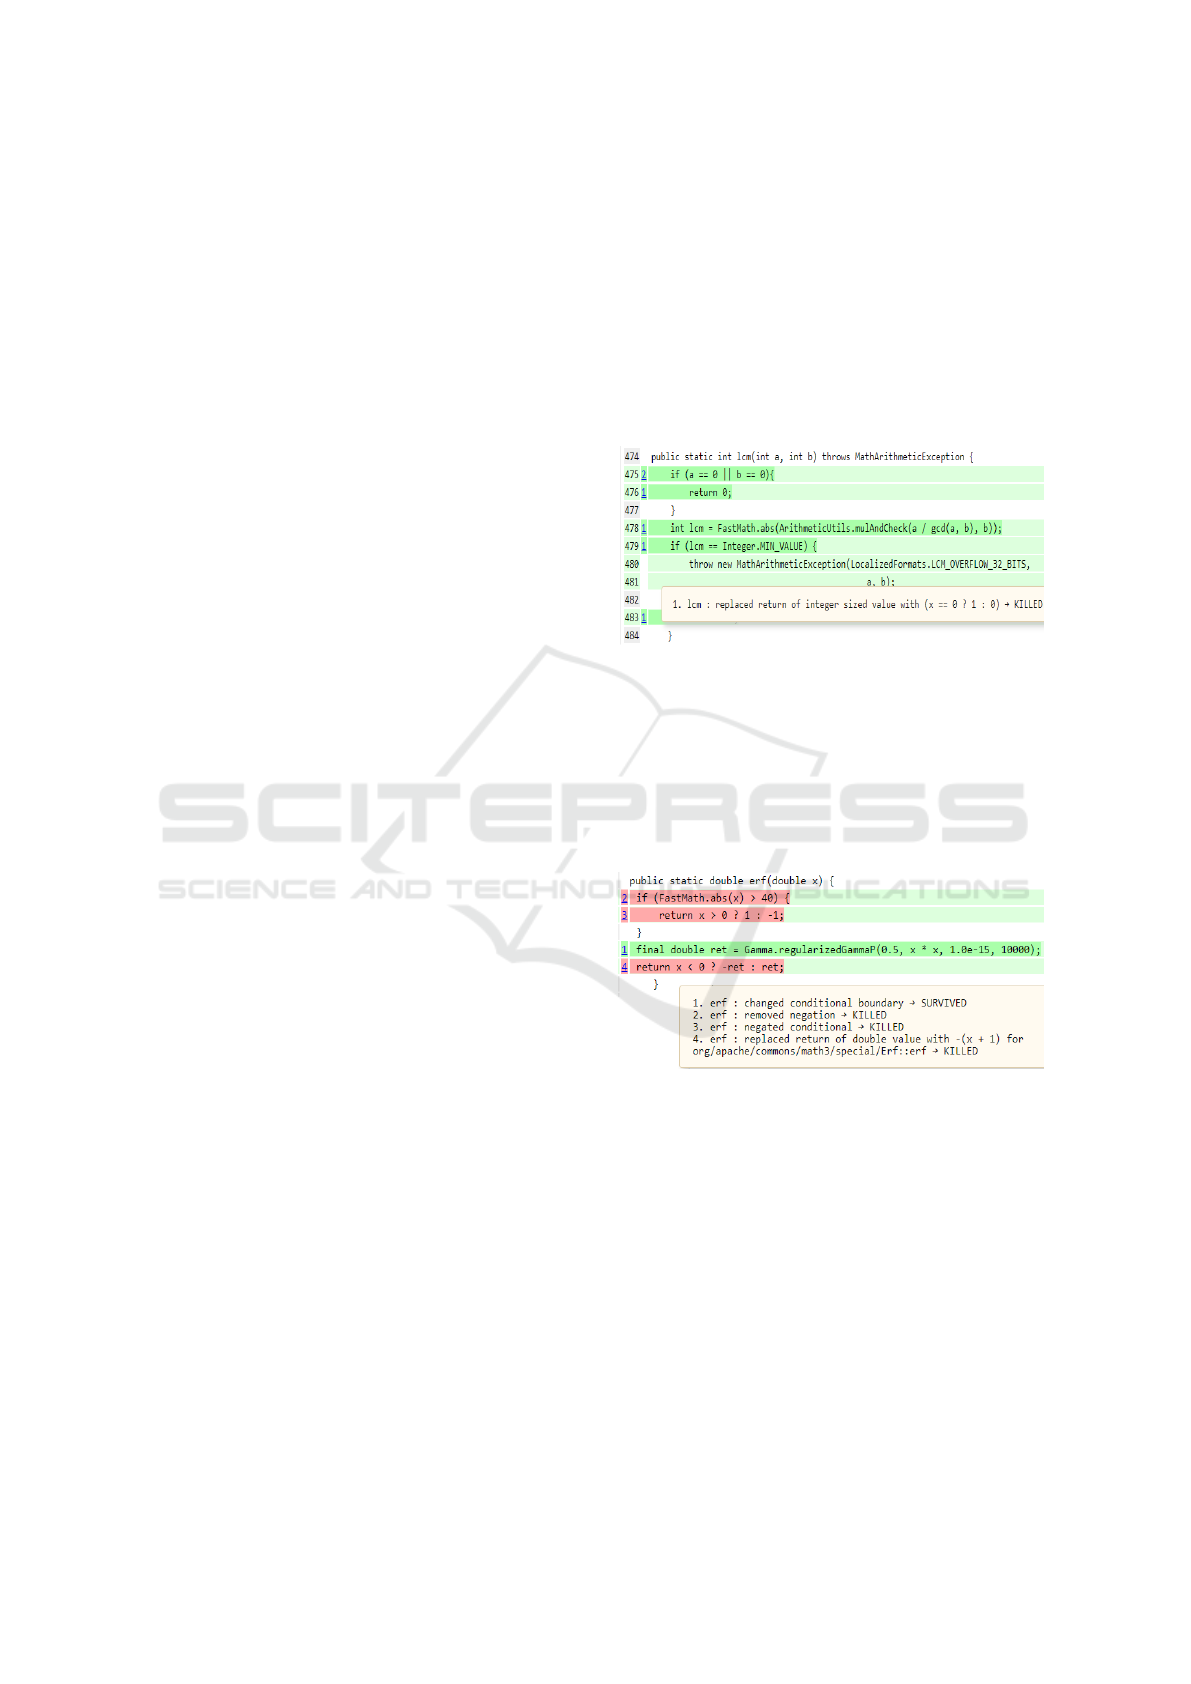
tribute (1 or 0) as follows:
– If all injected faults are detected (killed),
then the function is not defective (killed) and
the value 0 (fault-free) is assigned to fault-
proneness attribute of this function. An exam-
ple of non-defective function is depicted in Fig-
ure 1.
Figure 1: Non-Defective method (all injected faults are de-
tected).
– If at least one of the injected faults is masked
(survived), then this function is considered as
defective and the value 1 is assigned to the at-
tribute fault-proneness for this function. An ex-
ample of defective function is depicted in Fig-
ure 2.
Figure 2: Defective method (There is at least one masked
fault from those injected).
The final obtained data set contains for each method
the values of the redundancy metrics and the associ-
ated fault proneness attribute indicating whether this
function contains faults (1) or not (0).
3.3 Data Set Analysis
In this section, we have performed the data explo-
ration and correlation analysis. Data exploration is an
important step required before the application of clas-
sification techniques to analyze the data set. Thus, we
visualize in Figure 3, the percentage of fault-prone (1)
and no-fault prone (0) functions. Figure 3 shows that
ENASE 2022 - 17th International Conference on Evaluation of Novel Approaches to Software Engineering
214
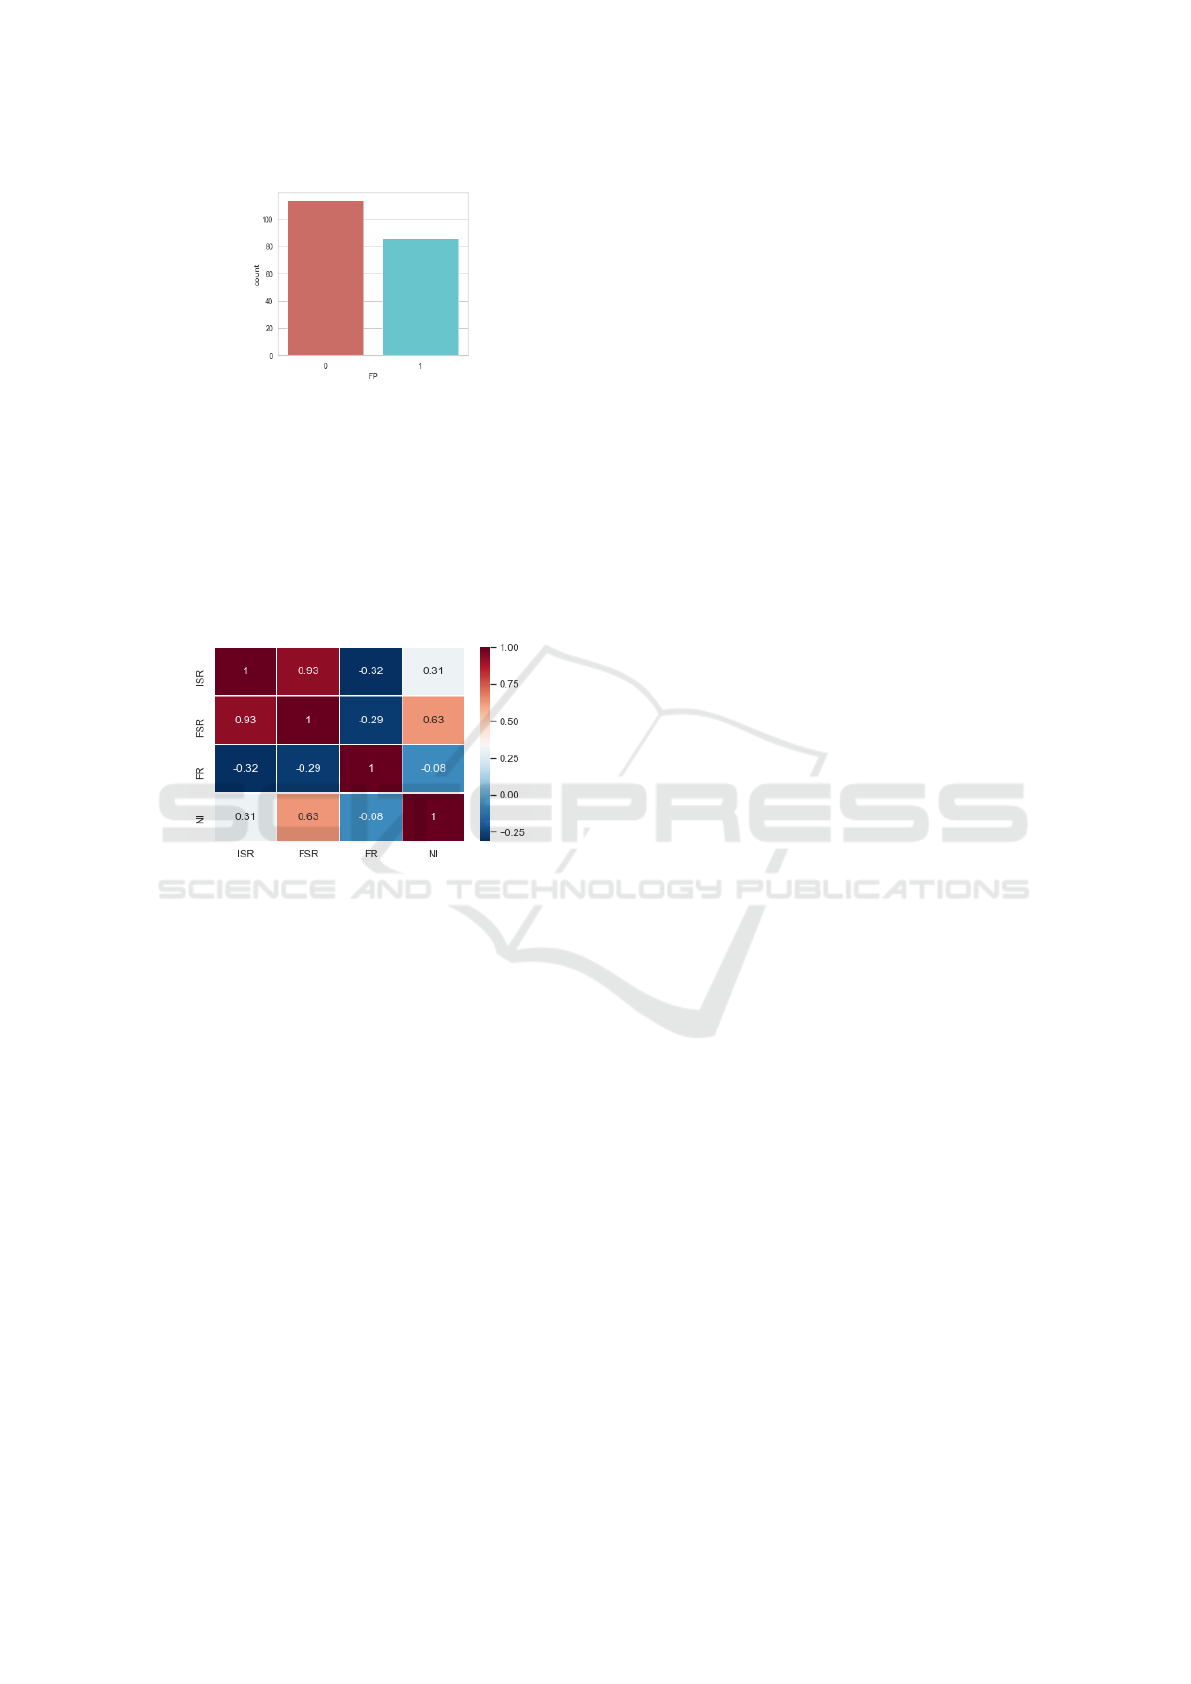
Figure 3: Data exploration.
43% of functions in the selected classes are defective
and 57% are fault-free.
We have used the correlation matrix to identify the
correlation between the independent variables; ISR,
FSR, FR and NI. The objective is to consider metrics
which are not inter-correlated in order to achieve bet-
ter model accuracy. Results are illustrated in Figure 4.
Figure 4 shows a strong correlation between ISR and
Figure 4: Pearson correlation coefficients between the inde-
pendent variables.
FSR as their correlation coefficient is strong and equal
to 0.93. FSR and NI have also significant correlation
as their correlation coefficient is 0.63. Therefore, FSR
will be omitted in our prediction. ISR and FSR met-
rics are strongly correlated as the FSR metric is com-
puted using the value of H(σ
f
) which in turn depends
on the value of H(σ
1
) used to compute ISR metric
(See equations (1) and (2)). Therefore any changes in
ISR values will lead to changes in FSR and NI ones
which explain their correlation.
4 EXPERIMENTS AND RESULTS
This section summarizes the well-used software fault
prediction techniques and presents the performed ex-
periments.
4.1 Software Faults Prediction
Techniques
The development of fault prediction models requires
the use of software prediction techniques. To select
which technique to use, we have to focus first on the
response variable we aim to predict. In this paper,
the output to predict is fault-proneness classifying
modules (functions or classes) as fault-prone or
fault-free. Therefore, classification techniques are
useful to predict this attribute using the redundancy
metrics. Different classification techniques were
defined including Decision Trees (DT), Support
Vector Machine (SVM), Naive Bayes (NB), Logistic
Regression (LR), Random Forest (RF) and much
others (Prasad et al., 2015; Turabieh et al., 2019;
Malhotra, 2015; Singh et al., 2018).
As discussed in section 2, several studies are
proposed to predict the fault-proneness attribute
based on these techniques. The objective is to
validate different software metrics or to compare the
performance of these techniques. Most of these stud-
ies showed up the effectiveness of the classification
techniques in predicting fault-proneness attribute.
However, we have stated that different criteria like
the size of the used data set (Catal and Diri, 2009),
the level of metrics’ computing (Koru and Liu,
2005) provide a variation in the performance of these
techniques. As our main objective is to study the
usefulness of the redundancy metrics in reflecting
fault-proneness attribute and not to compare the
classification techniques, we have started by applying
some of them to reach this issue.
4.2 Experiments
To build the classification models, we have proceeded
as follows:
1. To start with, data exploration phase is performed
as explained above. In addition, required Python
packages are imported.
2. Next, data set analysis and models building are
performed. In this step, we have studied the corre-
lation between the independent variables (redun-
dancy metrics) to consider only metrics that are
not inter-correlated as explained above. Also, data
is divided into two parts; train data (80%) and test
data (20%). In addition, the different cited clas-
sification techniques are used to build prediction
models based on the train data.
3. Finally, the prediction is performed on the test
data and evaluated based on different performance
Classification Techniques Use to Empirically Validate Redundancy Metrics as Reliability Indicators based on Fault-proneness Attribute
215

evaluation measures.
The presented steps are performed based on appropri-
ate modules and scripts available in the Python lan-
guage and used to build the different considered clas-
sification techniques in order to test the stated hypoth-
esis.
4.3 Results
In this section, we present the results of predicting
faulty and non faulty modules using the classification
techniques in order to answer the specified question;
”Is there a significant correlation between the redun-
dancy metrics and the fault-proneness attribute?”.
Then, we compare their performance based on differ-
ent performance evaluation measures.
4.3.1 Common Performance Evaluation
Measures
Various measures were defined to evaluate the perfor-
mance of the classification techniques(Elish and El-
ish, 2008; Abaei and Selamat, 2014; Reddivari and
Raman, 2019). A binary classifier uses data instances
in the test data to predict either they are positive or
negative. Then, four possible outcomes are obtained:
True positive (TP), False positive (FP), True negative
(TN), and False negative (FN). These four outcomes
are presented in a confusion matrix from which dif-
ferent measures were derived:
• Precision: indicates how many classes are actu-
ally defect-prone from those returned by a model.
The best value of this measure is 1. The high value
of precision indicates fewer FP (correct elements
which are classified incorrectly as defect-prone el-
ements). This measure is defined by : Precision =
TP / TP+FP
• Recall: indicates how many of the defect-prone
classes are returned actually by a model. The best
value of this measure is 1. High value of recall
measure indicates lower number of FN (defective
classes non indicated by the model). It is defined
by: Recall = TP / TP+FN
• Accuracy: indicates the rate of correct classifi-
cation. It is presented as ratio of the number of
correctly predicted modules to the total number
of modules and defined by: Accuracy = TP+TN /
TP+TN +FP+FN
• Area under the curve (AUC) : is a curve with two
dimensions; x-axis is represented by FP and y-
axis is represented by TP.
4.3.2 Results
The presented evaluation measures are used to
evaluate the performance of the different used classi-
fication techniques. Results are illustrated in Tables 2
to 6.
Table 2: Results of DT prediction model.
(a) Performance measure
Precision Recall F1-score
0 0.83 0.87 0.70
1 0.81 0.76 0.79
Accuracy 0.82
(b) Confusion matrix
1 0
1 20 3
0 4 13
Table 3: Results of LR prediction model.
(a) Performance measure
Precision Recall F1-score
0 0.61 0.83 0.70
1 0.56 0.29 0.38
Accuracy 0.60
(b) Confusion matrix
1 0
1 19 4
0 12 5
Table 4: Results of NB prediction model.
(a) Performance measure
Precision Recall F1-score
0 0.63 0.83 0.72
1 0.60 0.35 0.44
Accuracy 0.82
(b) Confusion matrix
1 0
1 19 4
0 11 6
Tables 2 to 6 illustrate the different evaluation
measures obtained for the selected classification
ENASE 2022 - 17th International Conference on Evaluation of Novel Approaches to Software Engineering
216
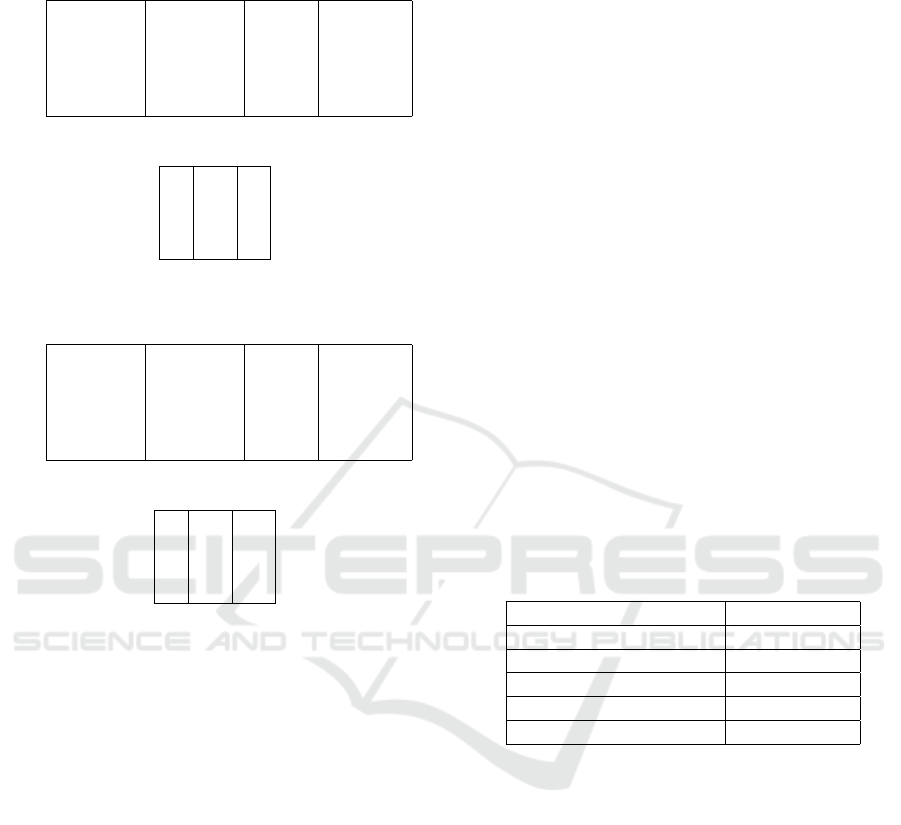
Table 5: Results of SVM prediction model.
(a) Performance measure
Precision Recall F1-score
0 0.70 0.83 0.76
1 0.69 0.53 0.60
Accuracy 0.70
(b) Confusion matrix
1 0
1 19 4
0 8 9
Table 6: Results of RF prediction model.
(a) Performance measure
Precision Recall F1-score
0 0.80 0.87 0.83
1 0.80 0.71 0.77
Accuracy 0.80
(b) Confusion matrix
1 0
1 20 3
0 4 13
techniques. Thus, for each technique, we have
summarized the classification report providing us
with the values of the presented performance evalu-
ation measures and we have presented the confusion
matrix from which these measures are computed. As
shown in these tables, the support measure for the
different techniques indicates that the data tested for
1 (fault-prone functions) is 17 and for 0 (fault-free
functions) is 23. For these values, we have stated
that:
• The precision measure shows that DT and RF per-
form well in predicting fault-prone modules with
values of respectively 0.81 and 0.80. NB and
SVM perform moderately with a precision val-
ues of respectively 0.60 and 0.69. Precision shows
also that LR is the least effective model for fault-
proneness prediction with precision value of 0.56.
• In terms of recall and F-measure, LR and NB clas-
sifiers had low comparable performance and these
measures range from 0.29 to 0.44. SVM has a
moderate F-measure and recall rate that ranges
from 0.53 to 0.60. DT and RF have the highest
recall and F-measure rate that ranges from 0.71 to
0.79.
• Accuracy shows that LR and NB are the least ef-
fective models for fault-proneness prediction as
their accuracy rates are respectively of 0.60 and
0.62. For SVM classifier, it has a moderate accu-
racy rate that is 0.7. DT and RF have the high-
est accuracy rates that are respectively of 0.82 and
0.81.
• Confusion matrix shows that for LR, there were
23 points in the first class (label 0) and 17 in the
second one (1). From these 17 points, we have
stated that:
– LR and NB present comparative results and
succeed in identifying respectively 5 and 6 of
those correctly in label 1, but 12 and 11 were
respectively marked as label 0.
– For SVM, from the 17 points, it succeed in
identifying 9 of those correctly in label 1,
whilst, 8 points were marked as label 0.
– Concerning DT, we have stated that from the 17
points, the model succeed in identifying 13 of
those correctly in label 1 and only 4 points were
marked as label 0. The same results were given
by the RF classifier.
We summarize in Table 7, the accuracy rate of the
different techniques.
Table 7: Accuracy rate for the selected classifiers.
Classifier Accuracy rate
Logistic Regression 60%
Naive Bayes 62%
Support Vector Machine 70%
Decision Tree 82%
Random Forest 80%
Taking accuracy as the most used models’ eval-
uation measure, results in Table 7 show that DT is
the most appropriate technique followed by RF suc-
ceeded in measuring fault-proneness attribute based
on redundancy metrics.
5 DISCUSSION, THREATS TO
VALIDITY AND COMPARISON
WIDTH RELATED WORKS
This section summarizes the results and presents the
identified threats to validity. Also, a comparison with
the related works is presented.
Classification Techniques Use to Empirically Validate Redundancy Metrics as Reliability Indicators based on Fault-proneness Attribute
217

5.1 Overall Discussion of Results and
Threats to Validity
We have experimented with different popular clas-
sifiers the usefulness of the redundancy metrics as
reliability indicators using fault-proneness attribute.
A set of 200 functions selected from Commons-math
Apache project is used. Considering accuracy as
the evaluating parameter, results show that the
fault proneness attribute can be predicted using the
redundancy metrics with a good accuracy rate of
0.82. This leads us to accept the stated H1 hypothesis
indicating that the redundancy metrics are useful
indicators of fault proneness attribute and reject the
null hypothesis of no relationship between these two
variables. Therefore, these results can be used as
first guidance to predict faulty modules based on the
redundancy metrics.
We have obtained promising results proposing vali-
dated ISR and NI redundancy metrics as significant
reliability indicators for the both considered defect
density and fault-proneness attributes. However, we
have noted several threads to validity:
• First, the proposed redundancy metrics are seman-
tic as they depend on the program functionality;
each program (function or class) has its state rep-
resented by the manipulated variables. Hence,
each time the used variables in the program in-
put state change, the output state will change, and
the values of the redundancy metrics will change
too. Therefore, the proposed computing process
described in the previous work is not fully auto-
mated and it is implemented separately for each
program.
• Second, as more we use larger training data sets
and optimizing model parameters, better we im-
prove the model prediction performance (Singh
et al., 2018), our data set can be extended to en-
hance the performance of the proposed prediction
model.
• Comparing the redundancy metrics with other ex-
isted metrics validated as fault-proneness indica-
tors can enhance their performance as significant
quality indicators.
• Performing other experiments using the same
dataset and the same classification techniques by
taking into account different metrics that include
internal attributes such as complexity and cohe-
sion measured by C&K metrics (Chidamber and
Kemerer, 1994) and compare results with entropy
metrics.
5.2 Comparison between Our Proposed
Approach and Related Works
In (Ayad et al., 2018), authors have proposed an em-
pirical validation of the redundancy metrics using the
rate of mutants as quality attribute. We compare our
work with their work in Table 8.
Table 8: Some differences and similarities between the re-
lated works and our work.
Criteria (Ayad et al.,
2018)
Our work
Suite of
metrics
(Independent
variables)
ISR, FSR, FR
and NI
ISR, FSR, FR
and NI
Quality
attribute
(Dependent
variable)
Survival rate of
mutants
Fault-proneness.
Data
repository
Apache Com-
mon Mathemat-
ics Library
Apache Com-
mon Mathemat-
ics Library.
Size of the
used data
set
- 19 functions - 200 func-
tions for fault-
proneness
attribute.
Quality
attribute
collection
procedure
Fault injection
procedure based
on PiTest tool
is used then
PiTest reports
are analyzed to
obtain the values
of the considered
attribute.
Fault injection
procedure based
on PiTest tool
is used then
PiTest reports
are analyzed to
obtain the values
of the considered
attribute.
Statistical
techniques
- Correlation
analysis between
the independent
variables is not
performed.
- Linear multi-
variate regres-
sion technique is
used.
- Correlation
analysis between
the independent
variables is
performed.
- Different
classification
techniques are
used.
Results All redundancy
metrics are iden-
tified as signifi-
cant indicators of
the survival rate
of mutants.
Only ISR and
NI are identified
as significant
indicators of de-
fect density and
fault-proneness
attributes.
ENASE 2022 - 17th International Conference on Evaluation of Novel Approaches to Software Engineering
218

Only ISR and FR are considered in our ex-
perimentation because we have identified a strong
correlation between ISR and FSR as shown in Figure
4 which leads us to omit the FSR metric. Concerning
the FR metric, we have included it in our experimen-
tation, but we have stated that it hasn’t any change on
the results contrary to ISR and NI.
As shown in Table 8, little works are proposed
to empirically validate the redundancy metrics as
reliability predictors. The presented comparison
shows that:
• The same validation approach was used. In both
cases, data set is first collected, then, data analy-
sis, models building and performance evaluation
steps are performed. In addition, the work de-
scribed in (Ayad et al., 2018) is comparable to our
work as the same data repository is used to com-
pute the metrics.
• Authors in (Ayad et al., 2018) showed that all of
the redundancy metrics are significant predictors
of the survival rate of mutants and software re-
liability. However, in our validation work, only
ISR and NI metrics appeared to be adequate in
predicting software reliability using defect density
and fault-proneness attributes. The lack of corre-
lation tests between the independent variables in
their study and the difference in selecting relia-
bility quality attributes can explain these different
results. On another hand, the nature of the con-
sidered fault-proneness quality attribute as depen-
dent variable lead us to use various classification
techniques.
6 CONCLUSION AND
PERSPECTIVES
Initial state redundancy, final state redundancy, non-
injectivity, and functional redundancy metrics were
proposed to assess the code’ redundancy in order to
monitor software reliability. However, all of these
metrics are manually computed and theoretically
presented. In this research, we aim at empirically
validating these metrics as significant reliability
indicators. We have used the fault proneness attribute
as a direct reflection of software reliability to reach
our objective.
We have used an empirical database including a
set of Java functions taken from the Commons Math
Library, all related redundancy metrics’ values, and
the fault-proneness attribute as a direct reliability
indicator. Five classification techniques (LR, SVM,
DT, RF, and NB) are then used to assess the rela-
tionship between these two variables. The obtained
results can be used as first guidance to predict faulty
modules based on the redundancy metrics. The
primary contribution is to assess the capability of the
redundancy metrics in predicting faulty modules.
As the initial state redundancy metric only mea-
sures the program redundancy in its initial and final
states without considering the redundancy of its
internal states, we propose in the future work, to
improve this metric by considering its internal states
in order to reflect the overall program redundancy. In
addition, replicated studies with large sized software
should be carried out so that generalized results can
be obtained.
REFERENCES
Abaei, G. and Selamat, A. (2014). A survey on soft-
ware fault detection based on different prediction ap-
proaches. Vietnam Journal of Computer Science,
1(2):79–95.
Amara, D., Fatnassi, E., and Ben Arfa Rabai, L. (2021).
An empirical assessment and validation of redundancy
metrics using defect density as reliability indicator.
Scientific Programming, 2021.
Amara, D. and Rabai, L. B. A. (2017). Towards a new
framework of software reliability measurement based
on software metrics. Procedia Computer Science,
109:725–730.
Arvanitou, E. M., Ampatzoglou, A., Chatzigeorgiou, A.,
Galster, M., and Avgeriou, P. (2017). A mapping study
on design-time quality attributes and metrics. Journal
of Systems and Software, 127:52–77.
Asghari, S. A., Marvasti, M. B., and Rahmani, A. M.
(2018). Enhancing transient fault tolerance in embed-
ded systems through an os task level redundancy ap-
proach. Future Generation Computer Systems, 87:58–
65.
Ayad, A., Marsit, I., Omri, N. M., Loh, J., and Mili, A.
(2018). Using semantic metrics to predict mutation
equivalence. In International Conference on Software
Technologies, pages 3–27. Springer.
Bansiya, J. and Davis, C. G. (2002). A hierarchical model
for object-oriented design quality assessment. IEEE
Transactions on software engineering, 28(1):4–17.
Briand, L. C. and W
¨
ust, J. (2002). Empirical studies of qual-
ity models in object-oriented systems. In Advances in
computers, volume 56, pages 97–166. Elsevier.
Catal, C. and Diri, B. (2009). A systematic review of soft-
ware fault prediction studies. Expert systems with ap-
plications, 36(4):7346–7354.
Chidamber, S. R. and Kemerer, C. F. (1994). A metrics
suite for object oriented design. IEEE Transactions
on software engineering, 20(6):476–493.
Classification Techniques Use to Empirically Validate Redundancy Metrics as Reliability Indicators based on Fault-proneness Attribute
219

Delahaye, M. and Du Bousquet, L. (2013). A comparison
of mutation analysis tools for java. In 2013 13th Inter-
national Conference on Quality Software, pages 187–
195. IEEE.
Dubrova, E. (2013). Fault-tolerant design. Springer.
Elish, K. O. and Elish, M. O. (2008). Predicting defect-
prone software modules using support vector ma-
chines. Journal of Systems and Software, 81(5):649–
660.
Febrero, F., Calero, C., and Moraga, M.
´
A. (2016). Software
reliability modeling based on iso/iec square. Informa-
tion and Software Technology, 70:18–29.
Fenton, N. and Bieman, J. (2014). Software metrics: a rig-
orous and practical approach. CRC press.
Gondra, I. (2008). Applying machine learning to software
fault-proneness prediction. Journal of Systems and
Software, 81(2):186–195.
Gyimothy, T., Ferenc, R., and Siket, I. (2005). Empirical
validation of object-oriented metrics on open source
software for fault prediction. IEEE Transactions on
Software engineering, 31(10):897–910.
He, P., Li, B., Liu, X., Chen, J., and Ma, Y. (2015). An
empirical study on software defect prediction with a
simplified metric set. Information and Software Tech-
nology, 59:170–190.
Jabangwe, R., B
¨
orstler, J.,
ˇ
Smite, D., and Wohlin, C.
(2015). Empirical evidence on the link between
object-oriented measures and external quality at-
tributes: a systematic literature review. Empirical
Software Engineering, 20(3):640–693.
Kalaivani, N. and Beena, R. (2018). Overview of software
defect prediction using machine learning algorithms.
International Journal of Pure and Applied Mathemat-
ics, 118(20):3863–3873.
Karimian, F. and Babamir, S. (2017). Evaluation of classi-
fiers in software fault-proneness prediction. Journal
of AI and Data Mining, 5(2):149–167.
Kaur, A. and Kaur, I. (2018). An empirical evaluation of
classification algorithms for fault prediction in open
source projects. Journal of King Saud University-
Computer and Information Sciences, 30(1):2–17.
Koru, A. G. and Liu, H. (2005). Building effective
defect-prediction models in practice. IEEE software,
22(6):23–29.
Kumar, L., Misra, S., and Rath, S. K. (2017). An empirical
analysis of the effectiveness of software metrics and
fault prediction model for identifying faulty classes.
Computer Standards & Interfaces, 53:1–32.
Kumar, S. and Rathore, S. S. (2018). Software Fault Pre-
diction: A Road Map. Springer.
Lomio, F., Moreschini, S., and Lenarduzzi, V. (2021). Fault
prediction based on software metrics and sonarqube
rules. machine or deep learning? arXiv preprint
arXiv:2103.11321.
Lyu, M. R. et al. (1996). Handbook of software reliabil-
ity engineering, volume 222. IEEE computer society
press CA.
Malhotra, R. (2015). A systematic review of machine learn-
ing techniques for software fault prediction. Applied
Soft Computing, 27:504–518.
Menzies, T., DiStefano, J., Orrego, A., and Chapman, R.
(2004). Assessing predictors of software defects. In
Proc. Workshop Predictive Software Models.
Mili, A., Jaoua, A., Frias, M., and Helali, R. G. M. (2014).
Semantic metrics for software products. Innovations
in Systems and Software Engineering, 10(3):203–217.
Nakai, H., Tsuda, N., Honda, K., Washizaki, H., and
Fukazawa, Y. (2016). Initial framework for software
quality evaluation based on iso/iec 25022 and iso/iec
25023. In 2016 IEEE International Conference on
Software Quality, Reliability and Security Companion
(QRS-C), pages 410–411. IEEE.
Olague, H. M., Etzkorn, L. H., Gholston, S., and Quat-
tlebaum, S. (2007). Empirical validation of three
software metrics suites to predict fault-proneness of
object-oriented classes developed using highly itera-
tive or agile software development processes. IEEE
Transactions on software Engineering, 33(6):402–
419.
Prasad, M., Florence, L., and Arya, A. (2015). A study
on software metrics based software defect prediction
using data mining and machine learning techniques.
International Journal of Database Theory and Appli-
cation, 8(3):179–190.
Radjenovi
´
c, D., Heri
ˇ
cko, M., Torkar, R., and
ˇ
Zivkovi
ˇ
c, A.
(2013). Software fault prediction metrics: A system-
atic literature review. Information and software tech-
nology, 55(8):1397–1418.
Rathore, S. S. and Kumar, S. (2017). An empirical
study of some software fault prediction techniques
for the number of faults prediction. Soft Computing,
21(24):7417–7434.
Reddivari, S. and Raman, J. (2019). Software quality pre-
diction: An investigation based on machine learning.
In 2019 IEEE 20th International Conference on Infor-
mation Reuse and Integration for Data Science (IRI),
pages 115–122. IEEE.
Shannon, C. (2001). A mathematical theory of communica-
tion. ACM SIGMOBILE mobile computing and com-
munications review, 5:3–55.
Singh, A., Bhatia, R., and Singhrova, A. (2018). Taxonomy
of machine learning algorithms in software fault pre-
diction using object oriented metrics. Procedia com-
puter science, 132:993–1001.
Turabieh, H., Mafarja, M., and Li, X. (2019). Iterated fea-
ture selection algorithms with layered recurrent neural
network for software fault prediction. Expert Systems
with Applications, 122:27–42.
Verma, D. K. and Kumar, S. (2017). Prediction of defect
density for open source software using repository met-
rics. J. Web Eng., 16(3&4):294–311.
Zhou, Y., Xu, B., and Leung, H. (2010). On the ability
of complexity metrics to predict fault-prone classes in
object-oriented systems. Journal of Systems and Soft-
ware, 83(4):660–674.
ENASE 2022 - 17th International Conference on Evaluation of Novel Approaches to Software Engineering
220
