DECART: Planning for Decarbonising Transport Sector with
Predictive Analytics - An Irish Case Study
Meghana Kshirsagar
1,2,* a
, Gauri Vaidya
1,2 b
, Shravani Rajguru
3
, Pruthviraj Jadhav
3
,
Hrushabh Kale
3
, Nishanth Shanmugam
3
, Conor Ryan
1,2
and Vivek Kshirsagar
3
1
Biocomputing and Developmental Systems Group, University of Limerick, Limerick, Ireland
2
Lero, The Science Foundation Ireland Research Centre for Software, Limerick, Ireland
3
Department of Computer Science and Engineering, Government College of Engineering, Aurangabad, India
Keywords: Decarbonization, Machine Learning, Time-Series Forecasting, Renewable Energy, Carbon Emissions, Road
Transport.
Abstract: This article explores assessing the impact of the decarbonisation of the transport sector using an evidence-
based approach incorporating data analysis and advanced machine learning (ML) modelling. We investigate
the radical behavioural and societal changes needed for the decarbonisation of the transport sector in Ireland.
We perform a study through our system DECArbonisation in Road Transport (DECART), a suite of statistical
and time series ML models for facilitating policy making, monitoring and advising governments, companies
and organisations in the transport sector. Based on data analysis and through scenario-modelling approaches,
we present alternatives to policy and decision makers to achieve goals in mitigation of carbon emissions in
road transport. The models depict how changes in mobility patterns in road transport affect CO2 emissions.
Through insights obtained from the models, we infer that renewable energy in Ireland has the potential for
meeting the growing electricity needs of electric vehicles. Experimentation is conducted on real-world
datasets such as traffic, motor registrations, and data from renewable sources such as wind farms, for building
efficient ML models. The models are validated in terms of accuracy, based on their potential to capture hidden
insights from real-world events and domain knowledge.
1 INTRODUCTION
Globally in 2020, we saw a dramatic fall in carbon
emissions, due to Covid -19 pandemic which resulted
in periodic lockdowns. This was also true for Ireland
where we saw around 15% decline in carbon
emissions. However, with the resumption of normal
activities and similar mobility patterns like those of
pre-pandemic times, we are once again faced with the
challenge of carbon emissions in transportation.
The statistics of greenhouse gases in Ireland
(Summary by Gas | Environmental Protection
Agency, n.d.) states that the major contributors are
Carbon Dioxide (CO2) and Methane (CH4). CO2
mainly comes from the combustion of fossil fuels and
emissions from the transport sector, contributing 40%
a
https://orcid.org/0000-0002-8182-2465
b
https://orcid.org/0000-0002-9699-522X
c
https://orcid.org/0000-0002-7002-5815
of total fuel powered emissions in Ireland, while CH4
comes from agricultural livestock.
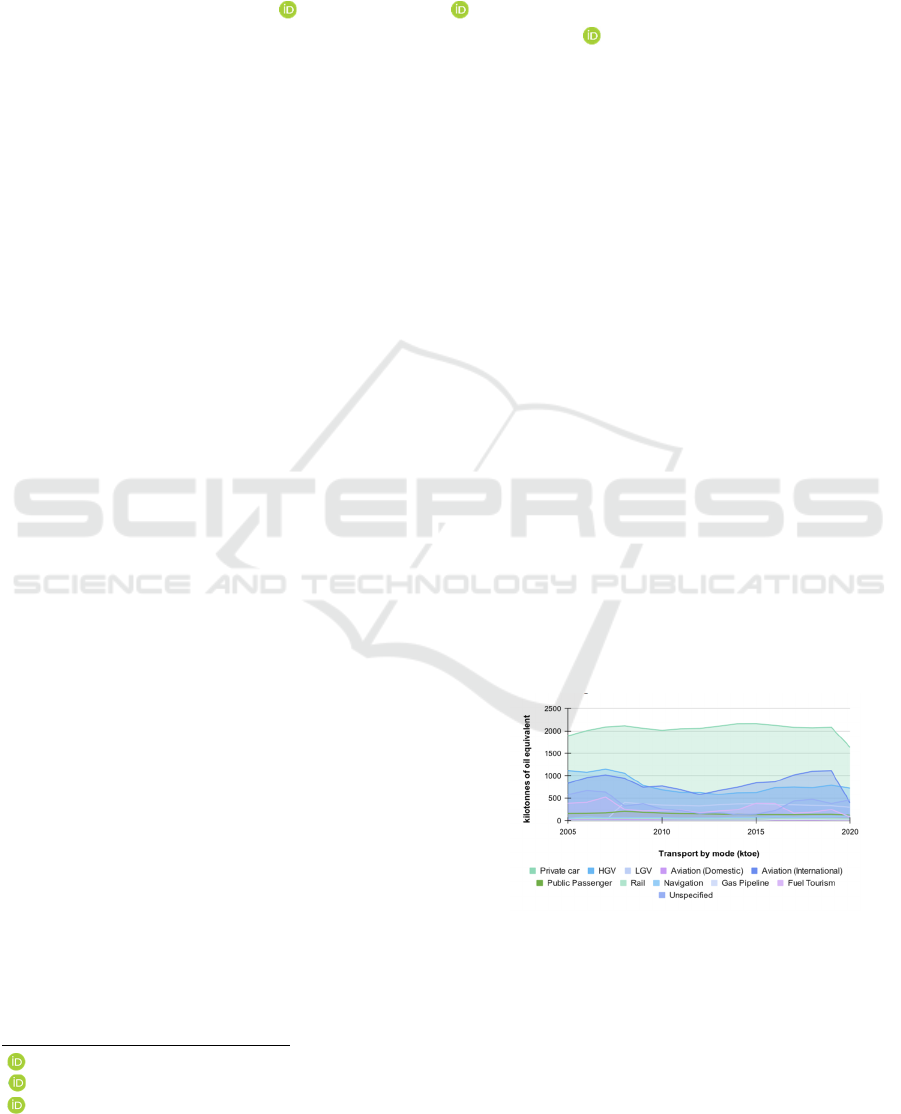
Figure 1: Carbon emissions according to Vehicle types.
Figure 1 (Transport | Energy Statistics In Ireland
| SEAI, n.d.), further breaks down the emissions
resulting from major vehicles in the road
Kshirsagar, M., Vaidya, G., Rajguru, S., Jadhav, P., Kale, H., Shanmugam, N., Ryan, C. and Kshirsagar, V.
DECART: Planning for Decarbonising Transport Sector with Predictive Analytics - An Irish Case Study.
DOI: 10.5220/0011087100003203
In Proceedings of the 11th International Conference on Smart Cities and Green ICT Systems (SMARTGREENS 2022), pages 157-164
ISBN: 978-989-758-572-2; ISSN: 2184-4968
Copyright
c
2022 by SCITEPRESS – Science and Technology Publications, Lda. All rights reserved
157
transportation in Ireland. We observe that private cars
lead the graph by emitting the maximum Carbon
Dioxide which is then followed by Heavy Goods
Vehicles and Light Goods Vehicles. Therefore,
reducing emissions from transport sector is of the
significant interest.
1.1 Contributions
This research paper examines how the government in
Ireland can provide pathways towards a greener
Ireland by decarbonizing 80% of the country by 2050.
In this paper we:
1. Develop DECArbonisation in Road
Transport (DECART), a Machine Learning
(ML) framework leveraging real-world
datasets such as traffic, motor-registrations,
renewables, etc. to obtain critical and hidden
insights in the decarbonisation of transport
sector;
2. The DECART system will be used to monitor
and plan progress in reducing carbon
emissions caused by transport through
predicting growth of electric vehicles;
3. The DECART system will be able to predict
the potential of renewable energy to match up
with the electricity requirements for the
growing footprint of electric vehicles.
The structure of the research work is as follows:
In the background section, we explore some of the
recent works in decarbonisation using ML. In the
methodology section, we discuss the architecture of
the DECART system and, then we discuss the
evidence-based insights based on the models in
Results section. Finally, we conclude the article with
key insights and recommendations.
2 BACKGROUND
There has been growing interest in the field of
transportation among researchers. Some have focused
on reducing congestion control through cost pricing
models (Kshirsagar et al., 2021) while others have
also explored alternative ways in which renewable
energy can be harnessed through road traffic
(Kshirsagar et al., 2021). Some works also
investigated optimizing the usage of fossil fuel in the
transport sector (Gota et al., n.d.; The Challenge of
Decarbonizing Heavy Transport Samantha Gross
Executive Summary, 2020). Researchers have
harnessed the power of ML to develop forecasting
models to gain valuable insights and understandings
on the impact of carbon emissions in road transport
(de Blas et al., 2020; Fu et al., 2019; Nouni et al.,
2021).
In Ireland, this optimization was facilitated with
the emergence of the carbon tax levied on fuel-based
vehicles based to the age of vehicle and amount of
carbon emitted by the vehicle. For every litre of diesel
in addition to its cost of €1.70/litre, the carbon tax
adds to 10.5 cents and the combination of Value
Added Tax and excise duty adds another 80 cents to
a litre of petrol (What Is the Carbon Tax? |
Bonkers.Ie, n.d.).
Recently, certain initiatives from the government
of Ireland have motivated people towards buying
electric vehicles (EVs). Some of the intangible
benefits; however, can be observed immediately with
the purchase of EVs are:
The cost of the cheapest EV can be
anything between 15% to 50% higher than the
conventional fuel-based passenger cars. But
certain government grants make an attractive
comparison in prices to conventional cars;
Reduction in Vehicle Registration Tax
summing up to €5000;
Reductions in tolls of up to 50% for electric
and 25% for hybrid as compared to fuel-based
vehicles;
A minimum saving in carbon tax of average
of around €100-€300 and which can extend up to
€1200 depending upon the age of fuel-based cars.
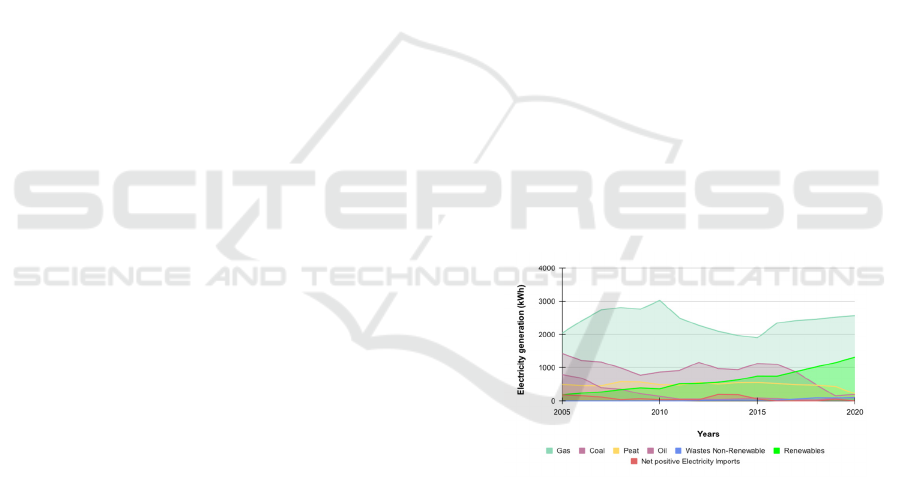
Figure 2: Electricity generation from various sources.
The rising number of EVs will cause an increase
in the electricity demand for sourcing the vehicles.
These growing demands of EVs can be significantly
met with renewable energy sources in Ireland.
Similarly, one such alternative for reduction in carbon
emission, which is growing rapidly in Ireland and
other European countries in the use of fuel cell
electric buses, which are powered by hydrogen
instead of electricity as a means of public transport.
Fuel cell vehicles have more demand due to less
refuelling time (10 mins), as compared to pure
electric (180-240 mins). There have been 100 fuel cell
electric buses active across Europe since 2018
SMARTGREENS 2022 - 11th International Conference on Smart Cities and Green ICT Systems
158
(Gunawan et al., 2021). The recent report (Dublin
Unveils Three New Hydrogen Fuel Cell Buses -
Intelligent Transport, n.d.) shows that this will be
soon active in Dublin County in Ireland as an
initiative for zero carbon emission. However, for both
electric as well as hydrogen fuelled vehicles,
renewable energy sources hold a greater potential as
a clean source of energy.
In the not-too-distant past, fuel was primarily the
main source of energy generation at the cost of
emitting large carbon emissions as observed in Figure
2. But since the past decade, there is a switch to fulfil
electricity needs from renewables as observed in
Figure 2 due to negligible carbon emission.
(Electricity | Energy Statistics In Ireland | SEAI, n.d.).
This suggests that renewables will play a significant
role in sourcing electricity requirements in the near
future.
3 METHODOLOGY
This section describes the proposed system
architecture, datasets used, and the ML models
designed for predictive analytics to gain insights from
the mobility patterns in Ireland.
3.1 Architecture of DECART System
and Datasets Used in
Experimentation
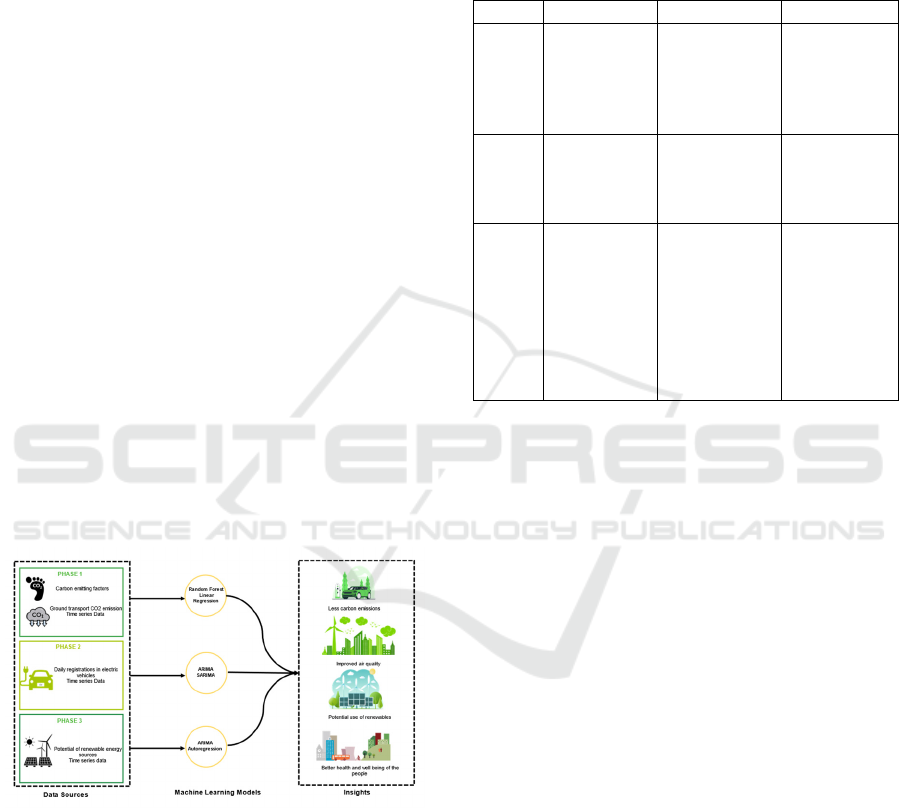
Figure 3: DECART Architecture.
The DECART system comprises of a suite of
regression and time-series forecasting models. This
system, with the evidence-based insights obtained
from the ML models, helps us to understand the
present carbon footprint and plan cautiously for the
future to address the challenge of mitigating carbon
emissions in the transport sector. The pipeline of the
DECART system, with its three phases is as illustrated
in Figure 3.
Phase 1 of the system helps us to understand the
carbon emitting factors for fuel-based vehicles using
ML models. With the insights the models, we propose
some of behavioural changes in the society
contributing towards reducing carbon emission.
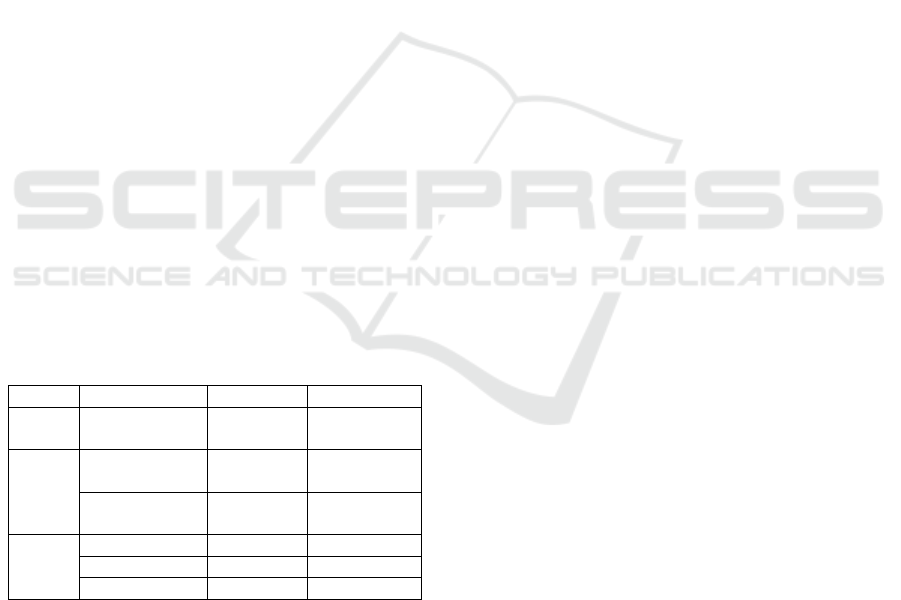
Table 1: Dataset details.
Dataset Name Description Source
D1
Phase 1:
Monitoring CO2
emissions from
passenger cars
Quantitative
statistics of
passenger car
(2017-20)
(Monitoring of
CO2 Emissions
from Passenger
Cars, n.d.)
D2
Phase 2:
Daily motor
registrations
Number of EV
registrations in
Ireland
(2016-21)
(SIMI
Motorstats .n.d.)
D3
Phase 3:
EnergyPro
Dataset
Information about
energy produced
every 10 minutes
period from wind
farms spread
across some Irish
counties
(2017 - 2018)
(Energy Pro -
Specialist
Windfarm
Analysts &
Managers, n.d.)
Phase 2, with its time-series forecasting models
predicts the growth of EVs in the near future. Phase 3
presents a case study using real-world dataset to
predict the potential of Ireland to source the growing
number of EVs in the future. The datasets used in
experimentation and the overview of their usage in
individual phases are discussed in Table 1.
3.2 ML Models Used in
Experimentation
This work has made use of regression and time series
forecasting models for predictive analytics.
3.2.1 Regression Models
Regression analysis is the process of mathematical
modeling to deploy a relation between dependent and
independent variables. We have used multivariate
linear regression and random forest regression in our
experimentations.
Multivariate Linear Regression: A mathematical
model that deploys a linear relationship between an
dependent variable, Y and multiple independent
variables X {X
1
, X
2
, …, X
n
} (Schneider et al., 2010).
The linear relation between these variables is
described as in equation (1). The multivariate
regression model is used in Phase 1 of the DECART
DECART: Planning for Decarbonising Transport Sector with Predictive Analytics - An Irish Case Study
159

system with dataset D1. The model predicts CO2
emission from the registration year, engine capacity
and manufacture type of the fuel-based vehicle.
Yab
X
b
X
1…b
X
1
where,
Y: dependent variable
𝑋
: independent variables
a:constant y intercept
𝑏
: regression coefficient of the variable 𝑋
Random Forest Regressor: Random Forest
regression is the process of ensembling the
predictions from sub-trees, sampled independently
from the datasets to get accurate results. These
regression models are more robust to noise,
decreasing the generalization errors (Breiman, 2001).
The random forest regressor, too, is used in Phase 1
of the system and gives better accuracy over
multivariate regression model.
3.2.2 Time-series Models
The time series models are used in Phase 2 and 3 of
the system for forecasting the growth of electric
vehicles and estimating amount of energy generated
with wind plants.
A time series model is a mathematical model of
an event with a set of vectors x(t), where t = 0, 1, 2,
..., n measured over a period of time to predict the
patterns of the event in future. The process of fitting
a model to the data points of given time series is
termed as time series analysis (Hornik et al., 1989).
Over the Phases 2 and 3 in DECART system, we have
used following three models for forecasting:
Autoregressive (AR) Time Series Model: In AR
Model, a regression model is used to predict the
values at given time t, from the previous data points.
The equation for AR model is as explained in
equation (2) (Box, 1989). We have used AR model in
forecasting the energy generation from wind plant
with dataset D3 in Phase 3 of the system.
x
b
b
x
𝜀
2
where:
x
: value of event at time t
b
: intercept at y axis
b
:slope coefficient
x
: value of event at time t 1
ε
: error term
t: time
Autoregressive Integrated Moving Average
(ARIMA): An ARIMA model used the previous data
points and previous error points in a regression model
to predict the values at given time t. The mathematical
representation of ARIMA models is as in equation (3)
(John & Cochrane, 1997). ARIMA model was used
for predicting the energy generation from wind plants
in Phase 3 which performed better than the AR
model.
𝛗
L
1L
y
𝛉
L
𝛆
,i.e.
1 𝛗
L
1L
y
1𝛉
L
𝛆
3
where:
p: order of autoregressive part
d: order of integrated part
q: order of moving average part
Seasonal ARIMA (SARIMA): AR and ARIMA
models are used with stationary data, where the trends
in the data does not vary with time. However, for
forecasting the seasonal trends in the data, SARIMA
models are used (Agwata Nyamato et al., 2020). The
data is first converted to stationary format with pre-
processing and then the future values are forecasted
using the following equation (4):
Φ
𝐿
𝜑
𝐿
1𝐿
1𝐿
𝑦
Θ
𝐿
𝜃
𝐿
𝜀
,
𝑖.𝑒.Φ
𝐿
𝜑
𝐿
𝑧
Θ
𝐿
𝜃
𝐿
𝜀
,
4
where:
𝑧
: 𝑠𝑒𝑎𝑠𝑜𝑛𝑎𝑙𝑙𝑦 𝑑𝑖𝑓𝑓𝑒𝑟𝑒𝑛𝑐𝑒𝑑 𝑠𝑒𝑟𝑖𝑒𝑠
The dataset D2 for predicting the rate of growth
in electric vehicles in Ireland follows a seasonal trend.
Hence, SARIMA model was designed to fit this data.
ARMAX: In some of the instances of time series
models, the models are not only affected by past
values of the series, but also by the external factors
(Tang et al., 2000). e.g. Effect of change in wind
speed on the generation of wind energy. In such cases,
ARMAX models are used. We have used ARMAX
models for prediction of wind energy in Phase 3 of
DECART system.
Artificial Neural Networks (ANN): ANNs are widely
used along with AR, ARIMA and SARIMA models
for time series forecasting due to their unique
characteristics of not defining any assumption of the
data before training. Due to this significant property,
ANNs can be used for large dataset with greater
accuracy and universal approximations. Single
hidden layer neural networks are generally used for
time series forecasting (Khashei & Bijari, 2010). We
have used ANNs in Phase 2 and 3 of DECART system
time series analysis.
SMARTGREENS 2022 - 11th International Conference on Smart Cities and Green ICT Systems
160
3.2.3 Performance Metrics
The models were validated using performance
metrics such as RMSE and R2 score.
Root Mean Squared Error (RMSE): The Square root
of average squared deviation of forecasted values is
termed as RMSE. This measure gives an overview of
error during forecasting (Chicco et al., 2021). The
mathematical representation of RMSE is as given is
equation (5).
RMSE
y
y
n
5
where:
y
,y
,y
,…,y
: predicted values
y
,y
,y
,…,y
: observed values
n: number of observations
R2 Score: R2 score or the coefficient of
determination is the measure of the variance of the
dependent variable with respect to the independent
variable. In simple words, it is the measure of how
well the prediction values lie on the line of regression
(Wright, S., 1921). R2 score is defined as in equation
(6).
𝑅
1
∑
y
y
∑
y
y
6
where:
y
,y
,y
,…,y
: predicted values
y
,y
,y
,…,y
: observed values
n: number of observations
4 RESULTS AND DISCUSSIONS
This section discusses several evidence-based
insights gained from the data.
4.1 Machine Learning Models for
Carbon Emission Estimation
Phase 1 of the system uses ML models to understand
the mobility patterns in Ireland and factors
contributing towards maximum carbon emission
from road transport.
The increasing emission of carbon can be
addressed by transitioning towards the alternative
options lowering the carbon emissions. One such
alternative is the use of EVs over fuel-based vehicles.
Although the transition towards electric and hybrid
vehicles will be a gradual process, certain behaviours
adopted in society such as recent inclusion of
hydrogen fuelled public transport, and motivating
society towards maximising the usage of e-bikes can
accelerate in lowering levels of carbon emissions.
In order to predict the growth of carbon tax with
the age of the vehicle, we designed a ML model to
estimate the amount of CO2 emitted from a passenger
vehicle from the following details: {manufacturer
name, year of registration, engine capacity}. Dataset
D1 was used for fitting a regression model to predict
the CO2 emitted. After some preliminary
experiments, we found that the best performing
model was random forest regressor with an R2 score
of 0.86 and RMSE of 0.36490. Overtraining was
avoided by diving the dataset into training and testing
sets in the ratio of 75% and 25% respectively. The
ML model will predict the gradual increase in cost of
maintenance which will be directly proportional to
carbon tax calculated according to age of vehicle.
The dataset was cleaned and pre-processed to fill
in the missing values, converting the categorical
variables into numerical ones, followed by
standardisation and scaling. We used K-Nearest
Neighbour Imputer to fill in the missing values. The
highly correlated features were extracted using
correlation matrix with heat maps which led to
important features for training: {year of registration,
manufacturer name and engine capacity}. The
amount of carbon emitted was the predictor feature.
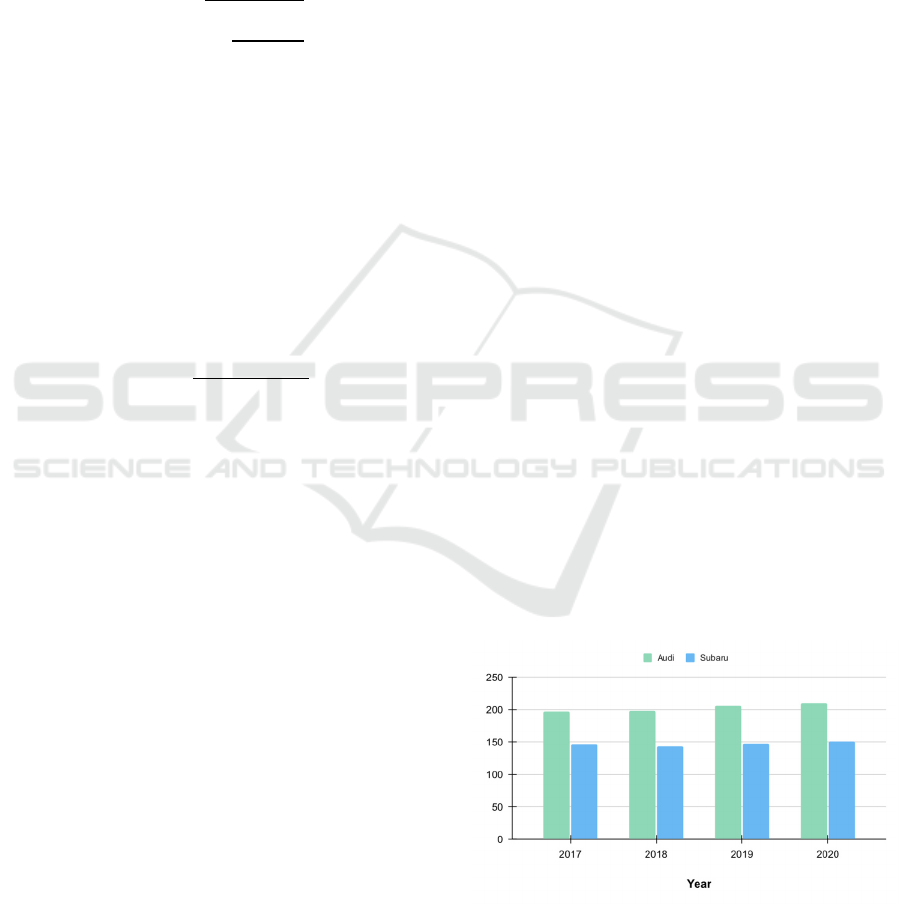
After training the model, we predicted the carbon
emissions for the top two manufacturers in Ireland,
Audi and Subaru for the vehicles registered in 2017
over a period of next 3 years. For Audi vehicles, the
carbon emission increased by 0.7% in one year, but
increased by 3.71% and 2.56% in the following years.
Similarly for Subaru, the carbon emission was neutral
for one year, however, increased by 3.20% and 1.90%
in the next two years as illustrated in Figure 4.
(
a
)
Figure 4: Multivariate regression analysis to predict CO2
emissions for two top manufacturers in Ireland – Audi and
Subaru.
DECART: Planning for Decarbonising Transport Sector with Predictive Analytics - An Irish Case Study
161
The levels of carbon emission for the top two
manufacturers, Audi and Subaru were predicted from
the machine learning model which led to predict the
cost of carbon tax of such vehicles taking into
consideration the amount of co2 emitted from such
vehicles and the fact of increasing at €7.50 per tonne
of CO2 per year over the decade (CO2 Emissions
from Cars: Facts and Figures (Infographics) | News
| European Parliament, n.d.).
4.2 Machine Learning for Predicting
the Growth in Electric and Hybrid
Vehicles
The current trends in buying patterns of EVs and their
expected growth in future was analysed in Phase 2 of
the DECART system. The time span used was daily
registration of electric and hybrid vehicles from 2016
to 2021. After preliminary pre-processing over the
data, it was then used to forecast the growth in electric
vehicles over the next couple of years. We predicted
the growth of electric vehicles with two different
models, SARIMA and ANN. The statistical results of
both the models proved that SARIMA model
performed better over ANN. This may be due to the
fact as the data was only for the last five years, as the
trends in the electric vehicles can only be observed
since 2016. As the data increases in future, the
accuracy of the models can be increased. The ANN
model was designed with simple RNN and 100
epochs with 2 dense layers. Dataset D2 was used for
fitting the model divided in the ratio of 85% and 15%
respectively for training and testing to avoid
overtraining. The performance of ANN model was
less with R2 score of -0.57 and 0.046 as compared to
SARIMA models with a R2 score of 0.49 and 0.79 to
forecast the growth in electric and hybrid vehicles
over the next two years.
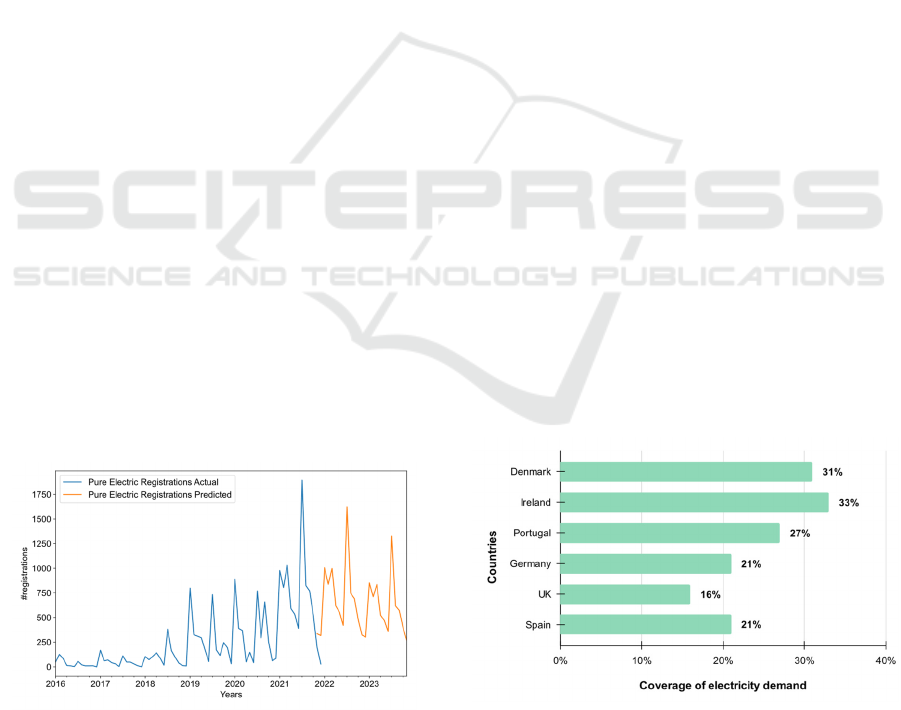
Figure 5: SARIMA Models for growth in electric vehicles.
Figure 5 illustrates the growth of EVs predicted
by the models. The spikes observed at the start and in
the middle of each year in Figure 5 is due to the dual-
registration system followed by the Irish Government
from 2013 (Has Ireland’s Dual Registration Plate
Changed the Way We Buy Cars, n.d.), where
motorists can purchase a brand-new car with new
number series in either January or July.
This dual registration policy has a huge impact on
the distribution of car sales across the year, where
July sales are almost at par with January sales. This
leads to an inevitable drop in car sales in the months
of Nov-Dec, as people prefer buying a new series.
The models were able to capture all such real-world
events. We can predict from the pattern that the
growth in electric and hybrid vehicles will increase
by 54.41% by the end of 2023. This will lead to a high
demand for electricity to charge the electric vehicles
in future. To meet those demands, we can make use
of the energy generated from renewable sources.
4.3 Machine Learning Models for
Predicting Energy from Wind
Farms
The Phase 3 of DECART system calculates the
potential of wind energy as a renewable source to
cope up with the rising demands in electricity.
To understand the capacity of wind energy’s use
in the transportation sector, the graph from Figure 6
illustrates that Ireland compares favourably with its
European Counterparts in generating onshore wind
energy. According to Wind Europe Annual Statistics
2019 (Wind Energy in Europe in 2019, 2018), Ireland
had the highest share of wind in its electricity mix
(33%), followed by Denmark, Portugal and Germany.
Similarly, according to SEAI, (Renewables | Energy
Statistics In Ireland | SEAI, n.d.), electricity
generation in Ireland in 2020, wind energy
contributed to generate 80% of clean energy.
Figure 6: Comparative analysis of potential of on shore
wind generation of Ireland against Europe.
We fitted the Dataset D3 using three different
models- SARIMA, ARMAX and ANN to predict the
SMARTGREENS 2022 - 11th International Conference on Smart Cities and Green ICT Systems
162
amount of energy generated from the Energy Pro
(Welcome to Energy Pro - Specialist Windfarm
Analysts & Managers, n.d.). The dataset was divided
into 70% and 30% respectively for training and
testing purposes. The experiments showed that ANN
model performed better among the three. Hence, we
then predicted the daily energy generated from one of
the five plants given the information about the energy
generated every 10 mins. The model used the data for
energy generated for every 10 minutes in the last 24
hours and predicted the energy generation in the next
24 hours of the day.
After training the model, the results show that the
average cumulative energy generated in 24 hours or
1440 minutes is 5809 KWh. The average
consumption of electric is 65.26KWh for every 337.8
km(Compare Electric Vehicles - EV Database, n.d.),
then we can safely say that a single plant can source
around 89 electric cars in 24 hours.
According to Wind Energy Ireland (Facts &
Stats, n.d.), there are 300 wind farms in Ireland.
Considering this number, all the 300 wind farms
have the potential to source the transport sector can
be powered through clean energy by utilising wind
farms to power 26,700 electric vehicles in a single
day. Hence, wind farms can play a significant role in
the decarbonisation of the transport sector.
The following Table 2 shows the statistical
analysis of the models used for training the datasets
and their results. The best results are highlighted in
bold.
Table 2: Comparative Analysis of the ML models.
Abbreviations used for Dataset D2 are Electric Vehicles
(EV) and Hybrid Vehicles (HV).
Dataset Model Name R2 Score RMSE
D1
Random Forest
Regresso
r
0.86 0.36490
D2
SARIMA
0.49 (EV)
0.79 (HV)
-
ANN
-0.43(EV)
0.60(HV)
549.37(EV)
1385.75(HV)
D3
ARIMA 0.916 57.69
ARMAX 0.67 52.41
ANN 0.918 25.48
5 CONCLUSIONS AND FUTURE
SCOPE
In this research work, we performed an in-depth
analysis on the current emission levels in the transport
sector in Ireland. Regression and time-series
forecasting models were designed on real -world
datasets. Through ML models we were able to gain
critical and hidden insights on the mobility and
behaviour patterns in the transportation sector.
Furthermore, to achieve the ambitious plans of zero
emissions in transportation, we discussed that clean
energy, majorly sourced through wind farms, can be
used to meet the electricity requirements of the rise in
electric cars growth. Future scope of this article
suggests case studies on other potential renewable
energy sources with less or zero carbon emissions for
achieving the goal of decarbonising transport in
Ireland. Other aspects of future scope involve making
the models dynamic to adapt to the changing trends
in the transport sector as well as tuning and refining
the hyperparameters of the machine learning models
with Grammatical Evolution. Finally, we conclude
that decarbonising transportation will highly impact
societies and communities, leading to improved air
quality, lower noise levels, less waste in form of
emissions and thus hugely contributing towards better
health and wellbeing. Similarly, with innovation in
battery life of EVs may lead towards widespread
acceptance of electric vehicles in near future.
ACKNOWLEDGEMENTS
This work is supported by Science Foundation Ireland
grant #16/IA/4605.
REFERENCES
Agwata Nyamato, F., Wanjoya, A., & Mageto, T. (2020).
Comparative Analysis of Sarima and Setar Models in
Predicting Pneumonia Cases in Kenya. International
Journal of Data Science and Analysis, 6(1), 48.
https://doi.org/10.11648/J.IJDSA.20200601.16
Box, G. E. P. (1989). An Unexpected Route to Time Series.
Breiman, L. (2001). Random Forests. Machine Learning
2001 45:1, 45(1), 5–32. https://doi.org/10.1023/
A:1010933404324
Chicco, D., Warrens, M. J., & Jurman, G. (2021). The
coefficient of determination R-squared is more
informative than SMAPE, MAE, MAPE, MSE and
RMSE in regression analysis evaluation. PeerJ
Computer Science, 7, 1–24.
https://doi.org/10.7717/PEERJ-CS.623/SUPP-1
CO2 emissions from cars: facts and figures (infographics)
| News | European Parliament. (n.d.). Retrieved
January 27, 2022, from https://www.europarl.
europa.eu/news/en/headlines/society/20190313STO31
218/co2-emissions-from-cars-facts-and-figures-
infographics
Compare electric vehicles - EV Database. (n.d.). Retrieved
January 27, 2022, from https://ev-database.org
DECART: Planning for Decarbonising Transport Sector with Predictive Analytics - An Irish Case Study
163

de Blas, I., Mediavilla, M., Capellán-Pérez, I., & Duce, C.
(2020). The limits of transport decarbonization under the
current growth paradigm. Energy Strategy Reviews, 32,
100543.https://doi.org/10.1016/J.ESR.2020.100543
Dublin unveils three new hydrogen fuel cell buses -
Intelligent Transport. (n.d.). Retrieved March 8, 2022,
from https://www.intelligenttransport.com/transport-
news/126719/dublin-hydrogen-buses/
Electric Cars & Electric Vehicles (EV) In Ireland | SEAI.
(n.d.). Retrieved January 27, 2022, from
https://www.seai.ie/technologies/electric-vehicles/
Electricity | Energy Statistics In Ireland | SEAI. (n.d.).
Retrieved January 27, 2022, from https://www.seai.ie/
data-and-insights/seai-statistics/key-statistics/
electricity/
Facts & Stats. (n.d.). Retrieved January 28, 2022, from
https://windenergyireland.com/about-wind/facts-stats
Fu, P., Pudjianto, D., Zhang, X., & Strbac, G. (2019).
Evaluating Strategies for Decarbonising the Transport
Sector in Great Britain. 2019 IEEE Milan PowerTech,
1–6. https://doi.org/10.1109/PTC.2019.8810865
Gota, S., Huizenga, C., Peet, K., Medimorec, N., & Bakker,
S. (n.d.). Decarbonising Transport to Achieve Paris
Agreement Targets. Retrieved January 27, 2022, from
https://link.springer.com/article/10.1007%2Fs12053-
018-9671-3
Gunawan, T. A., Williamson, I., Raine, D., & Monaghan,
R. F. D. (2021). Decarbonising city bus networks in
Ireland with renewable hydrogen. International
Journal of Hydrogen Energy, 46(57), 28870–28886.
https://doi.org/https://doi.org/10.1016/j.ijhydene.2020.
11.164
Has Ireland’s dual registration plate changed the way we
buy cars? (n.d.). Retrieved January 27, 2022, from
https://startmonday.ie/blog/ireland-dual-registration-
plate
Hornik, K., Stinchcombe, M., & White, H. (1989).
Multilayer feedforward networks are universal
approximators. Neural Networks, 2(5), 359–366.
https://doi.org/10.1016/0893-6080(89)90020-8
John, °, & Cochrane, H. H. (1997). Time Series for
Macroeconomics and Finance.
Khashei, M., & Bijari, M. (2010). An artificial neural
network (p,d,q) model for timeseries forecasting.
Expert Systems with Applications, 37(1), 479–489.
https://doi.org/https://doi.org/10.1016/j.eswa.2009.05.
044
Kshirsagar, M., Lahoti, R., More, T., & Ryan, C. (n.d.).
GREECOPE: Green Computing with Piezoelectric
Effect. https://doi.org/10.5220/0010445801640171
Kshirsagar, M., More, T., Lahoti, R., Adgaonkar, S., Jain,
S., Ryan, C., & Kshirsagar, V. (2021). GREE-COCO:
Green Artificial Intelligence Powered Cost Pricing
Models for Congestion Control. ICAART 2021 -
Proceedings of the 13th International Conference on
Agents and Artificial Intelligence, 2, 916–923.
https://doi.org/10.5220/0010261209160923
Monitoring of CO2 emissions from passenger cars –
Regulation (EU) No 631/2019 — European
Environment Agency. (n.d.). Retrieved January 27,
2022, from https://www.eea.europa.eu/data-and-
maps/data/co2-cars-emission-16
Nouni, M. R., Jha, P., Sarkhel, R., Banerjee, C., Tripathi,
A. K., & Manna, J. (2021). Alternative fuels for
decarbonisation of road transport sector in India:
Options, present status, opportunities, and challenges.
Fuel, 305, 121583. https://doi.org/10.1016/J.FUEL.
2021.121583
Renewables | Energy Statistics In Ireland | SEAI. (n.d.).
Retrieved January 27, 2022, from https://www.seai.ie/
data-and-insights/seai-statistics/key-statistics/
renewables/
Schneider, A., Hommel, G., & Blettner, M. (2010). Linear
Regression Analysis. Deutsches Arzteblatt, 107(44),
776–782. https://doi.org/10.3238/ARZTEBL.2010.
0776
SIMI Motorstats - the complete online vehicle index for
Ireland | Stats. (n.d.). Retrieved January 27, 2022, from
https://stats.beepbeep.ie/
Summary by gas | Environmental Protection Agency. (n.d.).
Retrieved January 27, 2022, from https://www.epa.ie/
our-services/monitoring--assessment/climate-
change/ghg/summary-by-gas/#d.en.84356
Tang, W. K., Wong, Y. K., & Fung, E. H. K. (2000).
Simulations of ARMA and ARMAX Models for a
Machining Process.
The challenge of decarbonizing heavy transport samantha
gross executive summary. (2020).
Transport | Energy Statistics In Ireland | SEAI. (n.d.).
Retrieved January 27, 2022, from https://www.seai.ie/
data-and-insights/seai-statistics/key-statistics/transport/
Welcome to Energy Pro - Specialist Windfarm Analysts &
Managers. (n.d.). Retrieved January 27, 2022, from
https://www.energypro.ie/
What is the carbon tax? | bonkers.ie. (n.d.). Retrieved
January 27, 2022, from https://www.bonkers.ie/
guides/gas-electricity/what-is-carbon-tax/
Wind energy in Europe in 2019. (2018).
Wright, S. (1921) Correlation and Causation. Journal of
Agricultural Research, 20, 557-585. - References -
Scientific Research Publishing. (n.d.). Retrieved
January 27, 2022, from https://www.scirp.org
SMARTGREENS 2022 - 11th International Conference on Smart Cities and Green ICT Systems
164
