
Performance Testing Guide for IoT Applications
Liana M. Carvalho
∗ a
, Val
´
eria Lelli
b
and Rossana M. C. Andrade
c
Group of Computer Network, Software Engineering and Systems - Federal University of Cear
´
a - Fortaleza, Brazil
Keywords:
Internet of Things, Software Testing, Performance Testing, Guidelines.
Abstract:
Internet of Things (IoT) applications are characterized by the use of smart objects that are connected to the
Internet to provide different types of services. These objects usually generate data that need to be stored
and analyzed to contribute to decision making (whether or not they are immediate). In this context, such
applications may require high performance, low cost and good scalability. These requirements bring new
testing challenges and the need for specific approaches, for example, the detection of performance failures
among heterogeneous IoT devices, which process a large amount of data and, under uncertain conditions, must
have their resources optimized. Thus, our goal is to propose a performance testing guide for the evaluation
of IoT applications. To build the guide, we performed a literature review to identify the IoT standards and
analyzed IoT bug repositories. In this paper, we present the Performance Testing Guide for IoT applications.
To validate the proposed guide, we conducted two evaluations: (i) an evaluation with the experts; and (ii)
a controlled experiment. The results showed that the guide provides a systematization of testing activities,
helping the evaluation of IoT aspects intrinsic to performance.
1 INTRODUCTION
The Internet of Things (IoT) may be characterized as
smart objects connected to the internet to provide ser-
vices and to achieve common goals. The IoT environ-
ment is heterogeneous with interactions between sev-
eral different devices, for example, to promote smart
cities and cars, better traffic organizations, improve-
ments in agriculture and healthcare (Amalfitano et al.,
2017). IoT interactions can be performed with a user
(called human-thing interactions) or between devices
(called thing-thing interactions) to provide a service
(Andrade et al., 2017).
One aspect that distinguishes the traditional from
IoT systems is the performance of IoT environment,
which involves the communication of applications
from various domains, with different hardware, pro-
tocols and storage capacity. In this context, ensur-
ing the quality of IoT applications requires from soft-
ware engineers to be aware of the IoT characteristics
(e.g., Interoperability, Heterogeneity) that must be
validated and the domain in which an IoT application
a
https://orcid.org/0000-0003-4582-6765
b
https://orcid.org/0000-0002-1210-7935
c
https://orcid.org/0000-0002-0186-2994
∗
Master Researcher scholarship - sponsored by FUN-
CAP - 10/2018
will operate. Moreover, the IoT characteristics bring
challenges for testing activity and require specific ap-
proaches, e.g., for detecting failures regarding hetero-
geneous IoT devices (Tappler et al., 2017), which pro-
cess a large amount of data and, under certain condi-
tions, should have their resources optimized.
A few studies, however, present systematic solu-
tions to deal with these kinds of problems. System-
atic mapping studies regarding IoT testing (Carvalho,
2018) (Cort
´
es et al., 2019) have shown which kinds of
testing techniques have been adopted and which kinds
of challenges have been faced for the testing commu-
nity. The IoT testing is pointed out as being poorly
standardized with few approaches looking at the par-
ticularity of IoT characteristics - the Performance is
the top three characteristic with challenges to be faced
(Carvalho, 2018).
The challenges of performance testing for IoT
concern: the processing of real time operations given
the limitations of the network and the large data vol-
ume; the lack of standardization of IoT protocols
(e.g., COAP, MQTT and DHCP); the high cost of IoT
testing in real environments; and the external environ-
ment that may affect the performance (Sand, 2015).
In this sense, it is essential to ensure fast re-
sponses, availability, and instant connections, which
becomes essential in IoT testing. Therefore, given the
Carvalho, L., Lelli, V. and Andrade, R.
Performance Testing Guide for IoT Applications.
DOI: 10.5220/0011090800003179
In Proceedings of the 24th International Conference on Enterprise Information Systems (ICEIS 2022) - Volume 1, pages 667-678
ISBN: 978-989-758-569-2; ISSN: 2184-4992
Copyright
c
2022 by SCITEPRESS – Science and Technology Publications, Lda. All rights reserved
667

challenges and the gaps identified in IoT testing and
the relevance of Performance for this area, this work
proposes a guide to assist the performance testing of
IoT applications.
In this paper, we investigate the following research
questions (RQ):
RQ1. How should the IoT testing process be orga-
nized?
RQ2. How to evaluate the performance characteristic
in IoT applications?
We have conducted two evaluations to validate the
guide: (i) from the experts’ point of view; and (ii) a
controlled experiment using the guide.
The evaluation results have been satisfactory,
showing that the guide brings excellent benefits in
helping the testing of the performance of IoT appli-
cations and in identifying failures specific in this do-
main. Also, the structure of the guide itself provides
a systematization of testing activities and it can be
adapted to evaluate other IoT characteristics.
The remainder of this paper is organized as fol-
lows. Section 2 presents the performance testing and
its main differences for IoT. In the Section 3, we
present the testing guide for the Performance. Sec-
tion 4 presents the guide evaluation and results. The
results are discussed in Section 5 and the threats to va-
lidity are presented in Section 6. Finally, the related
work in Section 7 and the final remarks in Section 8
are presented.
2 PERFORMANCE TESTING
According to ISO 25010 (ISO 25010:2011, 2011), the
Performance characteristic is divided into three sub-
characteristics. The Temporal Behavior subcharacter-
istic evaluates whether a product’s response rate and
processing time meet requirements. The Resource
Utilization checks whether the quantity and types of
resources used, meet requirements. The Capacity val-
idates the maximum to which the parameters and re-
sources of a system meet the requirements.
The evaluation of the performance of IoT systems
involves validating the individual behavior of appli-
cations in an end-to-end context. This validation re-
quires the creation of a test environment with param-
eters or properties that suit the specific circumstances
of IoT devices when they interact with each other on
the network. The interactions may occur in situations
where the devices should have, for example, a mini-
mum expenditure of energy and, based on this infor-
mation, the hardware resources (e.g., memory) should
be optimized to increase their performance. Thus, the
evaluation of performance requires a more elaborate
verification and validation plan, for example, to define
indicators and measures that evaluate IoT applications
in the end-to-end context, and developing tools that
make possible such measurement (Brady et al., 2017)
(Dahmann et al., 2010).
There exist several differences between traditional
and IoT applications. The first one concerns the sim-
ulations, they usually involves end users to validate
traditional applications, while in IoT simulations, de-
vices must also be validated, the thing-thing interac-
tion in the environment, where a device, like a TV,
communicates with a curtain, for example. Another
difference concerns the sending and receiving of data.
In traditional applications a large volume of data is
sent and received per request, in IoT applications the
minimum of data is sent and received per request, but
the transition of information occurs continuously. Re-
garding the protocols, there is still no consensus on
the protocols to be used in IoT, the most used proto-
cols to facilitate the IoT communication (for exam-
ple, data exchange) are MQTT and COAP (Mehedi,
2019). However, several other protocols, such as Zig-
bee, have been adapted for IoT applications, generat-
ing a non-standardization that further affects the val-
idation of IoT applications. Additionally, the use of
different protocols without standardization makes it
difficult to read the requests and answers received,
since the message exchange process of each protocol
is different. For such reasons, several challenges have
been faced in the performance testing of IoT systems.
Another difference concerns the business value.
To evaluate IoT characteristics is necessary to under-
stand the business value of the product and perform
a validation in the real environment in which the data
transits (Gurijala, 2018). In this case, it is necessary
to know the infrastructure of each application that will
be part of the IoT network such as their connections
and operations. For example, a smart home environ-
ment where a TV communicates with a curtain re-
quires the verification of: (i) what kind of sensors
are present in the devices; (ii) their kind of commu-
nication; and (iii) what time the devices must act to
be synchronized and therefore the operation is per-
formed without delay.
3 TESTING GUIDE FOR IOT
The testing guide was built in two main steps: (i) elab-
oration of the IoT testing guide’s structure and then
(ii) the instantiation of this guide for the Performance
characteristic by filling out the guide’s sections ac-
cording to the performance information.
The proposed guide’s structure is generic and thus
ICEIS 2022 - 24th International Conference on Enterprise Information Systems
668

can be adapted for testing other IoT characterisitcs.
The methodology for building the guide consisted of
the literature review by using a search string; the anal-
ysis of bug repositories of IoT applications; the anal-
ysis of the studies obtained from the literature review;
and the construction of the initial guide structure.
In the literature review, we have identified 26
studies
1
such as standards and guides related to IoT
testing. In parallel to the analysis of these studies, we
analyzed bug repositories of IoT applications avail-
able on GitHub
2
.
Based on the above methodology, we built the ini-
tial guide structured in 11 sections as follows: Defini-
tion of the IoT Characteristic (s1) that will be tested;
the Correlation of Characteristics (s2) between the
target characteristic and the others; the Configuration
of the test environment (s3) required to test the char-
acteristic; the Definition of Subcharacteristics (S4) re-
lated to the target characteristic; the Contextualiza-
tion (s5) to describe the properties related to the char-
acteristic and its subcharacteristics; the Abstract Test
Cases (s6) to guide the tests of the target character-
istic and its subcharacteristics; the Measurement (s7)
to evaluate the target characteristic and its subcharac-
teristics; the Impact of the subcharacteristics (s8) be-
tween the subcharacteristics based on the properties
of s5; the Cost-Benefit (s9) to conduct the tests based
on the correlations of s2; the Tools Suggestions (S10)
to automate the measurement collection of the target
characteristic; and the Example of Guide Use (s11).
We have used such structure to instantiate the guide
for Performance characteristic.
In the next section we present the instantiation and
the overview of the Performance Testing Guide.
3.1 Instantiation for Performance
Motivated by the relevance of Performance in the IoT
domain and by the challenges (Gurijala, 2018) (Sand,
2015), we chose to instantiate the first version of the
guide for this characteristic. The approach for instan-
tiating followed six activities as shown in Figure 1.
As a first step, we performed the literature review
for performance characteristic focusing on the IoT
performance testing. The search string is presented in
the Table 1 and it was executed in the Scopus, IEEE,
ACM and Science Direct databases. The studies that
formed the basis of the guide were selected based on
the guidelines of a systematic mapping (Kitchenham,
2004), in which we defined a search string to extract
the papers and selected them according to the inclu-
sion/exclusion criteria in two-steps by abstract read-
1
String and studies:https://tinyurl.com/5n99e5me
2
https://tinyurl.com/ytezaw8c
ing and full paper reading. From the execution of this
string, we extracted 592 studies and selected 32 as il-
lustrated in Table 2.
Table 1: The search string for the Performance Review.
(“internet of things”) AND (“performance test”
OR “performance testing” OR “load testing” OR
“load test” OR “stress testing” OR “stress test” OR
“workload testing” OR “workload test”)
Table 2: Overview of studies of the Performance Review.
Search Sources Extracted
Studies(#)
Selected
Studies(#)
ACM 157 6
IEEE 53 5
Science Direct 134 1
Scopus 248 20
Overall 592 32
In addition to the 32 studies, 9 studies from other
sources were selected since they discuss performance
in other domains related to IoT, such as mobile appli-
cations. All selected studies are available on the IoT
Testing Performance repository
3
.
The second activity is to extract data from the se-
lected studies. We performed the complete reading
of the 41 papers and extracted the data related to the
Performance.
The third activity is to analyse and structure
the data for the subcharacteristic. We first analyse
whether a characteristic is divided into subcharacter-
istics. If a characteristic has subcharacteristics, this
activity is conducted, otherwise, we perform the next
activity related to the characteristic itself. In the case
of Performance, it can be divided into three subchar-
acteristics as we presented in Section 2 and thus we
first analyzed their data. Our goal is to first analyse
and organize the data of the guide sections specific to
the subcharacteristics, such as the definition (s4) and
contextualization (s5) of subcharacteristics, abstract
test cases (s6) and measurement (s7). For example, if
a metric related to the subcharacteristic (e.g., Tempo-
ral Behavior) is identified, it is extracted to the section
Measurement. We started to fill in the guide sections
for the subcharacteristics since it helped us to better
understand the characteristic itself.
To structure the data of Performance subcharacter-
istics, we analyzed and selected the data extracted in
the previous activity to provide the artifacts required
to complete the sections regarding the subcharacteris-
tics. Then, the guide sections of the subcharacteristics
are based on the following artifacts: (1) list of the defi-
3
https://tinyurl.com/29nm8j83
Performance Testing Guide for IoT Applications
669
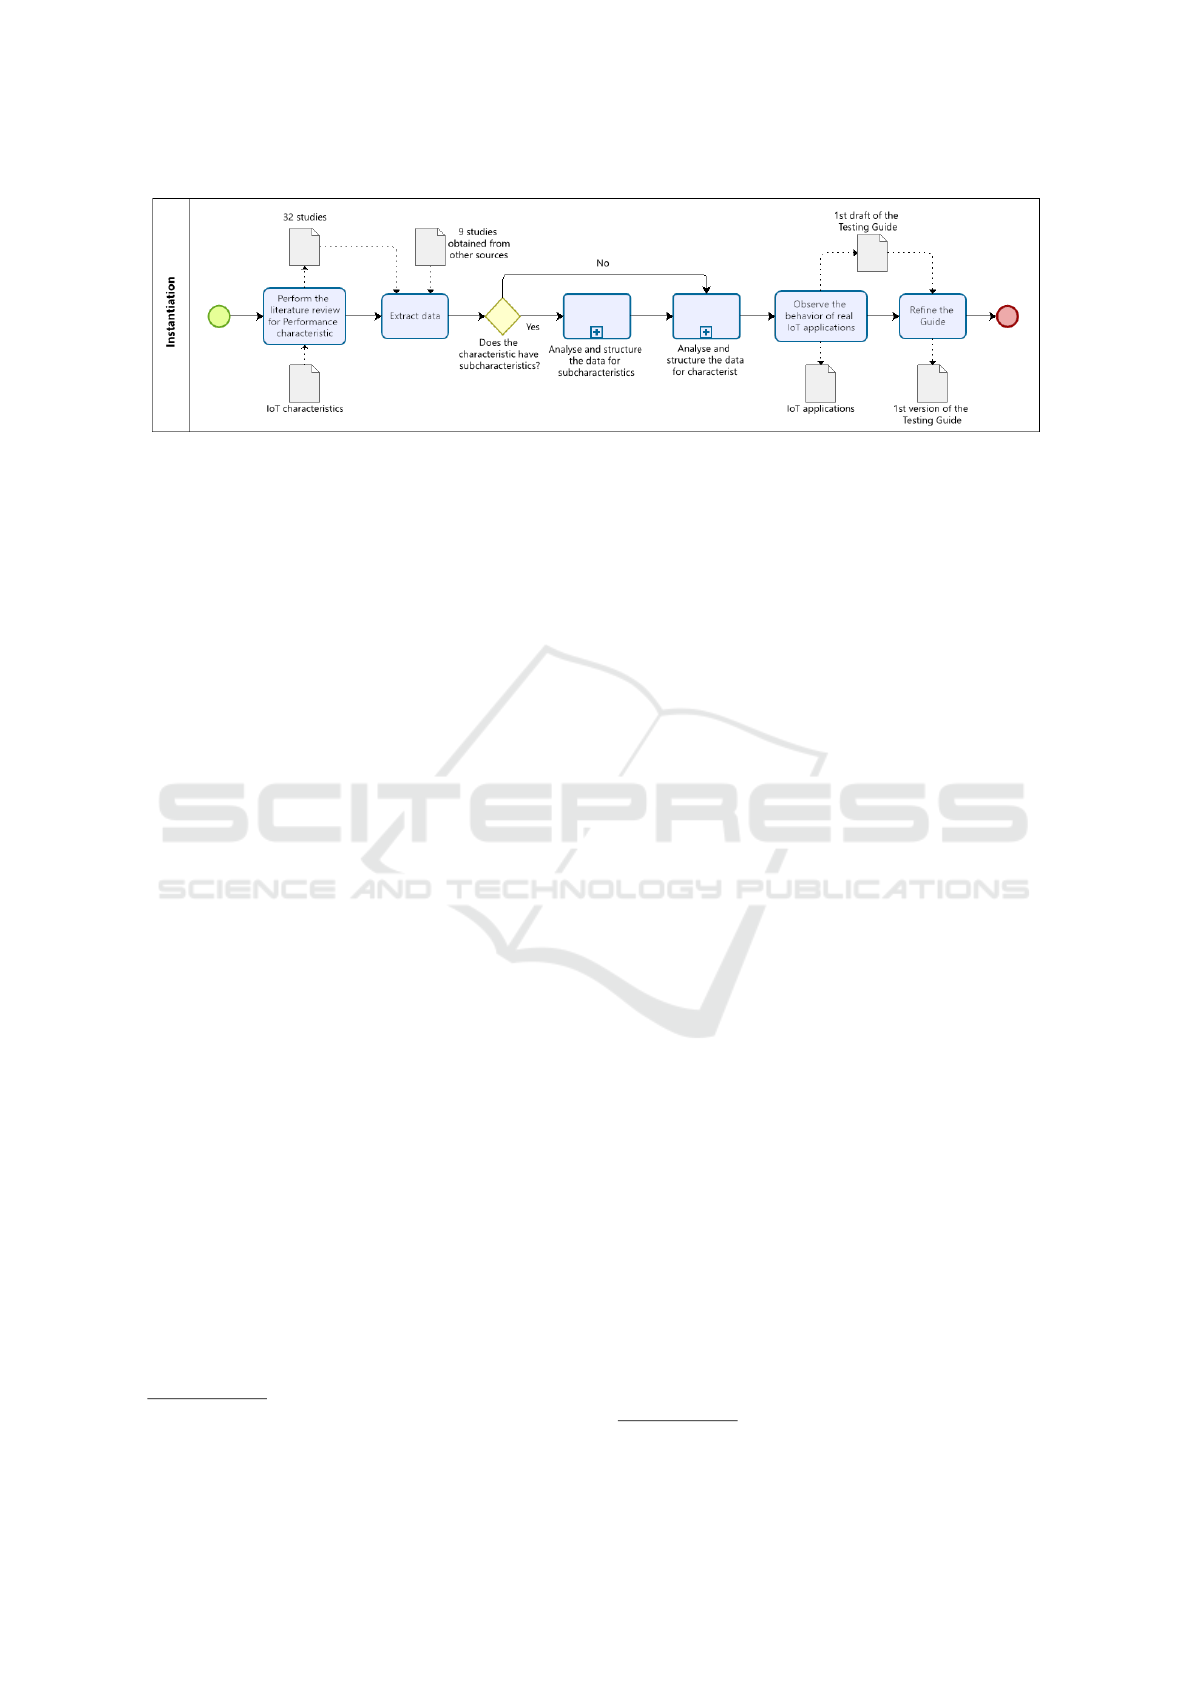
Figure 1: Approach to build the Performance Testing Guide.
nitions of subcharacteristics; (2) list of properties that
characterizes the Performance, each subcharacteris-
tic is related to a set of properties that define it (e.g.,
Temporal Behavior is the response and reconnection
time of an application); (3) specification of abstract
test cases to cover subcharacteristics and their prop-
erties; (4) list of metrics to support the validation of
the Performance, each metric is analyzed considering
the definition, properties and abstract test cases; and
(5) the impact of the Performance subcharacteristics,
the correlations are identified from the properties, ab-
stract test cases and metrics and, thus, the impact that
each subcharacteristic has on the other is defined.
The first four artifacts were obtained from data ex-
tracted of the 41 studies. The last artifact (5) was built
based on these artifacts. Thus, the guide sections, s4,
s5, s6, s7 and s8 were filled in from the five artifacts.
The fourth activity is to analyse and structure
the data for the characteristic. Once all information
about the Performance subcharacteristics is provided,
we focus on the sections regarding the characteristic:
s1, s2, s3, s9, s10 and s11. The sequence of activities
is similar to the subcharacteristics. So, the remainder
guide sections regarding the characteristic were based
on the following six artifacts: (1) list of the definitions
of Performance; (2) list of the characteristics corre-
lated to Performance; (3) catalog of tools that are used
to conduct the Performance Testing; (4) formula pro-
posed to calculate the cost-benefit; (5) description of
the IoT environment required to test the Performance
characteristic; and (6) an example of use of the Test-
ing Performance Guide.
The fifth activity is to observe of the behavior of
real IoT applications. To conduct this activity, we
selected two IoT applications: the Smart vegetable
garden
4
and the Smart Watch
5
. The first application
has as a primary function of watering a vegetable gar-
den, so whenever the humidity sensor detects the user-
defined limit value, the actuator performs its watering
4
https://tinyurl.com/5xjrpzkx
5
https://tinyurl.com/7pv3avdk
task. In the second application, a smart watch was
evaluated, more specifically the “exercise” function.
The watch sends a notification to a user performs a
stretching exercise when she remains inert; if the user
does the exercise, the watch captures the time of its
movement and stores it. At the end of the day, the ap-
plication provides the total time that the user has ex-
ercised. Both applications were evaluated by a testing
perspective. From the evaluations, we identified test
scenarios that were not yet being covered in the previ-
ous test cases and thus the information was added. For
example, during the analysis of the studies we have
identified a test case that should validate the informa-
tion that is sending to an actuator. However, when we
observed the real IoT applications, we also identified
other test cases, for example, a test case to validate the
actuator behavior when the application sends many
requests in a peak time. At the end of this activity,
the first draft of the Performance Testing Guide was
provided. The new test cases generated from the pre-
vious activity were added in the guide. However, the
guide was refined and some sections were updated to
avoid inconsistencies. For example, when we want
to test the “Resource Utilization” subcarachteristic an
energy meter may be required, so we have added 2
test cases to cover such test and updated the informa-
tion in the Configuration of the test environment sec-
tion (s3). The output artifact is the first version of the
Performance Testing Guide
6
.
3.2 Overview of the Performance Guide
The Performance Testing Guide
6
is organized in 10
sections. Once Performance has three subcharacter-
istics, we prefer to present the information about the
definitions, contextualization, abstract test cases and
measurements of a subcharacteristic as subsections
instead of sections as we presented in the beginning of
Section 3. We also provide two introductory sections.
The first one is About Guide. In this section we ex-
6
Available on: https://tinyurl.com/3zkhveyz.
ICEIS 2022 - 24th International Conference on Enterprise Information Systems
670

plained the goals of the guide, how it is structured and
an overview about the IoT environment. The second
is Instructions for using the Guide, where we present
the general instructions as a roadmap to facilitate the
use of the guide. The other sections refer the Perfor-
mance characteristic and its subcharacteristics as we
describe below.
3.2.1 Performance Definitions
The Testing Guide presents, in Section 1 (s1), five
definitions of the Performance characteristic that we
extracted through the literature review, for example,
“Performance is the time taken to perform a service,
the rate at which the service is performed, and the
resources consumed while performing the service.”
(Jain, 1991). The definitions help the users to under-
stand the Performance characteristic explored by the
testing guide in the context of IoT applications.
3.2.2 Correlation of Characteristics
In Section 2 (s2), the guide presents 19 characteris-
tics correlated to the Performance. These correlations
is divided into positive correlations, whose a char-
acteristic influences performance in a positive way;
negative correlations that are the opposite; and cor-
relations that can be positive or negative depending
on the context in which they occur. For example, the
Availability characteristic may have a positive influ-
ence on the Performance - if there are enough servers
to supply a demand and, thus, speeding up the mes-
sage exchange process; otherwise may have a nega-
tive influence. These correlations help us to under-
stand possible requirements conflicts that may exist
in IoT applications.
3.2.3 Configuration of the Test Environment
Section 3 (s3) refers to the environment configuration
required for testing IoT applications, for example, it
can be composed of one or more sensors; one or more
actuators; an application; and an energy meter for en-
abling the test cases of the Resource Utilization.
3.2.4 Subcharacteristics
Sections 4, 5 and 6 of the guide concern the sub-
characteristics Temporal Behavior, Resource Utiliza-
tion and Capacity, respectively. The subsections 4(a),
5(a) and 6(a) (equivalent to s4) provide the Defini-
tions for each subcharacteristic, all definitions are ex-
tracted from ISO 25010. For example, the Temporal
Behavior is “the level to which the response and pro-
cessing time and transfer rates of a product or sys-
tem, when performing its functions, meet the require-
ments”. The Resource Utilization is “the degree to
which the quantities and types of resources used by a
product or system, when performing their functions,
meet the requirements”. The Capacity is “the de-
gree to which the maximum limits of a product or
system parameter meet the requirements”. Similarly,
the Contextualization of the aforementioned subchar-
acteristics is presented in subsections 4(b), 5(b) and
6(b) (equivalent to s5) if the guide. These subsections
present the properties obtained from the literature re-
view that represent each subcharacteristic. Table 3
gives an overview of the subcharacteristics and their
properties. The guide presents eight properties for the
Temporal Behavior and Resource Utilization, and six
properties for the Capacity.
Table 3: Subcharacteristics and their properties.
Subcharacteristic Property
Temporal
Behavior
Dispatch Time, Execution
Time, Message Transmission
Time, Minimum Waiting
Time, Reconnection Time,
Response Time, Loading
Time and Adaptation Time
Resource
Utilization
CPU availability, CPU
consumption, Energy Con-
sumption, Energy Efficiency,
Memory Consumption, En-
ergy Saving, Usage Time and
Data Consumption
Capacity Download/Upload Rate,
Throughput, Message Size,
Network Usage and Band-
width.
The guide subsections 4(c), 5(c) and 6(c) (equiva-
lent to s6)provide the Abstract test cases for each sub-
characteristic. A total of 23 abstracts test cases have
been specified for the three Performance subcharac-
teristics: 11 test cases for Temporal Behavior, 8 for
Resource Utilization and 4 for Capacity. The struc-
ture of the test cases is presented in Table 4. The title
refers to the intention of a test case. The test environ-
ment indicates the type of the configuration of devices
required to test execution. The precondition concerns
the state required for a test execution. The step by step
provides instructions for a test and the post-conditions
indicate the state achieved after the execution of a test.
In addition, the abstract test cases can be related to
sensors or actuators or application. Table 4 shows an
example related to actuators for Temporal Behavior.
The guide also provides 22 metrics selected from
the literature to assist in the performance validation -
8 metrics for Temporal Behavior, 12 metrics for Re-
Performance Testing Guide for IoT Applications
671

Table 4: Example of a test case for the Temporal Behavior.
Test case 02 - TCO2
Title Send command to actuator via ex-
ternal network
Environment N actuators and 1 application
Precondition The actuator must be able to re-
ceive the command, the applica-
tion must be on a network outside
the local network
Step by step
1 - In the application, send the
desired command;
2 - Check actuator behavior.
Postconditions The actuators executed the com-
mand sent
source Utilization and 2 metrics for Capacity, they
are presented in guide subsections 4(d), 5(d) and 6(d)
(equivalent to s7), respectively. The metrics are struc-
tured in the guide as shown in Table 5. The structure
contains the purpose of the metric; the method used
to apply the metric; the measure to perform the mea-
surement; and the bibliography reference from which
the metric was extracted. The guide provides at least
one metric for evaluating a properties presented in
Table 3. For example, the Adaption Time must be
used to measure the Adaptation Time (P1) property
of the Temporal Behavior whereas the CPU Avail-
ability (P9), CPU Consumption P10 and Usage Time
(P15) properties of Resource Utilization must be eval-
uated by using the three metrics regarding the CPU
consumption, which are: CPU Consumption in Stand
by; CPU consumption at peak and Average CPU Con-
sumption.
Moreover, the abstract test case illustrated in Table
4 can be used to perform the measurement of the P1,
P9, P10 and P15 properties. All possible mapping
among properties, metrics and abstract test cases is
provided in the Appendix B of the guide.
Table 5: Example of a metric for the Temporal Behavior.
Adaptation Time - M08
Purpose Evaluate the time in which the app
adapts to a new state of the environment.
Method It counts the time when there is a change
in the state of the environment and com-
pares it to the time after the application
is adapted.
Measure
X = t2 −t1
X = adaptation time
t1 = time right after receiving a new state
t2 = time after adaptation of the app
Reference (Zhang et al., 2018) (Lu et al., 2000)
3.2.5 Impact of Subcharacteristics
Section 7 of the guide presents the impacts between
the subcharacteristics according to their properties.
For example, the property “Response Time” of the
subcharacteristic of Temporal Behavior is impacted
by the property “CPU Consumption” of the subchar-
acteristic of Resource Utilization, because if CPU
consumption is too high, the processing of the infor-
mation to send the response will be high.
3.2.6 Cost-benefit
The cost-benefit is presented in Section 8 of the guide.
The goal is to define the priority of the tests and met-
rics. Based on the correlation of one characteristic
with the others, presented in the Correlation of Char-
acteristics (Section 2 of the guide), it is possible to
define the impact that a characteristic has on applica-
tions. We have proposed a formula to calculate the
cost benefit as follows: CI =ORC/RC, where ORC is
the number of performance correlated characteristics
prioritized in the application and RC is the total num-
ber of performance-related characteristics.
When the impact (CI) is related to the effort in
executing the tests and metrics, it generates the cost
benefit that can help in prioritizing the tests. This
prioritization is presented through groups: Group I:
high effort and low impact. High cost and low benefit
= low priority; Group II: low effort and low impact.
Low cost and low benefit = medium priority; Group
III: high effort and high impact. High cost but high
benefit = high priority; and Group IV: low effort and
high impact. Low cost and high benefit = very high
priority. In the guide we provide all the steps to cal-
culate the cost-benefit.
3.2.7 Tools Suggestion
Section 9 of the guide is the Tool Suggestions. We
have cataloged seven tools
7
to help in the perfor-
mance testing, they are: iFogSim, Neotys, Wire-
shark, LoadUIPro, IoTIFY, Tcpdump and SOASTA.
The iFogSim (Gupta et al., 2017) tool is an open-
source simulator that simulates IoT devices and per-
forms measurements such as sending message time,
network delays and network congestion. The guide
provides all information for the tools such as a de-
scription, the method (e.g., white or black box), the
test environment (e.g., a simulator to reproduce a real
environment, or a web platform to help the metrics
colletion) required to run a test (local or remote) and
the type of license (e.g., open source).
7
All links for the mentioned tools are available in Sec-
tion 9 of the Guide
6
ICEIS 2022 - 24th International Conference on Enterprise Information Systems
672

3.2.8 Example of Guide Use
The last section of the guide is Section 10 that pro-
vides a step-by-step based on an example of a IoT
scenario. The example is a smart garden that we used
in the construction of the guide (see 3.1), it has a sen-
sor that monitors the humidity of the environment; an
actuator being an intelligent socket that is used to turn
on and off the water pump and an application that
manages these smart objects. This environment al-
low us to demonstrate the evaluation by following the
steps provided in this guide section.
3.3 Wiki
The guide is organized in sections to facilitate the per-
formance testing of IoT applications. However, we
have created a Wiki
8
to automate the guide usage.
This Wiki focuses on the Performance characteristic
and covers all guide sections presented in Section 3.2.
In the Wiki, the guide user can select the characteris-
tic and its subcharacteristics, for each one the user can
select the related properties, metrics and abstract test
cases following the recommendations (see the expla-
nation of this mapping in Section 3.2.4). For example,
when a user selects a subcharacteristic and their prop-
erties, she should select the metrics and abstract test
cases more appropriate to evaluate them. However,
the user can customize her selection, if it is desirable.
The user can also calculate the cost benefit of per-
forming the tests and measurements. Once the steps
are completed, a customized test plan can be gener-
ated and the user can download it as pdf file.
4 EVALUATION
We conducted the guide evaluation in two steps: (i)
by the experts’ point of view; and (ii) by conducting
a controlled experiment using the guide for testing a
real IoT application.
4.1 Evaluation by Experts
The methodology used to conduct the evaluation by
experts is detailed as follows:
• Objective. The goal is to evaluate the structure
and content of the Performance Testing Guide
from experts’ point of view.
• Context. The evaluation was conducted in two
days with seven experts. They received a checklist
8
Wiki: https://tinyurl.com/4pa8m52a
9
to conduct their evaluation about the the guide.
• Instrumentation. The instrument used for the
study is a checklist composed of 72 questions di-
vided in three parts: (i) 6 questions about the ex-
pert’s profile; (ii) 5 questions related to the guide
structure; and (iii) 61 questions concern the guide
content. Each question has the following options:
Yes, No, N/A (not applied) and Observation. The
experts may use this last option to explain the rea-
sons of their answer. In such a case, it help us
to understand, for example, when they partially
agree in a question. To evaluate the agreement
between the experts we applied the Fleiss’ Kappa
(FK) method (Fleiss and Cohen, 1973). This
method defines a coefficient of agreement that can
have a maximum value of 1. If the coefficient is
closer to 1, this value indicates that has a higher
agreement between the experts, and it closer to 0
indicates that the agreement is random.
• Participants. The participants of the study were
experts from academic and/or professional areas
of Computer Science who have experience in
Software Testing and/or IoT areas. Table 6 gives
the overview of the experts’ profile. Regarding
their expertise, four experts (1, 3, 4 and 6) have
experience in Software Testing, one expert (2)
with PhD has experience in IoT area and two ex-
perts (5 and 7) have PhD and experience in both
areas.
4.1.1 Results of the Evaluation by Experts
The results of the experts’ evaluation are presented
below in two parts: Evaluation of the Guide Structure
and the Evaluation of the Guide Content.
Evaluation of the Guide Structure: we elaborated
five questions to understand whether the guide has a
standardized structure and its sections follow a logi-
cal order. Figure 2 shows the agreement between the
experts. Each line represents an expert and each de-
limited horizontal space represents possible answers,
Yes, No, Partly, Not applicable. On the x-axis the
questions, EQ1, EQ2, EQ3, EQ4 and EQ5, are pre-
sented. We observed that the Experts 4, 5 and 6 an-
swered all the questions in the same way, showing
agreement between their answers. Two of them (Ex-
pert 4 and 6) have expertise in the the Software Test-
ing area and the other (Expert 5) has experience in
both areas: Software Testing and IoT. We observed
that the Expert 3 only disagreed with those experts
in Q3, which is about whether the guide followed a
logical sequence. Expert 3 said that the s3 section
9
Checklist: https://tinyurl.com/3wvx87ru
Performance Testing Guide for IoT Applications
673
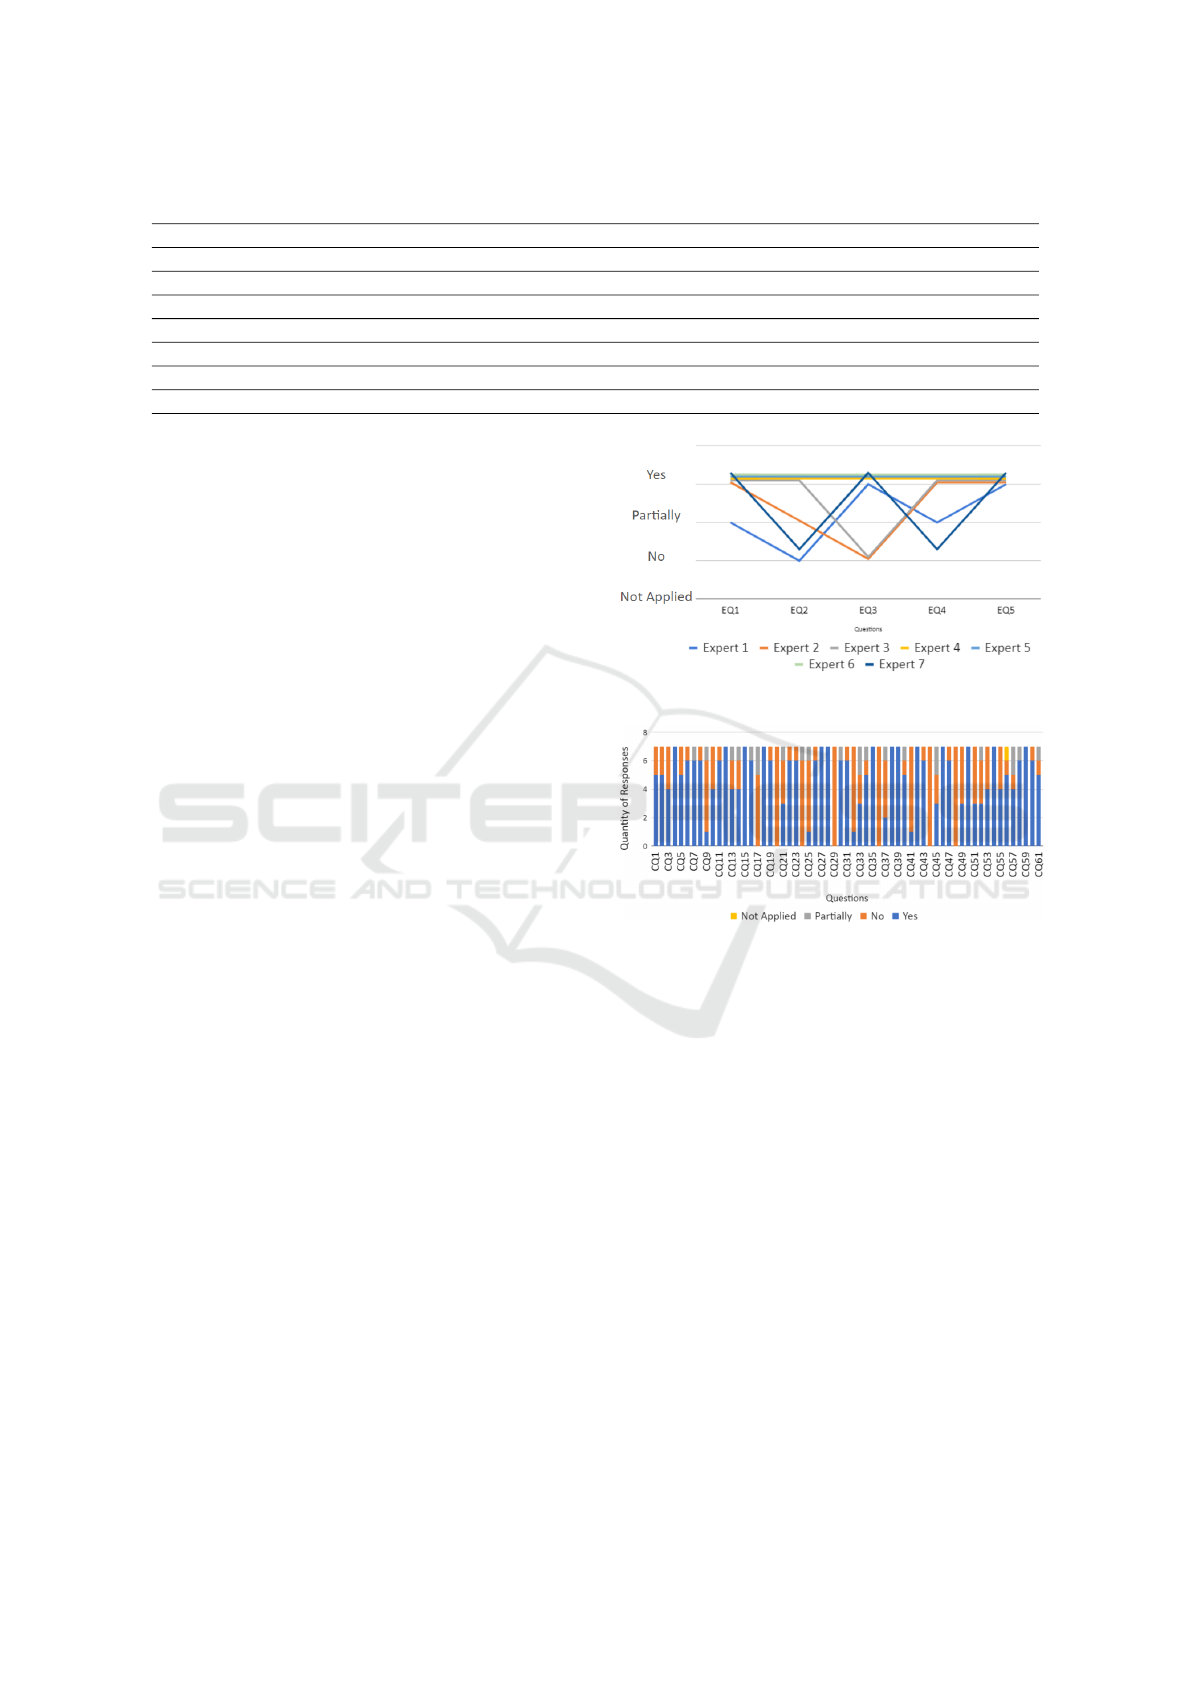
Table 6: Experts’ Profile.
Expert Qualification Position Degree Expertise Experience
1 Professional Test Analyst Bachelor Software Testing 5 years
2 Academic Professor/Researcher PhD IoT 5 years
3 Both Test Analyst Master’s student Software Testing 3 years
4 Both Test Factory Manager PhD Software Testing 13 years
5 Academic System Analyst PhD student Both 5 years
6 Professional Project Manager Master Software Testing 4 years
7 Both Test Analyst PhD students Both 9 years
(Test Environment Configuration) did not have a log-
ical connection with the s1, s2 and s4 sections, which
are more related to definitions.
To evaluate the experts’ agreement about the guide
structure, we calculated the FK coefficient over the
experts’ answers in the five questions. All calcula-
tions are available in the repository
6
. The FK co-
efficient value obtained is 0.610, this value present
a Substantial Agreement between the experts about
the guide structure, which shows a good indication
of agreement between the experts.
We analysed the individual answers of the ex-
perts about each question to understand if the experts’
agreement is positive or negative for the Guide eval-
uation. We observed that the question “Are the pro-
posed sections enough to enable an IoT characteris-
tic evaluation?” (EQ2) had a highest rate of disagree-
ment between the experts. For example, although the
Expert 4 answered “Yes” for EQ2, he would have to
use the guide to assume that the guide sections are
enough. We believe that some aspects are more diffi-
cult to analyse without using the guide.
The questions EQ1, EQ4 and EQ5, related to the
ease of use of the guide, presented few divergences.
In the case of EQ3, the Expert 3 said that the Test
Environment Configuration section should be in an-
other position into the guide, since the first sections
are more general and from the expert’s point of view
this section is more specific. We have defined the
”Test environment configuration” as a general section
since it presents the environment required for testing
the characteristic such as sensors and actuators.
Evaluation of the Performance Guide Content:
this evaluation was based on 61 questions available
on the checklist. These questions are subdivided into
general questions, which are about the content, and
specific questions about the each section of the guide.
Figure 3 gives the overview of the expert’s an-
swers for each question. We can observe that the
experts agreed in 14 questions (e.g., CQ04, CQ12,
CQ15, CQ18).
Based on the answers to questions CQ4, CQ8,
CQ15, CQ27, CQ39, we observed that most ex-
Figure 2: Experts’ agreement.
Figure 3: Experts’ answers about the Guide Content.
perts have reached a consensus on the information
presented in the guide sections, they said that it is
clearly described. Experts 2 and 4 had doubts about
some properties of the subcharacteristic “Temporal
Behavior” and “Resource” in the questions, CQ18
and CQ30, respectively. For example, Expert 2 said
regarding the properties of the Temporal Behavior “I
was in doubt between run time and response time.”
and the Expert 4 suggested the addition of the prop-
erty “Data Consumption” in the Resource Utilization
subcharacteristic. Six experts agreed that the corre-
lation section (s2) helps to identify the conflicts that
may exist between Performance and the other char-
acteristics of IoT, according to their answers in ques-
tion CQ11. Expert 1, who disagreed with the other
experts, said that he did not understand the process
used to correlate the characteristics. Regarding the
Tool Suggestion in question CQ59, all experts agreed
that this section is useful for helping to automate the
performance testing. The Experts 1, 2, 3 and 4 missed
ICEIS 2022 - 24th International Conference on Enterprise Information Systems
674

information about how the relationships in the sec-
tion “Impact of the Subcharacteristics” were defined,
according to questions CQ51 and CQ53. Six ex-
perts stated that the abstract test cases and the met-
rics, presented in s6 and s7 sections respectively, are
clear, concise and unambiguous. The Expert 7, who
disagreed with those experts, missed the information
about which kinds of metrics could be automated. Re-
garding the Test Environment Configuration (s3 sec-
tion) Experts 2 and 3 missed additional information
related to the section’s context. For example, the
Expert 3 pointed out that - “additional information
seems to be generic and is not related to the Test En-
vironment Configuration”.
In the evaluation of the Cost-Benefit (s9 section),
the Expert 2 suggested more details dealing with costs
and the explanation about how to analyse the results
obtained. Six experts agreed that the content pre-
sented in Example of use of the guide (s10) is suffi-
cient to understand the guide usage. The Expert 1 said
that the step by step provided in s10 was not enough
to assist the guide execution.
The FK coefficient value obtained for the guide
content is 0.360, this value indicates a Fair Agree-
ment among the experts. This value is lower com-
pared to the structure guide analysis, we believe that
the higher number of questions (61 against 5) may
generate a higher probability in the experts’ disagree-
ments. Moreover, the content evaluation is more com-
plex without using the guide in a real application.
Thus, we observed that the experts could not under-
stand so clearly the content of some sections.
The main experts’ disagreements were about the
Correlation of Characteristics (s2) and the Impact of
the subcharacteristics (s8). For example, only Expert
5 said that it is possible to establish the correlations
through the s2 section, the others missed the infor-
mation to help users to define the characteristic cor-
relations. We believe that this misunderstanding was
caused because we did not include in section s2 the
step by step showing how another characteristic can
be related to the Performance. Regarding the s8 sec-
tion, three experts (2, 4 and 7) mentioned that its ex-
planation was confusing. We believe that this misun-
derstanding was caused by the lack of clarity in how
the impacts presented can be used in a practical way.
The sections related to the subcharacteristics (s5, s6
and s7) presented few disagreements between the ex-
perts. Thus, the structure of the abstract test cases
and the explanation of these sections received posi-
tive feedback.
4.2 Experiment
The experiment is performed on an IoT application
with 6 different participants organized in two groups:
G1 - 3 participants using the guide; and G2 - 3 par-
ticipants without using the guide. The IoT applica-
tion, called Automa GREat (Andrade et al., 2017),
concerns the smart home context, where the goal is to
manage the turning on/off of lights. Due to the SARS-
COV-2 pandemic, the experiment was executed re-
motely during 7 days. Thus, the sensing and actuation
of the application was simulated on the smartphones
of each participant. All instrumentation used for the
experiment is available on the Instrumentation Repos-
itory
10
. The methodology for conducting the experi-
ment was based on Wholin (Wohlin et al., 2012). The
hypotheses for this experiment are listed below.
• Null Hypothesis. H
0,0
- The guide-based ap-
proach to conduct performance testing activities
requires the same testing effort as the traditional
performance testing. H
0,1
- The guide-based ap-
proach to conduct performance testing activities
finds the same number of IoT failures as the tradi-
tional performance testing.
• Alternative Hypothesis. H
1,1
- The structured
guide-based approach to conduct performance
testing activities reduces more the testing effort
than the traditional performance testing. H
1,1
: Ef-
fort (With the guide) < Effort (Without the guide).
H
1,2
- The structured guide-based approach to
conduct performance testing activities produces
more effective test cases than the traditional per-
formance testing. H
1,2
: Effectiveness of test cases
(With the guide) > Effectiveness of test cases
(Without the guide). H
1,3
- A structured guide-
based approach to conduct performance testing
activities finds more IoT failures than the tradi-
tional performance testing. H
1,3
: Number of IoT
Failures (With the guide) > Number of IoT Fail-
ures (Without the guide).
4.2.1 Analysis of the Experiment Results
Table 7 presents the overview of the experiment re-
sults by the groups G1 and G2. This table shows
for each participant: the ID, the planning time; the
number of specified test cases and the number of re-
ported IoT failures. The planning time refers to the
time spent to configure the devices, to plan test sce-
narios, to select the metrics and to define the scope.
Based on the data extraction of the experiment,
the hypotheses were evaluated. Table 8 presents the
10
https://tinyurl.com/yc4he8a9
Performance Testing Guide for IoT Applications
675
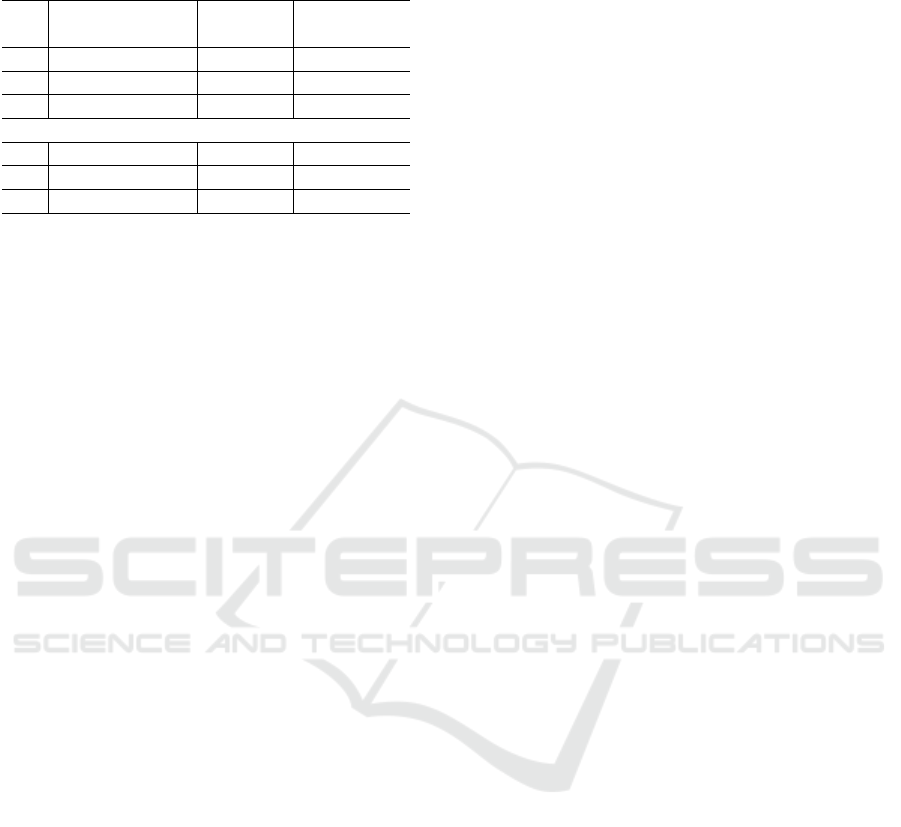
Table 7: Overview of the results by group.
Group 1 - G1 (with the Guide)
ID
Planning Time
(minutes)
Test
Cases(#)
IoT
Failures(#)
1 40 12 4
2 30 13 5
3 50 5 3
Group 2 - G2 (without the Guide)
4 60 5 1
5 75 4 0
6 90 6 2
hypotheses results obtained by using the Student’s T-
Test. This table presents the hypotheses, the compar-
ison to accept or reject the hypotheses, the statistical
data and the result. In the hypotheses analysis, we aim
to verify if there is a significant difference (p-value is
less than 0.05) in the effort to plan the tests, the ef-
fectiveness of the test cases and the number of IoT
failures, between the participants who used the guide
and those who did not use the guide.
Regarding the hypothesis H
1,1
, we collected the
planning time for effort comparison in the two groups.
In G1, the average time was 40 minutes, with the
longest time being 50 minutes. In G2, the average
time for planning was 75 minutes, with the longest
time being 90 minutes. It is worth mentioning that
both groups planned the same aspects such as: met-
rics, test cases, environment configuration and testing
tools. However, the G1 had the Wiki support for the
generation of the test plan based on the guide. We
believe that this support decreased the effort for the
testing planning. The result indicated that the effort
spent by the two groups had statistically significant
differences (p-value = 0.035). Thus, the hypothesis
H
1,1
can be accepted.
To evaluate the hypothesis H
1,2
, we based on the
effectiveness of test cases for identifying failures. G1
specified a total of 30 test cases based on the abstract
test cases provided by the guide. From them, 18 fail-
ures were identified in the application. In G2, 15 test
cases were specified based on the expertise of each
participant, and 5 failures were found in the applica-
tion, which were also reported by G1. Thus, the re-
sults showed that the test cases provided by the guide
were more effective. The result indicated that the ef-
fectiveness of the test cases by the two groups had
statistically significant differences (p-value = 0.046).
Thus, the hypothesis H
1,2
can be accepted.
Regarding the hypothesis H
1,3
, we collected the
number of failures that concerning for IoT. G1 de-
tected a total of 18 failures, of which 12 refer to the
IoT. G2 detected a total of 5 failures, of which 3 refer
to the IoT. Also, the participants classified the sever-
ity of the failures following the GUT matrix (Cardoso
et al., 2021). The severity classification in the statis-
tical tests was only as a comparative factor between
the results, since through the severity it is possible to
identify errors that generate critical problems in the
system. This model allows to classify the failures into
three severity categories: critical, moderate and low.
The severity distribution of 12 failures detected by G1
are: 5 were critical; 2 were moderate; and 5 were low;
whereas in G2, 1 was critical; 1 was moderate; and
1 was low. In the statistical test, the average num-
ber of IoT failures detected by each group was: G1
detected on average of 4 IoT failures (12 failures by
3 participants) and G2 detected on average of 1 IoT
failure (3 failures by 3 participants). The result in-
dicated that the number of IoT failures found by the
two groups had statistically significant differences (p-
value = 0.021). Thus, with this result it is possible to
accept the hypothesis H
1,3
.
Based on the results of the statistical analysis, the
null hypotheses H
0,0
and H
0,1
can be rejected.
5 DISCUSSION
This section discusses the answers to the research
questions presented in this paper.
RQ1. How should be organized the IoT testing pro-
cess? We believe that a guide focusing on IoT char-
acteristics may be more effective to evaluate intrinsic
aspects of the IoT. Indeed, the guide provides sections
that allow us to create more target test cases for IoT.
Based on the results presented in the guide structure,
we observed that the experts’ agreements about the
guide are positive. They agreed that the guide pro-
vides a functional structure that helps the performance
testing for IoT applications. Moreover, the proposed
guide structure and the methodology used to instan-
tiate the guide for the Performance Testing can be
reused and adapted for testing other IoT characteris-
tics such as Interoperability.
RQ2. How to evaluate the performance character-
istic in IoT applications? The results obtained from
the evaluation by experts showed its sections are use-
ful to the performance evaluation. The sections of the
guide such as Abstract Test Cases, Measurements and
Tools allow users to standard their performance tests.
We also believe that the guide usage decreases the ef-
fort to conduct the performance tests since it provide
a complete testing planning, which can be automati-
cally generated from the Wiki. Moreover, the results
have demonstrated that with the guide we could spec-
ify more effectiveness test cases and detect more IoT
failures.
ICEIS 2022 - 24th International Conference on Enterprise Information Systems
676
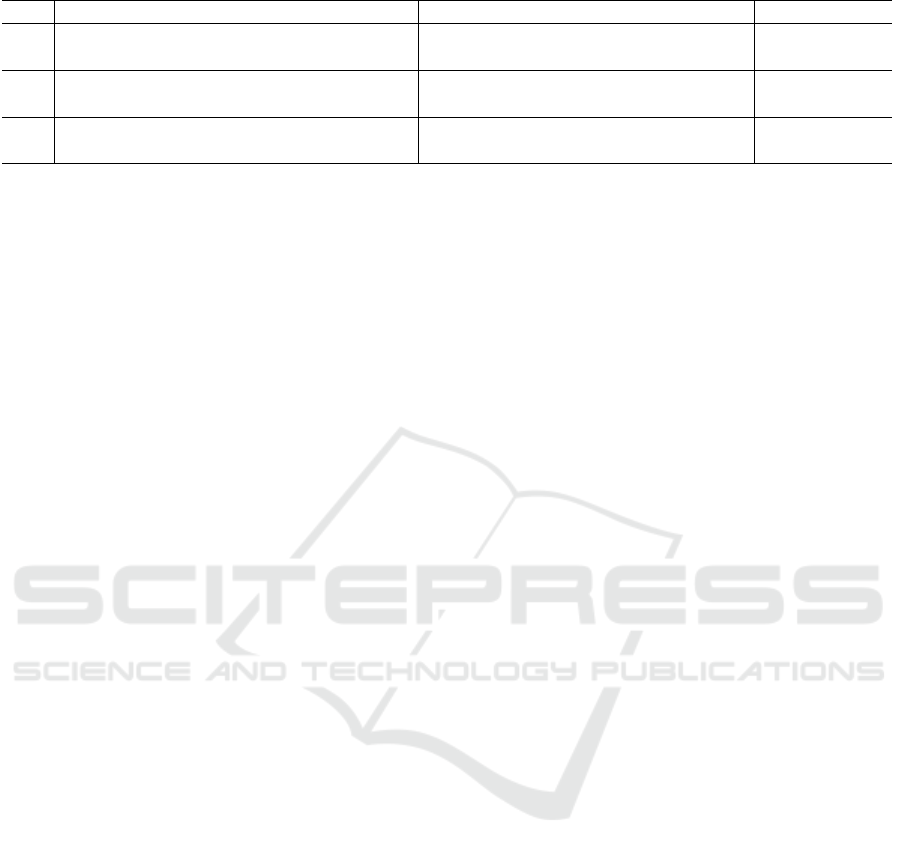
Table 8: Hypotheses results.
H
x,y
Comparison Statistical data Result
H
1,1
Effort: Time spent (in minutes) in
the testing planning
Average G1 = 40; Average G2 = 75
p-value = 0.035
Statistically
different
H
1,2
Effectiveness: Test cases that find failures /
Total test cases
Average G1 = 0.64; Average G2 = 0.31
p-value = 0.046
Statistically
different
H
1,3
IoT Failures: Number of IoT failures
detected
Average G1 = 4; Average G2 = 1
p-value = 0.021
Statistically
different
6 THREATS TO VALIDITY
This section presents the threats to the validity of this
study.
External Validity. The main threat concerns the
experts who evaluated the guide in the first evalua-
tion. Some of them have no knowledge in both areas:
Software Testing and IoT. To minimize this threat,
we provided a checklist with 72 questions to support
their evaluation. Furthermore, all experts have knowl-
edge in Mobile Computing. Other threat concerns
the small number of participants (6) in the experiment
(second evaluation), which may have brought a small
amount of data, however, to minimize this threat we
invited participants who have knowledge in the areas
of Software Testing and IoT. Besides, the fact that the
experiment was remote did not affect the results since
we provide a roadmap to execute the experiment and
recorded videos to explain the concepts involved in
the experiment. Also, we were available to clarify
any doubt during the experiment execution.
Internal Validity. This threat concerns the use of
only one application in the experiment. To minimize
this threat, we selected an application that covers the
basic functionalities of IoT and allows us to test the
Performance characteristic.
7 RELATED WORK
We did not find in the literature studies that propose
guides in the context of IoT. Thus, the related work
presented in this section concerns the performance
testing solutions (guides or frameworks) focused on
different areas.
Jeannotte and Tekeoglu (Jeannotte and Tekeoglu,
2019) present a solution to more easily detect com-
mon vulnerabilities of IoT devices. Similar to a guide
for the security characteristic, the solution combines
applications (Nikto, OWASP-Zap, Nmap and Hydra)
that scan the vulnerability of systems, based on the
top 10 model of OWASP3. The model presents good
practices to educate developers, designers, architects,
managers and organizations about the consequences
of the most important web application security vul-
nerabilities, the solution aims to cover categories 1, 2,
3, 4 and 9 of that model. However, the proposed so-
lution does not present structured steps and does not
correlate Security with other IoT characteristics.
Pontes et al. (Pontes et al., 2018) present a so-
lution to the lack of standardization in IoT testing. In
their study, a set of test strategies is associated with an
IoT pattern, and the authors have identified five dif-
ferent test patterns: Test Periodic Reading; Test Trig-
gered Reading; Test Alerts; Test Actions; and Test Ac-
tuators. The study is related to our proposed guide
since it presents a framework for conducting tests
through those patterns, however, the context is func-
tional testing and it is not applied to IoT character-
istics such as Performance. For example, the Test
Actuators pattern is used to verify that an actuator
performs its function as expected. The authors men-
tion as future work to propose some solution for non-
functional testing, but so far such a solution has not
been proposed. The work also does not mention tools
and metrics that assist in the IoT testing process.
Meier et al. (Meier et al., 2007) propose a per-
formance guide for Web applications. The guide
presents sections concerning, for instance, the main
activities of performance testing (test planning and
test execution), how to ensure performance in Web
applications, among others. However, this guide pro-
vides general information for testing the performance
of Web applications and does not focus on IoT do-
main.
8 CONCLUSION AND FUTURE
WORK
This paper presented a Performance Testing Guide
for IoT applications. We first build a general guide
structure based on IoT characteristics. Next, we in-
stantiated the guide for the Performance characteris-
tic based on literature review and the observation of
real IoT applications. We conducted two evaluations.
Performance Testing Guide for IoT Applications
677

The first one is an empirical study with seven experts
to evaluate the structure and content of the guide. We
have applied the Fleiss’ Kappa method to analyse the
agreements between the experts. Most experts’ feed-
back about the guide structure were positive. The ex-
perts disagreed more about the content guide since
some aspects are difficult to understand without the
guide usage. Thus, we conducted a second evaluation
using the guide in an application through a controlled
experiment. The results show the benefits of the guide
for reducing the test effort, increasing the test cover-
age, and detecting IoT failures.
As future work, we intend to expand the experi-
ment to be conducted with more participants and in
other IoT applications. We also intend to instantiate
the guide for others IoT characteristics such as Inter-
operability and Security.
REFERENCES
Amalfitano, D., Amatucci, N., De Simone, V., Riccio, V.,
and Rita, F. A. (2017). Towards a thing-in-the-loop
approach for the verification and validation of iot sys-
tems. In Proceedings of the 1st ACM Workshop on the
Internet of Safe Things, SafeThings’17, page 57–63,
New York, NY, USA. Association for Computing Ma-
chinery.
Andrade, R. M., Carvalho, R. M., de Ara
´
ujo, I. L., Oliveira,
K. M., and Maia, M. E. (2017). What changes from
ubiquitous computing to internet of things in interac-
tion evaluation? In International Conference on Dis-
tributed, Ambient, and Pervasive Interactions, pages
3–21. Springer.
Brady, S., Hava, A., Perry, P., Murphy, J., Magoni, D., and
Portillo-Dominguez, A. O. (2017). Towards an emu-
lated iot test environment for anomaly detection us-
ing nemu. 2017 Global Internet of Things Summit
(GIoTS), pages 1–6.
Cardoso, G., Filho, F., Barbosa, R., and Kowal, J. (2021).
Business process management (bpm) and gut matrix
in support to the information technology. SSRN Elec-
tronic Journal.
Carvalho, L. (2018). A systematic mapping of
tests to IoT applications. Monograph (Bache-
lor in Software Engineering), UFC (Federal Uni-
versity of Cear
´
a), Russas, Brazil. Available on:
http://www.repositorio.ufc.br/handle/riufc/39047.
Cort
´
es, M., Saraiva, R., Souza, M., Mello, P., and Soares,
P. (2019). Adoption of software testing in internet of
things: A systematic literature mapping. In Proceed-
ings of the IV Brazilian Symposium on Systematic and
Automated Software Testing, SAST 2019, page 3–11,
New York, NY, USA. Association for Computing Ma-
chinery.
Dahmann, J., Lane, J. A., Rebovich, G., and Lowry, R.
(2010). Systems of systems test and evaluation chal-
lenges. In 2010 5th International Conference on Sys-
tem of Systems Engineering, pages 1–6.
Fleiss, J. L. and Cohen, J. (1973). The equivalence of
weighted kappa and the intraclass correlation coeffi-
cient as measures of reliability. Educational and Psy-
chological Measurement, 33(3):613–619.
Gupta, H., Vahid Dastjerdi, A., Ghosh, S. K., and Buyya,
R. (2017). ifogsim: A toolkit for modeling and
simulation of resource management techniques in
the internet of things, edge and fog computing en-
vironments. Software: Practice and Experience,
47(9):1275–1296.
Gurijala, Y. R. (2018). Perfor-
mance testing internet of things.
https://www.infosys.com/de/documents/performance-
testing-iot.pdf.
ISO 25010:2011 (2011). Software and data quality. Stan-
dard, International Organization for Standardization,
Geneva, CH.
Jain, R. (1991). The art of computer systems performance
analysis - techniques for experimental design, mea-
surement, simulation, and modeling. Wiley profes-
sional computing. Wiley.
Jeannotte, B. and Tekeoglu, A. (2019). Artorias: Iot se-
curity testing framework. In 2019 26th International
Conference on Telecommunications (ICT), pages 233–
237.
Kitchenham, B. (2004). Procedures for performing sys-
tematic reviews. Keele, UK, Keele University,
33(2004):1–26.
Lu, C., Stankovic, J. A., Abdelzaher, T. F., Tao, G., Son,
S. H., and Marley, M. (2000). Performance speci-
fications and metrics for adaptive real-time systems.
In Proceedings 21st IEEE Real-Time Systems Sympo-
sium, pages 13–23. IEEE.
Mehedi, H. (2019). Top 15 standard iot protocols that you
must know about. https://www.ubuntupit.com/top-15-
standard-iot-protocols-that-you-must-know-about/.
Meier, J., Farre, C., Bansode, P., Barber, S., and Rea, D.
(2007). Performance Testing Guidance for Web Appli-
cations: Patterns & Practices. Microsoft Press, USA.
Pontes, P. M., Lima, B., and Faria, J. a. P. (2018). Test pat-
terns for iot. In Proceedings of the 9th ACM SIGSOFT
International Workshop on Automating TEST Case
Design, Selection, and Evaluation, A-TEST 2018,
page 63–66, New York, NY, USA. Association for
Computing Machinery.
Sand, B. (2015). Iot testing-the big challenge why, what
and how. In International Internet of Things Summit,
pages 70–76. Springer.
Tappler, M., Aichernig, B. K., and Bloem, R. (2017).
Model-based testing iot communication via active au-
tomata learning. In 2017 IEEE International Confer-
ence on Software Testing, Verification and Validation
(ICST), pages 276–287.
Wohlin, C., Runeson, P., H
¨
ost, M., Ohlsson, M. C., Reg-
nell, B., and Wessl
´
en, A. (2012). Experimentation in
software engineering. Springer Science & Business
Media.
Zhang, K., Leng, S., He, Y., Maharjan, S., and Zhang, Y.
(2018). Mobile edge computing and networking for
green and low-latency internet of things. IEEE Com-
munications Magazine, 56:39–45.
ICEIS 2022 - 24th International Conference on Enterprise Information Systems
678
