
Seen to Unseen: When Fuzzy Inference System Predicts IoT Device
Positioning Labels That Had Not Appeared in Training Phase
Han Xu
1,2 a
, Zheming Zuo
3 b
, Jie Li
4 c
and Victor Chang
4∗ d
1
School of Microelectronics, University of Chinese Academy of Sciences, Beijing 100049, China
2
Institute of Microelectronics, Chinese Academy of Sciences, Beijing 100029, China
3
Department of Computer Science, Durham University, Durham DH1 3LE, U.K.
4
Cybersecurity, Information Systems and AI Research Group, School of Computing, Engineering & Digital Technologies,
Teesside University, Middlesbrough TS3 6DR, U.K.
∗
Corresponding author
Keywords:
Unseen Label Prediction, TSK+ Fuzzy Inference Engine, Curvature-based Feature Selection, Internet of
Things, Networking Device Positioning.
Abstract:
Situating at the core of Artificial Intelligence (AI), Machine Learning (ML), and more specifically, Deep
Learning (DL) have embraced great success in the past two decades. However, unseen class label prediction
is far less explored due to missing classes being invisible in training ML or DL models. In this work, we
propose a fuzzy inference system to cope with such a challenge by adopting TSK+ fuzzy inference engine
in conjunction with the Curvature-based Feature Selection (CFS) method. The practical feasibility of our
system has been evaluated by predicting the positioning labels of networking devices within the realm of
the Internet of Things (IoT). Competitive prediction performance confirms the efficiency and efficacy of our
system, especially when a large number of continuous class labels are unseen during the model training stage.
1 INTRODUCTION
Indoor Positioning System (IPS) is a tracking system
that usually uses a set of network devices to locate
people or objects within a building, or a particular
room (Kim Geok et al., 2021) where GPS would fail
entirely (Kachurka et al., 2021) or lack of high accu-
racy (Suroso et al., 2021). An indoor tracking system
is one of the most helpful features of a smart build-
ing (Maduraga and Abeysekara, 2021) or smart envi-
ronment (Zhang and Tan, 2021) that can usually be
achieved by working with Internet of Things (IoT)
(Abdel-Basset et al., 2020; Chang et al., 2021) tech-
niques, e.g. WiFi and Bluetooth technologies. Cur-
rently, such IoT-based indoor tracking systems have
been applied in several areas that lead to practical ben-
efits. For instance, an indoor navigation system is pre-
sented in (Khanh et al., 2020) to track the location of
a
https://orcid.org/0000-0003-1411-3092
b
https://orcid.org/0000-0003-1576-0865
c
https://orcid.org/0000-0002-5276-8172
d
https://orcid.org/0000-0002-8012-5852
a self-driving cart, thus helping to figure out the short-
est path in a smart indoor environment in real-time. A
hospital equipment tracking system for the well-being
and safety of the patients is also discussed in (Cur-
ran et al., 2011). Those systems normally use mod-
ulated WiFi/Bluetooth transmission signals to deter-
mine whether the service exists by adopting either the
triangulation method or Machine Learning (ML) (Jor-
dan and Mitchell, 2015) algorithms. Triangulation,
i.e. trilateration, is a well-established method, which
calculates the distance between the tracking object
and WiFi/Bluetooth Access Points (APs) by measur-
ing the Received Signal Strength Indicator (RSSI)
(Sthapit et al., 2018). Nonetheless, the aforemen-
tioned methods usually require to use of beacon sig-
nals for the precise estimation of distance. A large
number of beacons can cause interference with each
other.
In contrast, ML and Deep Learning (DL) (Le-
Cun et al., 2015) were employed to transfer an in-
door tracking problem into a classification problem.
In recent year, ML and DL have achieved great suc-
cess with a wide spectrum of applications including
Xu, H., Zuo, Z., Li, J. and Chang, V.
Seen to Unseen: When Fuzzy Inference System Predicts IoT Device Positioning Labels That Had Not Appeared in Training Phase.
DOI: 10.5220/0011102800003194
In Proceedings of the 7th International Conference on Internet of Things, Big Data and Security (IoTBDS 2022), pages 281-288
ISBN: 978-989-758-564-7; ISSN: 2184-4976
Copyright
c
2022 by SCITEPRESS – Science and Technology Publications, Lda. All rights reserved
281
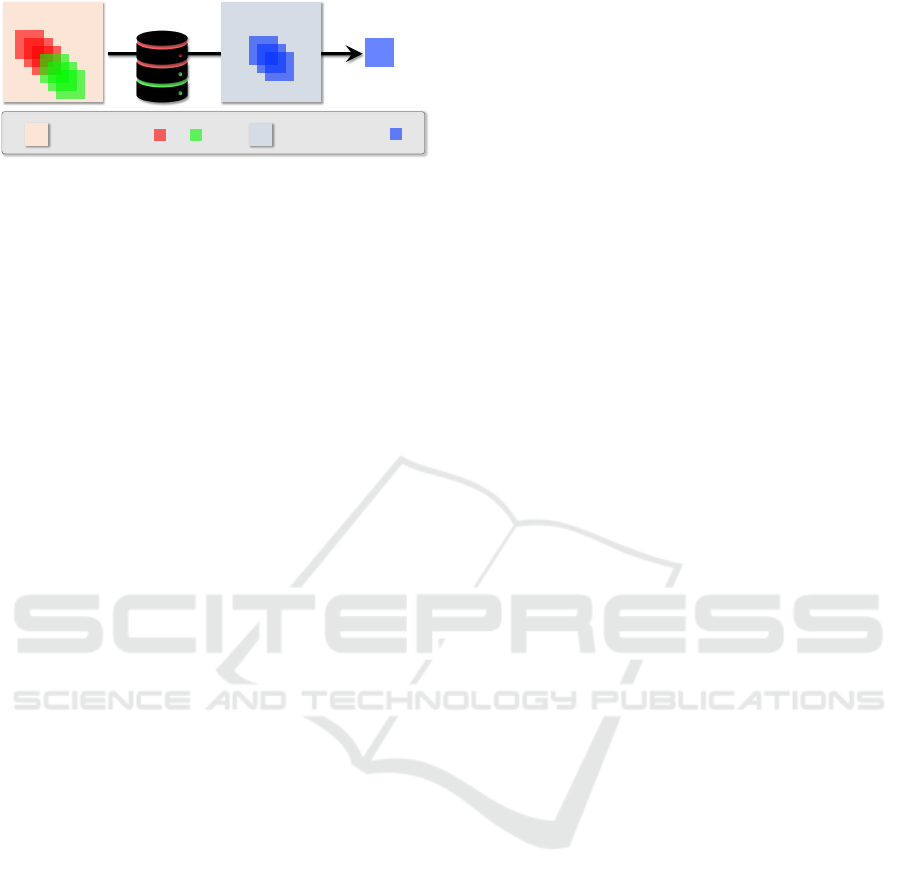
Our modelTraining set Testing set
contains seen labels and contains unseen labels
Predicted label
Figure 1: The motivation of this work is to build a model
which predicts the IoT device positioning labels that were
not appeared during the training phase.
action recognition in videos (Zuo et al., 2020), face
detection in low-light conditions (Yang et al., 2020),
image denoising in low-light and noisy scenes (Zuo
et al., 2022) etc. In the context of IPS, the RSSIs
values are collected from a set of pre-deployed bea-
con devices to form the training dataset at each of the
known locations. From there, a system model would
be trained based on all the given training instances.
Given an input, which contains multiple RSSI values,
ML predicts the corresponding location in line with
the trained model (Nessa et al., 2020). However, none
of those models are capable of predicting the label of
a testing instance if that specific ground-truth label
is not visible to the model during the training phase.
That is, as shown in Fig. 1, e.g., a model is trained on
the instances with class labels of c
red
and c
green
(‘seen
labels’), and testing on the ones with ground-truth la-
bel of c
blue
(‘unseen label’).
Fuzzy inference systems (Yang et al., 2017) are
usually built upon fuzzy logic theory to map the in-
puts of the system to desired outputs. Typically,
a fuzzy inference system includes a rule base and
an inference engine. In terms of the inference en-
gine, Mamdani (Mamdani, 1977) and TSK(Takagi
and Sugeno, 1985) are the two most common choices.
In the conventional settings, the fuzzy inference ap-
proaches are only compatible with dense rule bases,
and each of which covers the entire input domain.
Fuzzy interpolation techniques (K
´
oczy and Hirota,
1993; Li et al., 2017; Li et al., 2018a; Li et al.,
2018b) were originally proposed to ease the require-
ment of the dense rule base, which allows the fuzzy
inference to be performed over a sparse rule base (Li
et al., 2016). That is, the conclusion still could be
drawn via interpolation in the case that a given input
(i.e. observation) does not overlap with any rule an-
tecedent. Thereby, the task of ‘unseen’ label predic-
tion could be converted to a sparse rule base problem
where the fuzzy interpolation technique is adopted.
In this study, TSK+ (Li et al., 2018b), as one of the
TSK-style fuzzy interpolation approaches, is utilized
to deal with the indoor tracking system with the fol-
lowing major contributions:
• Proposed a fuzzy inference system by adopting
TSK+ fuzzy interpolation approach to address the
indoor location tracking problem with invisible
classes during the training phase;
• Deployed a Curvature-based Feature Selection
(CFS) method (Zuo et al., 2021) to reduce the
space and time complexity of the proposed fuzzy
inference system;
• Evaluated the performance of the proposed fuzzy
inference system using a real-world IoT device
positioning dataset with competitive prediction
performance yielded.
2 BACKGROUND
The extended Takagi–Sugeno–Kang (TSK+), as a
fuzzy interpolation method (Yang et al., 2017), is ca-
pable of conducting fuzzy inferences on a sparse TSK
rule base, which is introduced in the first half of this
section. This is followed by a brief review of a feature
selection method, curvature-based feature selection,
adopted in our system.
2.1 TSK+ Fuzzy Interpolation
Conventional TSK system generates a crisp inference
result (i.e. output) from a given input by calculating
the weighted average over the sub-consequences of
all fired rules (Takagi and Sugeno, 1985). Obviously,
the firing strength of all rules is valued as zero in the
case that a given input does not overlap with any rule
antecedent, and thus, no consequence can be derived.
TSK-interpolation has addressed such issue (Li et al.,
2017). Suppose that a sparse TSK rule base R is com-
prised of n rules:
R
1
: IF x
1
is A
1
1
and x
2
is A
1
2
and ··· and x
m
is A
1
m
THEN γ = Γ
1
,
... ...
R
i
: IF x
1
is A
i
1
and x
2
is A
i
2
and ·· · and x
m
is A
i
m
THEN γ = Γ
i
,
... ...
R
n
: IF x
1
is A
n
1
and x
2
is A
n
2
and ·· · and x
m
is A
n
m
THEN γ = Γ
n
,
(1)
where n denotes the the number of rules (i.e. size
of the rule base); A
i
k
denotes a normal and convex
fuzzy set s.t. i ∈ [1, ·· · ,n] and k ∈ [1,··· , m], and γ is
the consequent of a rule base. In addition, we utilize
triangular membership functions for simplicity, and
therefore A
i
k
is conveniently denoted as (a
i
k1
,a
i
k2
,a
i
k3
),
where (a
i
k1
,a
i
k3
) represents the support of the fuzzy
IoTBDS 2022 - 7th International Conference on Internet of Things, Big Data and Security
282

set and a
i
k2
denotes the normal point. Regardless
whether an input I = (A
∗
1
,A
∗
2
,· ·· ,A
∗
m
) overlaps with
any rule antecedents, the desired crisp output can be
calculated via the following three steps.
Step 1: Matching Degree Determination. The
matching degrees S(A
∗
1
,A
i
1
), S(A
∗
2
,A
i
2
), ·· ·, and
S(A
∗
m
,A
i
m
) between the inputs (A
∗
1
, A
∗
2
,· ·· ,A
∗
m
) and
corresponding rule antecedents (A
i
1
, A
i
2
,· ·· ,A
i
m
) for
each rule R
i
(i ∈ 1, 2,· ·· ,n) can be determined by:
S(A
i
k
,A
∗
k
) =
1 −
∑
3
j=1
|a
i
k j
− a
∗
k j
|
3
!
·
D
!
, (2)
where D, namely distance factor, is a function of the
distance between the two concerned fuzzy sets. D is,
in turn, computed as:
D = 1 −
1
1 + e
−hd+ω
, (3)
where h, s.t. h > 0, is a sensitivity factor, d represents
the distance between the two fuzzy sets, and ω is a
constant. A smaller value of h leads to the similarity
degree which is more sensitive to the distance of two
fuzzy sets and vice versa.
Step 2: Firing Degree Calculation. Compute the
rule-wise firing degree (θ
i
) by integrating the match-
ing degrees of its antecedents and the known input
values:
θ
i
= S (A
∗
1
,A
i
1
) ∧ S (A
∗
2
,A
i
2
) ∧ · ·· ∧S(A
∗
m
,A
i
m
) , (4)
in which ∧ represents the t-norm that is practically
implemented as a minimum operator.
Step 3: Sub-consequence Integration. Gener-
ate the final output (γ) via the integration of the sub-
consequences from all the rules by:
γ =
∑
n
i=1
θ
i
· Γ
n
∑
n
i=1
θ
i
. (5)
2.2 Curvature-based Feature Selection
Feature Selection (FS) aims to select a subset of the
most relevant attributes for the use of model construc-
tion from the given dataset (Zuo et al., 2021). In par-
ticular, FS methods identify the feature-wise impor-
tance for a given problem, thus helping select the most
relevant (or discriminative) features. Curvature-based
FS (CFS) method (Zuo et al., 2021) was developed to
rank the weights (importance) of features by calculat-
ing the averaged Menger Curvature (L
´
eger, 1999) of
each feature, which can be summarized into the fol-
lowing three steps:
Step 1: 2-D Data Re-construction. Given a high-
dimensional dataset M , which contains n attributes,
donates as F
i
(1 6 i 6 n), M can be divided into n
2D-panels, and each of which can be represented as
P
(F
i
,y)
, where y is the index of the data instance.
Step 2: Feature Weights Calculation. For each
2-D panel P
(F
i
,y)
, the Menger Curvature approach is
employed to calculate the averaged curvature value of
the feature F
i
. For a given 2-D panel (P
(F
i
,y)
) that in-
cludes m data instances, the Menger Curvature value
(C
i
m
j
) of data point m
j
(s.t. j ∈ [2,m − 1]) can be ex-
pressed by:
C (m
j−1
,m, m
j+1
) =
1
R
=
2sin(ϕ)
km
J−1
,m
j+1
k
, (6)
Thereby, the mean of C for F
i
, denoted as
c
C
F
i
, is cal-
culated as:
c
C
F
i
=
1
m − 2
m−1
∑
j=2
C
i
m
j
, (7)
where C
i
m
j
represents the curvature value of the m
th
j
data point in feature F
i
.
c
C
F
i
indicates the correspond-
ing weight of F
i
. Furthermore, the higher value of
c
C
F
i
, the importance of the feature F
i
for M , and vice
versa.
Step 3: Feature Ranking and Selection. The
features’ weight can be ranked by adopting a con-
ventional ordinal ranking method. That is, features
with
c
C
F
greater than the given threshold ε are cho-
sen for further data modelling. (The determination of
the threshold ε would be based on the given situation,
which will remain as the future work.)
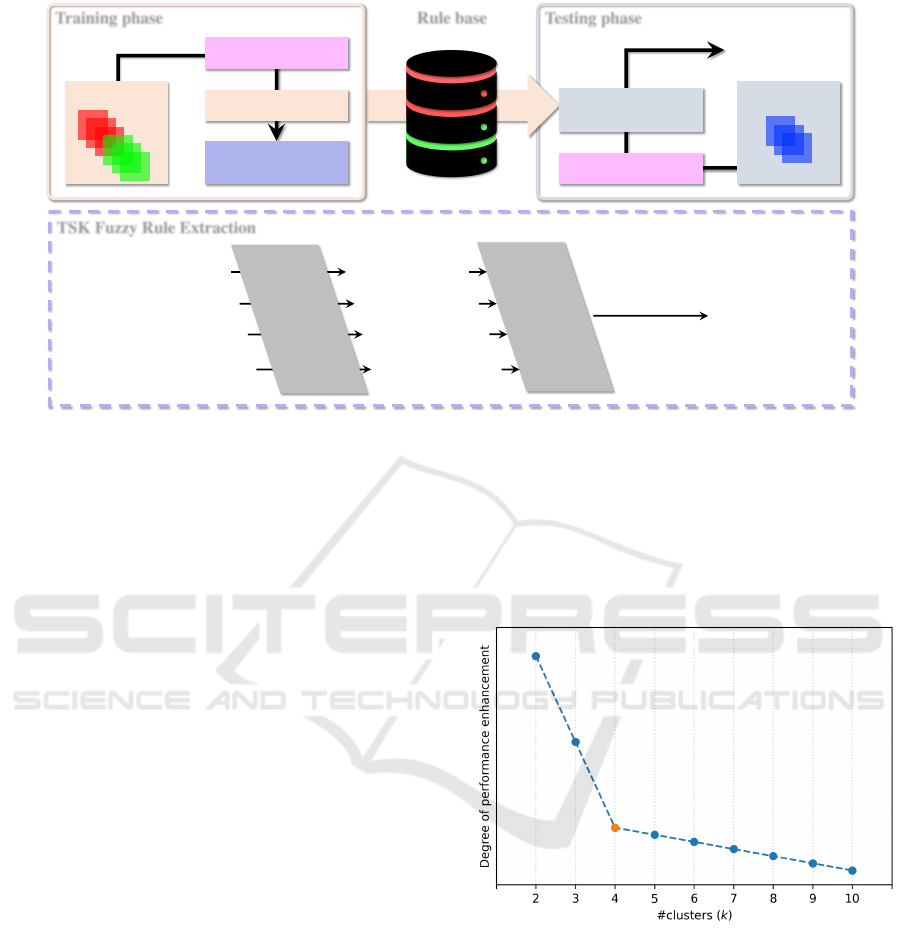
3 PROPOSED SYSTEM
The proposed fuzzy-based indoor tracking system
is presented in this section, which adopts with the
introduction of using signal strength between WiFi
or Bluetooth signal receiver and different Refer-
ence Points (RP), such as WiFi APs and Bluetooth
beacon, to predict the position of the device in a
WiFi/Bluetooth enabled environment. Our system
contains two major components, including a TSK rule
base generation (i.e. training phase) and a psition pre-
diction (termed as testing phase). Figure 2 illustrates
the pipeline of the proposed system. Particularly, our
system first constructs a fuzzy rule base from a visi-
ble training dataset by employing the feature selection
(i.e. CFS) and clustering (i.e. k-Means) techniques.
From there, given a testing data instance, the cor-
responding position/location would be predicted by
adopting TSK+ fuzzy inference approach (Li et al.,
2018b). The proposed indoor system is capable of
Seen to Unseen: When Fuzzy Inference System Predicts IoT Device Positioning Labels That Had Not Appeared in Training Phase
283
Training phase
Training set
Data Preprocessing
Clustering
TSK Fuzzy Rule
Extraction
Rule base
Test ing phase
Testing set
Data Preprocessing
TSK+ Fuzzy
Inference
Predicted label
TSK Fuzzy Rule Extraction
Rule Cluster
𝐶
!
Rule Cluster 𝐶
"
…
Rule Cluster 𝐶
#
Extracted Rule
𝑅
!
Rule
Extraction
Extracted Rule 𝑅
"
Rule
integration
Extracted Rule 𝑅
#
…
Rule base
Figure 2: The pipeline of the proposed system. Note that the ‘Data Preprocessing’ component contains the feature normaliza-
tion and selection.
predicting unseen position/label. In other words, the
position information had not appeared in the training
dataset at all. This is achievable mainly due to the
fact that the TSK+ method performs inference using
a sparse rule base.
3.1 TSK Fuzzy Rule Base Generation
A data-driven TSK-style rule base generation ap-
proach, which was proposed in (Li et al., 2018b) and
illustrated in the bottom part of Figure 2, is applied in
this work to generate a rule base for TSK+ approach.
Particularly, given a sparse dataset T , that lacks some
locations information, the system first applies the fea-
ture selection method CFS where all the features are
normalized using the min-max method (Zuo et al.,
2018; Zuo et al., 2019), introduced in Section 2.2, to
reduce the dimensionality of the given dataset. This is
followed by the k-Means clustering algorithm, which
is applied to group all the data instances into a num-
ber of clusters. From there, each cluster is expressed
as a TSK rule. Lastly, our system combines all the ex-
tracted rules and generates the final TSK rule-based.
The processes of clustering and fuzzy rule extraction
are detailed below:
• Optimal Number of Clusters Determination.
The Elbow method is carried out in this work
to determine the optimal k in k-Means cluster-
ing algorithm, as a faster and effective method
(Kodinariya and Makwana, 2013). In particu-
lar, this method determines the number of clusters
by adding another cluster that does not lead to a
much better modeling result. For example, given
a problem, the relationship between performance
improvement and the number of clusters is shown
in Figure 3. The value of k can be obtained as 4,
which is determined as a turning point (i.e. Elbow
point).
Figure 3: Examination of k by the Elbow method.
• Fuzzy Rule Extraction. Each obtained clus-
ter is used to form one TSK fuzzy rule. In this
work, triangular membership functions are uti-
lized. Given a cluster C
r
,(1 ≤ r ≤ k), which is
determined from the above step, a TSK fuzzy rule
R
r
can be extracted as:
R
r
: IF x
1
is A
1r
and ·· · and x
n
is A
nr
THEN y = L.
(8)
where A
sr
(1 ≤ s ≤ n) are rule antecedents,
which are triangular fuzzy sets, represented as
(a
1
sr
,a
2
sr
,a
3
sr
). Suppose that C
r
has p
r
elements,
IoTBDS 2022 - 7th International Conference on Internet of Things, Big Data and Security
284
i.e. C
r
= {x
1
r
, x
2
r
,· ·· ,x
p
r
r
}, the core of the trian-
gular fuzzy set is set as the cluster centroid, that
is a
2
sr
=
∑
p
r
q=1
x
q
r
/p
r
; and the support of the fuzzy
set is set as the span of the cluster, i.e. (a
1
sr
,a
3
sr
) =
(min{x
1
r
,x
2
r
,· ·· ,x
p
r
r
}, max{x
1
r
,x
2
r
,· ·· ,x
p
r
r
}). L is
rule conclusion, which are discrete integer num-
bers to represent the corresponding class labels.
3.2 Unseen Location Prediction by
TSK+
Thanks to the characteristics of the TSK+ inference
approach, which allows the fuzzy inference to be per-
formed over a sparse rule base. Naturally, TSK+
method, as briefed in Section 2.1, is readily utilized
as a classifier to perform inference. Given a testing
data instance O that contains several WiFi or Blue-
tooth signal strength information, which collected in
the same environment as the training phase, but corre-
sponding location label has not appeared in the train-
ing data. From there, the TSK+ approach first calcu-
lates the matching degrees between the given inputs
O and the rule antecedents of each existing rule using
Eq. (2). Then, the prediction results of the location
information are produced from Eq. (5).
Note that, although a number of machine learning
algorithms have been adopted to solve the IoT sensor-
based indoor location tracking problems, such as Ar-
tificial Neural Network (ANN) (D’Aloia et al., 2020),
k-nearest Neighbour (kNN) (D’Aloia et al., 2020),
Decision Tree (DT) (AlHajri et al., 2018) and Sup-
port Vector Machine (SVM) (AlHajri et al., 2018),
all those systems require location information to be
learned in the training phase. Compared with such ex-
isting systems, which would not be able to deal with
unseen location information, the proposed system can
still make a decision for unseen labels.
4 EXPERIMENTS
In this section, we firstly justify the practical feasibil-
ity of the proposed system in predicting the unseen la-
bel using a dataset collected for indoor location track-
ing within the IoT sector. Then, we further deploy
our system with a fast feature selection method to im-
prove prediction performance.
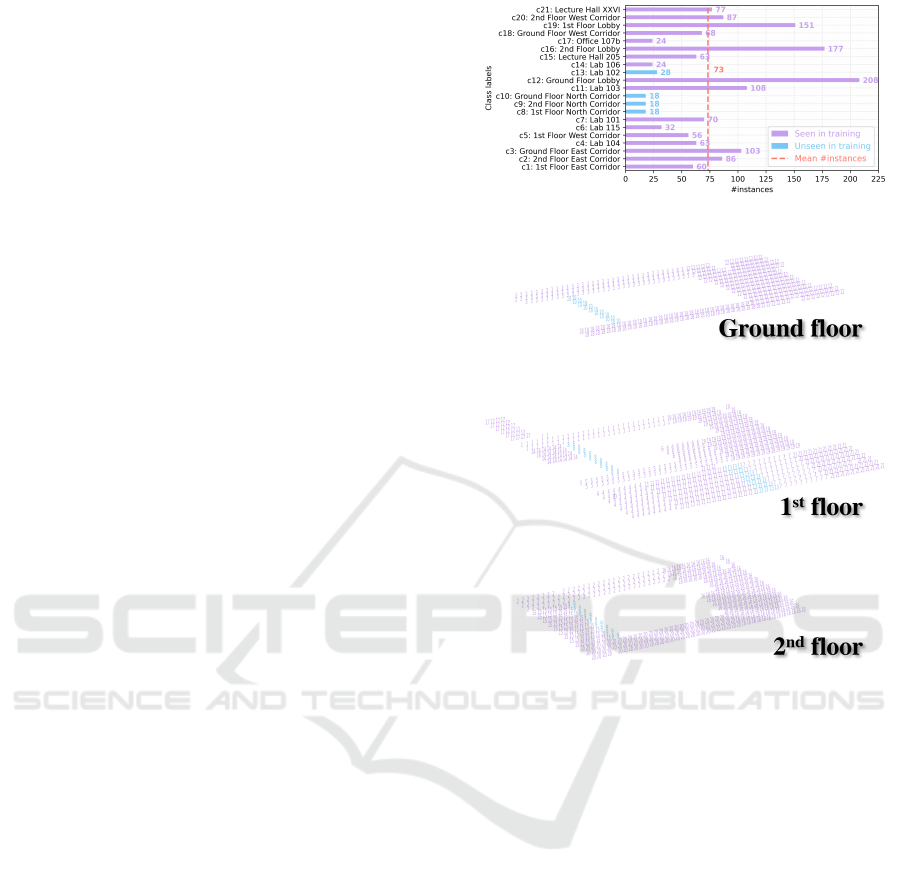
4.1 Dataset and Experimental Design
We employ the Miskolc IIS dataset (Zsolt T
´
oth,
2016) in this study, which was collected for hybrid
indoor positioning. Generally, it contains a total of
Figure 4: Class label distribution of the Miskolc IIS dataset.
Figure 5: Visualisation of the floor plan where 21 color
numbers denote all the room located in all layers. Color
codes are consistent with those adopted in Figure 4.
1,540 instances, each one including 65 attributes. We
use 29 attributes in this study because the rest of at-
tributes, e.g., the actual location coordinates, are ir-
relevant to this experimentation. In addition, all the
instances are categorized into 21 classes. this dataset
is an unbalanced dataset, as the most of classes have
more than 200 data instances and ‘c8’, ‘c9’ and ‘c10’
have only 18 data instances. Concretely, we visualize
the distribution of the attributes in Figure 4.
On this basis, two experimental scenarios are de-
signed: 1) continuous unseen label prediction (i.e. in-
stances from classes of ‘c8’, ‘c9’ and ‘c10’ will not
appear during the model training phase, due to con-
taining less data instances); 2) discrete prediction of
the unseen label (i.e. we only make instances of class
‘c13’ (28 instances) available in the testing phase).
Thus, as depicted in Figure 5, data instances that are
seen and unseen during the training phase are visual-
ized in conjunction with the actual three-dimensional
positions within a 3-layer building of Miskolc IIS
dataset.
Seen to Unseen: When Fuzzy Inference System Predicts IoT Device Positioning Labels That Had Not Appeared in Training Phase
285
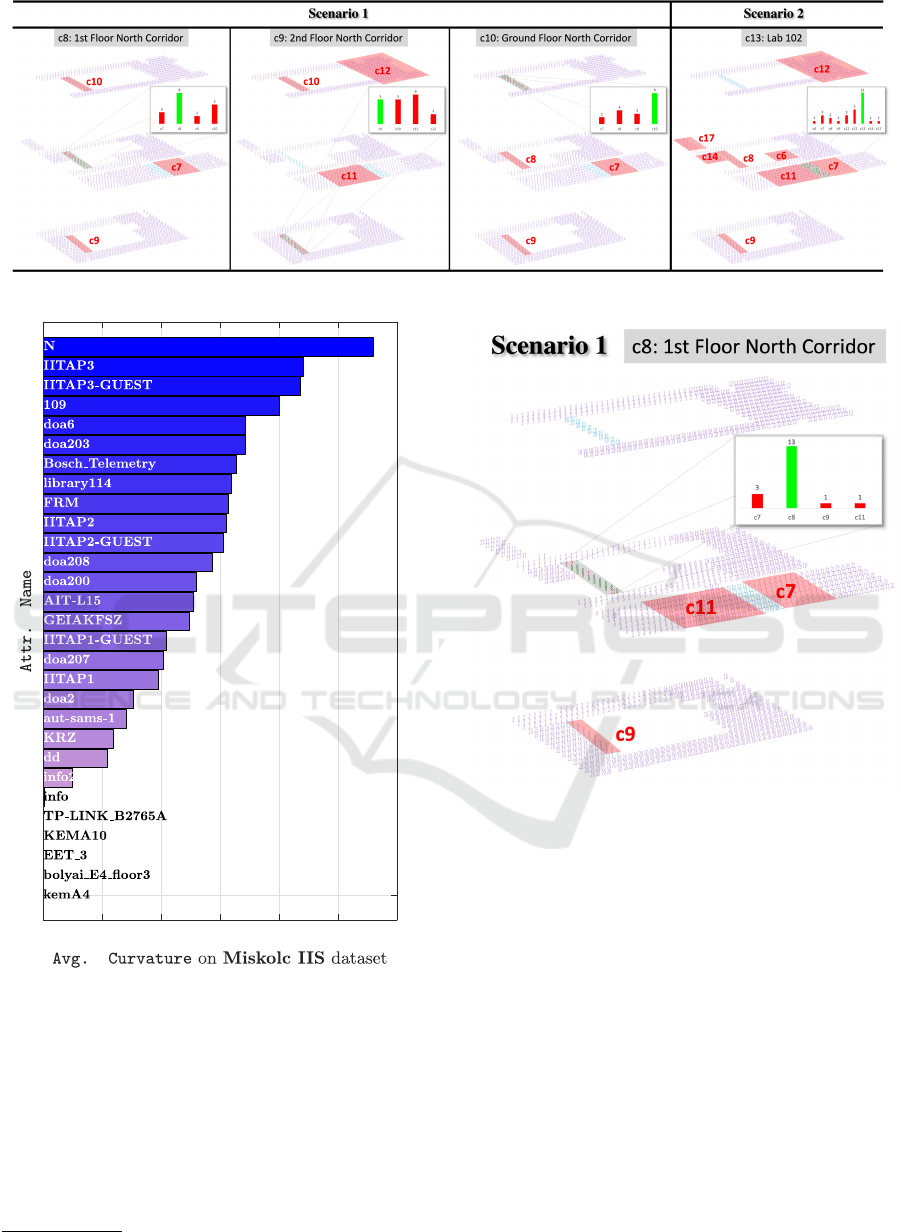
Figure 6: Experimental results for unseen class label prediction without using CFS. Best viewed in color and zoomed mode.
0.1 0.15 0.2 0.25 0.3 0.35 0.4
Figure 7: Feature importance ranking of the Miskolc IIS
dataset yieled by CFS.
4.2 Feature Importance Ranking
To achieve dimensionality reduction, the CFS is
adopted
1
in this study. Furthermore, the feature im-
portance ranking among all the 29 attributes are sum-
marized in Figure 7.
1
https://github.com/zhemingzuo/CFS
Figure 8: Experimental results for unseen class label ‘c8’
prediction using CFS.
4.3 Experimental Results
As described in the aforementioned subsections, we
firstly detail the prediction performance using all the
29 attributes (i.e. without CFS applied) Figure 6.
This is followed by using feature importance ranking
yielded by CFS (see Figure 7) to reduce the number
of features (from 29 to 8) employed as well as the
computational cost for unseen label prediction. It is
noteworthy that we only visualize the detailed predic-
tion of our system in conjunction with CFS adopted
in Figure 8 due to space limitation. Lastly, all the pre-
diction performances are summarized in Table 1
One step further, in Figure 6, it could be drawn
the conclusion that the more continuous unseen labels
are in the training phase, the more reasonable predic-
tions will be yielded by our system. Specifically, 8,
IoTBDS 2022 - 7th International Conference on Internet of Things, Big Data and Security
286

5 and 9 correct predictions are given by our system
in terms of respectively, ‘c8’, ‘c9’ and ’c10’, whereas
11 out of the total 28 predictions are correctly given
for ‘c13’. For ‘c8’, we see that all the 10 wrong pre-
dictions given by our system are fairly close to the
ground-truth ‘c8’, i.e. 3, 2 and 5 of which are wrong
predicted as ‘c7’, ‘c9’ and ‘c10’. Similarly, all the
13 wrong predictions were distributed in ‘c10’, ‘c11’
and ‘c12’ when the ground-truth label is ‘c9’; and
all the 9 wrong predictions are covered the labels of
‘c7’, ‘c8’ and ‘c9’ for ‘c10’. On the contrast, all the
17 wrong prediction are discretely distribute among
a wider range of class labels when the unseen label is
‘c13’, i.e. ‘c6’, ‘c7’, ‘c8’, ‘c9’, ‘c11’, ‘c12’, ‘c14’ and
‘c17’.
We adopt CFS from the above findings to use the
eight most important features to conduct unseen label
prediction using the proposed system. As visualized
in Figure 8, the prediction accuracy of ‘c8’ is 72.22%.
That is, 13 out of a total of 18 predictions are correctly
predicted as ‘c8’. In terms of the rest 5 wrong predic-
tions, three of which are predicted as ‘c7’ (same as
that of the ones yielded without using CFS), whereas
the rest two are produced as ‘c9’ and ‘c11’. Further-
more, ‘c7’ (i.e. ‘Lab 101’), ‘c11’ (i.e. ‘Lab 103’) and
target label ‘c8’ (i.e. ‘1st Floor North Corridor’) are
all located in the first floor of the building and they
are close with each other. In addition, ‘c9’ represents
the ‘2nd Floor North Corridor’, and it is possible that
the signals provided by IoT devices located in ‘c8’ get
interfered from those given by ‘c9’.
Given the above findings, it is noteworthy that
the prediction performance of scenario 1) is gener-
ally better than that of 2), which confirms the prac-
tical feasibility of our system for the task of unseen
label prediction. Additionally, the prediction preci-
sion of our system with CFS generally outperforms
those without CFS. This, in turn, enables our system
to be a reasonable candidate for such a task.
Table 1: Quantitative evaluation of our system on the
Miskolc IIS dataset.
Scenario Predicted class w. CFS Dim.↓ D Accuracy (%)↑
1
c8
7 29 8.2 44.44
3 8 9.0 72.22
c9
7 29 3.0 27.78
3 8 5.0 22.22
c10
7 29 1.0 50.00
3 8 1.0 50.00
2 c13
7 29 29.0 39.29
3 8 21.2 53.57
5 CONCLUSIONS
A fuzzy inference system has been proposed in this
work as an effort to move towards the challenging
task of unseen label prediction, which is achieved by
adopting the TSK+ interpolation and CFS method.
Experimental results on the real-world IoT devices
positioning dataset reveal the efficiency and efficacy
of the proposed system. Though promising results
have been obtained, the involvement of optimization
algorithms to improve the generalization capability of
the rule base could be an active future direction.
ACKNOWLEDGEMENT
This work is partly supported by VC Research (VCR
0000171) for Prof Chang.
REFERENCES
Abdel-Basset, M., Hawash, H., Chang, V., Chakrabortty,
R. K., and Ryan, M. (2020). Deep learning for het-
erogeneous human activity recognition in complex iot
applications. IEEE Internet Things J, pages 1–1.
AlHajri, M. I., Ali, N. T., and Shubair, R. M. (2018). Clas-
sification of indoor environments for iot applications:
A machine learning approach. IEEE Antennas Wirel.
Propag. Lett., 17(12):2164–2168.
Chang, V., Mou, Y., and Xu, Q. A. (2021). The ethical
issues of location-based services on big data and iot.
In Proc. Int. Conf. Ind. IoT Big Data Supply Chain,
pages 195–205.
Curran, K., Furey, E., Lunney, T., Santos, J., Woods, D., and
McCaughey, A. (2011). An evaluation of indoor loca-
tion determination technologies. J. Location Based
Serv., 5(2):61–78.
D’Aloia, M., Longo, A., Guadagno, G., Pulpito, M.,
Fornarelli, P., Laera, P. N., Manni, D., and Rizzi, M.
(2020). Iot indoor localization with ai technique. In
Proc. IEEE Int. Work. Metrol. Ind. 4.0 IoT, pages 654–
658.
Jordan, M. I. and Mitchell, T. M. (2015). Machine learn-
ing: Trends, perspectives, and prospects. Science,
349(6245):255–260.
Kachurka, V., Rault, B., Mu
˜
noz, F. I., Roussel, D., Bonardi,
F., Didier, J.-Y., Hadj-Abdelkader, H., Bouchafa, S.,
Alliez, P., and Robin, M. (2021). Weco-slam: Wear-
able cooperative slam system for real-time indoor lo-
calization under challenging conditions. IEEE Sens.
J., pages 1–1.
Khanh, T. T., Nguyen, V., Pham, X.-Q., and Huh, E.-N.
(2020). Wi-fi indoor positioning and navigation: a
cloudlet-based cloud computing approach. Human-
centric Comput. Info. Sci., 10(1):1–26.
Seen to Unseen: When Fuzzy Inference System Predicts IoT Device Positioning Labels That Had Not Appeared in Training Phase
287

Kim Geok, T., Zar Aung, K., Sandar Aung, M., Thu Soe,
M., Abdaziz, A., Pao Liew, C., Hossain, F., Tso, C. P.,
and Yong, W. H. (2021). Review of indoor position-
ing: Radio wave technology. Appl. Sci., 11(1):279.
K
´
oczy, L. and Hirota, K. (1993). Approximate reasoning by
linear rule interpolation and general approximation.
Int. J. Approximate Reasoning, 9(3):197–225.
Kodinariya, T. M. and Makwana, P. R. (2013). Review on
determining number of cluster in k-means clustering.
Int. J. Adv. Res. Comput. Sci. Manage. Stud., 1(6):90–
95.
LeCun, Y., Bengio, Y., and Hinton, G. (2015). Deep learn-
ing. nature, 521(7553):436–444.
L
´
eger, J.-C. (1999). Menger curvature and rectifiability.
Ann. Math., 149:831–869.
Li, J., Qu, Y., Shum, H. P. H., and Yang, L. (2017). Tsk
inference with sparse rule bases. In Proc. Springer
Adv. Comput. Intell. Syst., pages 107–123.
Li, J., Shum, H. P., Fu, X., Sexton, G., and Yang, L. (2016).
Experience-based rule base generation and adaptation
for fuzzy interpolation. In Proc. IEEE Int. Conf. Fuzzy
Syst., pages 102–109.
Li, J., Yang, L., Fu, X., Chao, F., and Qu, Y. (2018a). Inter-
val type-2 tsk+ fuzzy inference system. In Proc. IEEE
Int. Conf. Fuzzy Syst., pages 1–8.
Li, J., Yang, L., Qu, Y., and Sexton, G. (2018b). An ex-
tended takagi–sugeno–kang inference system (tsk+)
with fuzzy interpolation and its rule base generation.
Soft Comput., 22(10):3155–3170.
Maduraga, M. W. P. and Abeysekara, R. (2021). Compar-
ison of supervised learning-based indoor localization
techniques for smart building applications. In Proc.
IEEE Int. Res. Conf. Smart Comput. Syst. Eng., vol-
ume 4, pages 145–148.
Mamdani, E. H. (1977). Application of fuzzy logic to ap-
proximate reasoning using linguistic synthesis. IEEE
Trans. Comput., 26(12):1182–1191.
Nessa, A., Adhikari, B., Hussain, F., and Fernando, X. N.
(2020). A survey of machine learning for indoor posi-
tioning. IEEE Access, 8:214945–214965.
Sthapit, P., Gang, H.-S., and Pyun, J.-Y. (2018). Bluetooth
based indoor positioning using machine learning al-
gorithms. In Proc. IEEE Int. Conf. Consum. Electron.
- Asia, pages 206–212.
Suroso, D. J., Rudianto, A. S., Arifin, M., and Hawibowo,
S. (2021). Random forest and interpolation techniques
for fingerprint-based indoor positioning system in un-
ideal environment. Int. J. Comput. Digital Syst.
Takagi, T. and Sugeno, M. (1985). Fuzzy identification of
systems and its applications to modeling and control.
” IEEE Trans. Syst., Man, and Cybern., 15(1):116–
132.
Yang, L., Zuo, Z., Chao, F., and Qu, Y. (2017). Fuzzy inter-
polation systems and applications. In Ramakrishnan,
S., editor, Modern Fuzzy Control Systems and Its Ap-
plications. IntechOpen, Rijeka.
Yang, W., Yuan, Y., Ren, W., Liu, J., Scheirer, W. J., Wang,
Z., Zhang, T., et al. (2020). Advancing image un-
derstanding in poor visibility environments: A collec-
tive benchmark study. IEEE Trans. Image Process.,
29:5737–5752.
Zhang, D. and Tan, C. (2021). Application of indoor po-
sitioning technology in smart home management sys-
tem. In Proc. IEEE Int. Conf. Big Data Artif. Intell.
Internet Things Eng., pages 627–631.
Zsolt T
´
oth, J. T. (2016). Miskolc iis hybrid ips: Dataset for
hybrid indoor positioning. In Proc. IEEE Int. Conf.
Radioelektronika, pages 408–412.
Zuo, Z., Chen, X., Xu, H., Li, J., Liao, W., Yang, Z.-X.,
and Wang, S. (2022). Idea-net: Adaptive dual self-
attention network for single image denoising. In Proc.
IEEE/CVF Winter Conf. Appl. of Comput. Vis. Work.,
pages 739–748.
Zuo, Z., Li, J., Anderson, P., Yang, L., and Naik, N. (2018).
Grooming detection using fuzzy-rough feature selec-
tion and text classification. In Proc. IEEE Int. Conf.
Fuzzy Syst., pages 1–8.
Zuo, Z., Li, J., Wei, B., Yang, L., Chao, F., and Naik, N.
(2019). Adaptive activation function generation for
artificial neural networks through fuzzy inference with
application in grooming text categorisation. In Proc.
IEEE Int. Conf. Fuzzy Syst., pages 1–6.
Zuo, Z., Li, J., Xu, H., and Moubayed, N. A. (2021).
Curvature-based feature selection with application in
classifying electronic health records. Elsevier Tech-
nol. Forecasting Social Change, 173:121–127.
Zuo, Z., Yang, L., Liu, Y., Chao, F., Song, R., and Qu, Y.
(2020). Histogram of fuzzy local spatio-temporal de-
scriptors for video action recognition. IEEE Trans.
Ind. Inf., 16(6):4059–4067.
IoTBDS 2022 - 7th International Conference on Internet of Things, Big Data and Security
288
