
Modelling the Effect of Academic Performance on National
Achievement Test (NAT)
Nathalie Joy G. Casildo
a
College of Information Sciences and Computing, Central Mindanao University, Musuan, Maramag, Bukidnon, Philippines
Keywords: Academic Performance, National Achievement Test, Educational Data Mining.
Abstract: The title of this study is Predicting the Effect of Academic Performance on the National Achievement Test
Using Data Mining. Students from Central Mindanao University's Senior High School (SHS) provided the
data for this study. The goal of this study is to develop a model that can predict how academic performance
affects the National Achievement Test. Its specific objectives are to extract predictive features of subjects that
affect the National Achievement Test (NAT), determine the effects of various academic subjects on the
National Achievement Test, identify the subjects that have a strong effect on the National Achievement Test,
and finally determine whether academic performance per quarter affects the National Achievement Test.
1 INTRODUCTION
One of the factors used to evaluate a student's ability
is academic achievement. The evaluation of periodic
grades, which is the criteria for measuring academic
performance, serves as the foundation for grading all
scholastic activities. The National Achievement Test
(NAT) is given to Filipino students every year by the
Department of Education (DepEd) to guarantee that
the aim of achieving quality education is realized
(Ebio, Jr., 2016). The test, according to the same
source, is designed to evaluate pupils' ability in a
number of topics, including Mathematics, English,
Science, Filipino, and others.
According to Hand (2012), data mining is a
branch of computer science in which you are bound
to identify some structures in non-random samples of
the population if you have large enough datasets. The
art of detecting patterns in massive amounts of data is
known as data mining. The most important element
of data mining is that; it can be used to produce new
ideas, hypotheses, and predictions from datasets in a
more scientific way. Data mining, also known as
Knowledge Discovery in Databases (KDD), is the
field of uncovering fresh and possibly usable
information from enormous amounts of data,
according to Baker(2007). The major goal of
educational institutions is to offer students with a
a
https://orcid.org/0000-0001-6935-5262
high-quality educat
1
ion in order to improve their
academic performance (Dabhade et al., 2021.Finding
patterns in datasets of national achievement tests and
student academic performance may be the ideal
application of Data Mining. Educational Data Mining
(EDM) is a field that uses statistical, machine
learning, and data-mining (DM) algorithms to
analyze various forms of educational data (Romero &
Ventura, 2010).
EDM is also defined as the
application of data mining techniques to data sets
produced from educational settings that could lead to
the discovery of new information (Amazona &
Hernandez, 2019)
Predicting a student's performance is crucial for
assisting at-risk students and ensuring their retention,
as well as offering good learning materials and
experience and boosting the university's ranking and
reputation (Mahmoud, 2019). The purpose of this
study is to construct a predictive model to assess the
effect of academic performance on the National
Achievement Test. The hypothesis in this study is the
effect of having greater or lower academic
performance on the NAT scores. Following the
development of the model, it will be used to extract
predictive features of subjects that affect the National
Achievement Test, determine the effects of various
academic subjects on the NAT, identify the subjects
that have a strong effect on the National Achievement
Casildo, N.
Modelling the Effect of Academic Performance on National Achievement Test (NAT).
DOI: 10.5220/0011106300003182
In Proceedings of the 14th International Conference on Computer Supported Education (CSEDU 2022) - Volume 1, pages 517-522
ISBN: 978-989-758-562-3; ISSN: 2184-5026
Copyright
c
2022 by SCITEPRESS – Science and Technology Publications, Lda. All rights reserved
517
Test, and finally determine if academic performance
per quarter affects the National Achievement Test.
With 50 publications (42.4 percent), classification
is the most widely employed technique, followed by
regression with 33 papers (28 percent). Clustering
(11%) and association (1.7%) were employed far less
frequently, as were other approaches that were not
specifically mentioned (16.9% highlighted Machine
Learning/ Data Mining broadly) (López-Zambrano et
al., 2021). (Regio, et al., 2021). Alyahyan and
Düştegör's study, Predicting academic performance
in higher education: literature review and best
practices, revealed an accuracy of 89.15 percent when
applying the Logistic regression model.
2 RELATED WORKS
Abu Saa (2016,) conducted research on educational
data mining and student performance prediction. This
study used a variety of data mining tasks to create
high-performing qualitative prediction models that
can reliably predict students' grades based on a
training dataset. A survey was sent out to students to
collect personal, social, and academic information; it
was then preprocessed for data mining operations; the
data mining work was started; and finally, a pattern
was detected. It was discovered in this study that a
student's accomplishment is not solely based on their
academic efforts; there are various other factors that
are equally or more important. To summarize, this
study can motivate and aid universities in conducting
regular data mining jobs on their students' data in
order to reveal interesting results and patterns that can
benefit both the institution and the students in a
variety of ways.
Shahiri et al., (2015) published a review on
applying data mining approaches to predict student
performance. The most essential features were
discovered using a prediction algorithm, and
educational data mining methodologies revealed that
student achievement and success might be improved
more effectively and efficiently. (Sorour et al., 2015)
An experiment reported a model of student academic
performance predictor by evaluating student
comments data as predictor factors. The current study
is essentially about developing a predictive model. As
a result, the research is limited to text mining
approaches rather than data mining techniques.
The studies of Hamsa et al., (2016) and this one
are similar in terms of predicting student academic
performance, however they differ in terms of
algorithm because Decision Tree and Fuzzy Genetic
Algorithm were utilized. It seeks to construct a model
for predicting student academic performance for
Bachelor and Master Degree students in Computer
Science and Electronics and Communication utilizing
two categorization methods: Decision Tree and Fuzzy
Genetic Algorithm.
Regio et al., (2021) provide a prediction model for
participant performance, allowing them to discover
the elements that best explain exam results. They used
accessible data from the Ministry of Education as
well as the Logistic Regression approach for this
project. They can infer the student's performance with
a 74 percent accuracy using the predictive model.
Furthermore, because they employed a statistical
model that is simple to read and implement rather
than a complicated Machine Learning technique,
school administrators could use the results without
having a comprehensive understanding of the mining
technique.
3 METHODOLOGY
The Periodic Grades dataset and the National
Achievement Test dataset are the two data sources
used in this investigation. All of the information was
obtained in hard copy from Central Mindanao
University's College of Education.
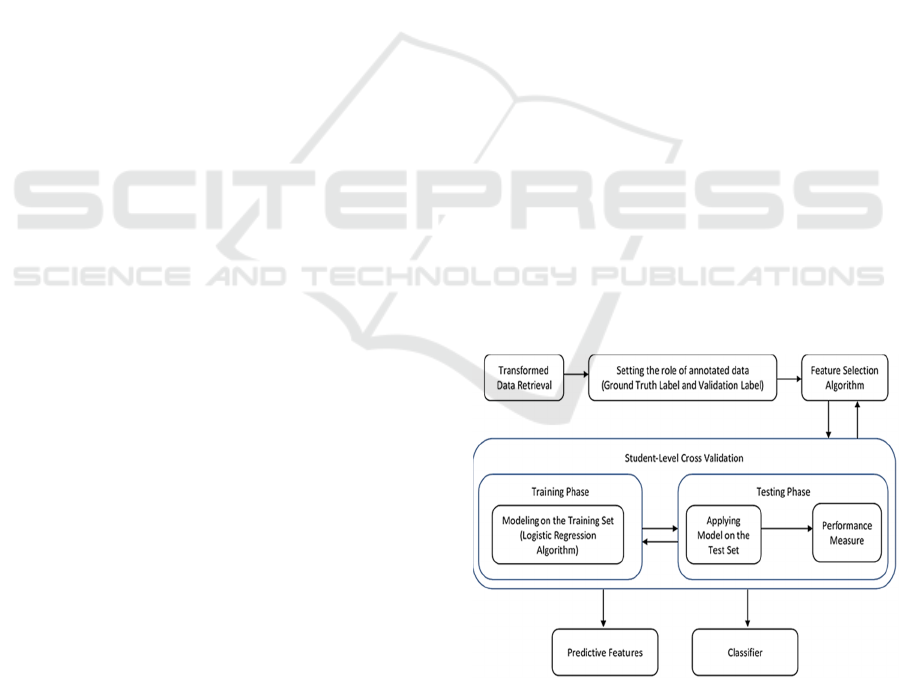
This study implements the KDD (Knowledge
Discovery in Database) methodology. Figure 1 shows
the specific KDD (Knowledge Discovery in
Database) methodology for this study using the
Logistic Regression Algorithm and Feature Selection
Technique.
Figure 1: Logistic Regression with Feature Selection and
Student-level Cross-Validation.
Periodic grades data was obtained from a total of 723
Senior High School students of Central Mindanao
University when they were in grade 11 (the school
A2E 2022 - Special Session on Analytics in Educational Environments
518
year 2017-2018) and grade 12 (the school year 2018-
2019) related to beginning the National Achievement
Test.
The first step in preparing for the National
Achievement Test dataset was to convert the hard
copy to digital. The Mean Percentage Score was then
categorized, and the NAT score, according to Albano
(2019), follows the criteria listed in Table 1.
Table 1: National Achievement Test criteria.
NAT
Scores
Criteria
0 - 35 Very Low Mastery
36 – 65 Low Mastery
66 – 85 Average Mastery
86 – 100 Moving Towards Mastery
The criteria are based on the National
Achievement Test's Mean Percentage Score. Table 1
shows that the range 0–35 represents Very Low
Mastery, 36–65 represents Low Mastery, 66–85
represents Average Mastery, and 86–100 represents
Moving Towards Mastery. VLM is for Very Low
Mastery, LM stands for Low Mastery, AM stands for
Average Mastery, and MTM stands for Moving
Toward Mastery.
The National Achievement Test and Periodic
Grades datasets were pooled and then divided into
strands. There are four strands in total: Humss, Stem,
ABM, and TVL. To eliminate repetition in the
attributes and data while integrating the datasets, the
four files were joined using a union operator, as
illustrated in Figure 2. The union operator joins
multiple example sets together to form a superset. If
both examplesets have a common attribute, the union
operator creates a single attribute that holds the data
for both sets.
4 RESULTS AND DISCUSSION
The main purpose of this study is to develop a
predictive model for the National Achievement Test.
In order to estimate the impact of academic success
on NAT, a prediction model must be developed. The
logistic regression approach was used to generate the
model.
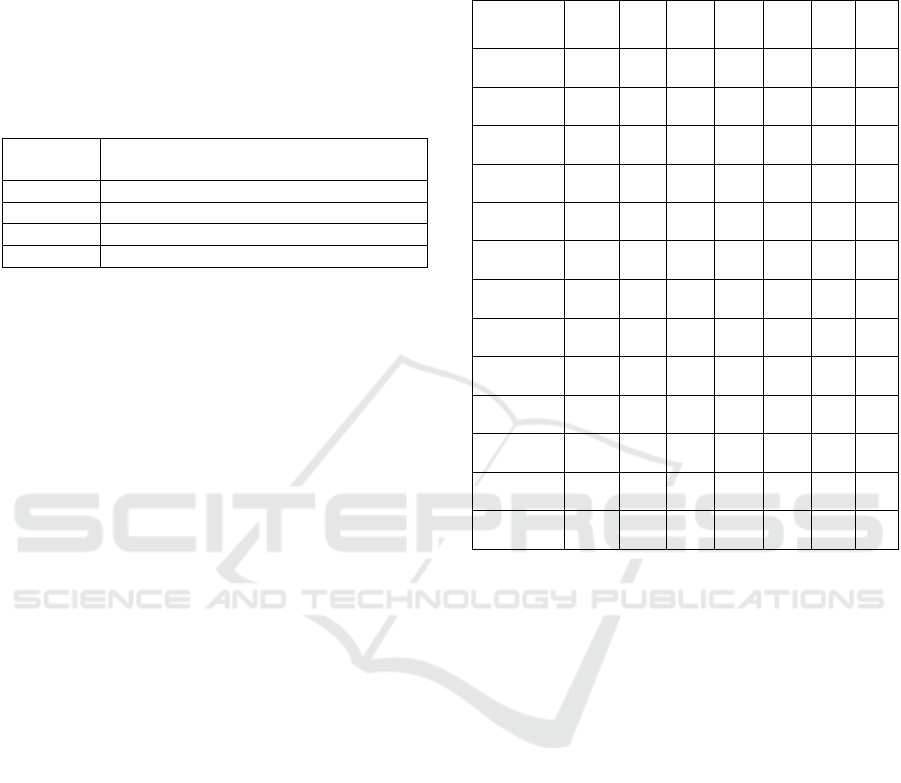
Table 2 shows the values of the model which
corresponds coefficients, standard coefficients,
standard error values, Wald values, P-Value which
we can derive predictive value. This tables shows the
variables or extracted topics represents as Var, grade
level (Grade), Quarter(Quar), and predictive features
Coefficient(Coeff.) , Standard Coefficient (Std.
Coeff.), Standard Error (Std Err.), Wald, and
subsequently the p-value).
Table 2. The Values of the Model.
Var. Grade Quar.Coeff.
Std.
Coeff.
Std
Err. Wald
p-
value
Phy.Scie 11 4 -17.11 -9.11 7.03 -2.43 0.01
PerDev 11 2 -4.1 -15.61 1.2 -3.42 0
UCSP 11 1 -4.89 -8.07 1.91 -2.56 0.01
CLPW 12 1 -1.93 -6.71 0.9 -2.14 0.03
Philosophy 12 2 -1.36 -13.67 0.51 -2.63 0.01
EAPP 11 2 -30.97 -10.6 11.79 -2.63 0.01
Filipino 11 3 -0.65 -4.32 0.75 -0.87 0.38
MIL 12 1 -1.04 -6.06 0.58 -1.78 0.08
ELS 11 2 2.75 3.76 3.3 0.84 0.4
Filipino 11 2 0.46 3.01 0.39 1.18 0.24
EAPP 11 1 18.32 7.88 9.45 1.94 0.05
Filipino 11 4 0.15 1.24 0.69 0.22 0.82
Arts 12 2 2.7 12.95 0.57 4.73 0
Extract Predictive Features Affecting NAT. The
subjects listed in Table 3, were among the 14
variables extracted by the feature selection technique
used in this study; among them, there are repeated
subjects that vary in quarter, so the technique selected
a total of 14 variables. The assumptions of the study
require these features.
Effects of Various Academic Subject in National
Achievement Test. When the value of the
independent variable rises, so does the mean of the
dependent variable. According to the data, when the
grade of the following subjects improves, the mean of
the National Achievement Test rises. The feature
selection algorithm clearly chose two identical
subjects with positive coefficients, as shown in Table
3. Students' performance in Filipino at the same grade
level and from various quarters had an unexpected
impact on the National Achievement Test. It can be
argued that as a student's Filipino grade rises, so does
the mean of the National Achievement Test. The
larger the positive correlation coefficient is in terms
of its value and how it influences factors, the more
likely children will score higher on the National
Achievement Test. In Quarter 2, Filipino had a value
Modelling the Effect of Academic Performance on National Achievement Test (NAT)
519
of 0.46, and in Quarter 4, it had a value of.15. Quarter
2 was found to have a higher influence than Quarter
4, which only had a.15 effect.
Table 3: Positive Coefficient.
Subjects Grade Quarter Coeff.
Philosophy 12 1 1.13
Filipino 11 2 0.46
Filipino 11 4 0.15
English for Academic and
Professional Purposes
11 1 18.32
Earth and Life Science 11 2 2.75
Arts 12 2 2.70
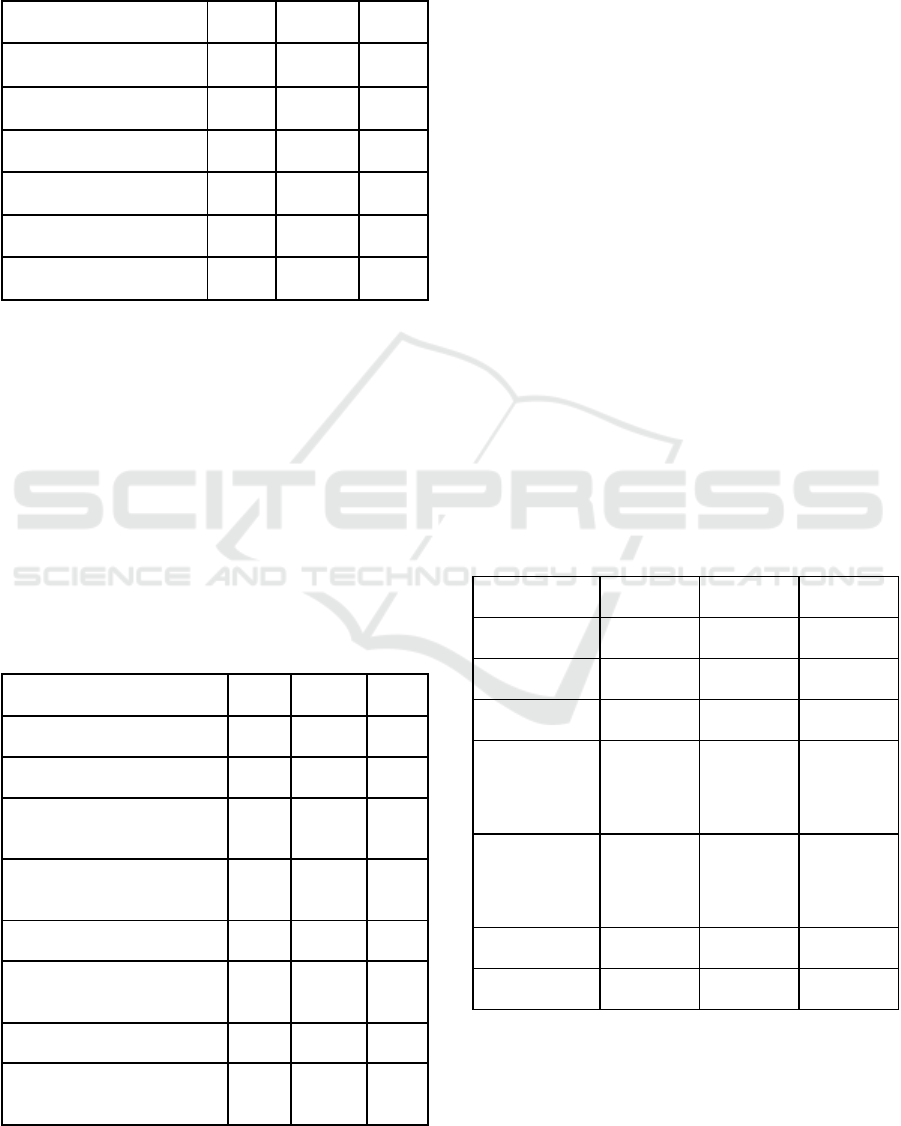
The negative coefficient in Table 4 indicates that
as the grades in the following topics rise, the mean of
the National Achievement Test Scores falls. If the
estimated coefficient is close to zero, the predictor's
effect is small. When the value of a student's
performance grade grows, the mean of the National
Achievement Test Scores tends to fall, as seen in the
table below. Among the disciplines provided are
Physical Sciences, Personal Development,
Understanding Culture, Society, and Politics, 21st
Century Literature in the Philippines and the World,
Philosophy, English for Academic Purposes, Filipino,
and Media and Information Literacy.
Table 4: Negative Coefficient.
Subjects Grade Quarter Coeff.
Physical Science 11 4 -17.11
Personal Development 11 2 -4.10
Understanding Culture
Society and Politics
11 1 -4.89
21st Century Literature in the
Philippines and the World
12 1 -1.93
Philosophy 12 2 -1.36
English for Academic and
Professional Purposes
11 2 -30.97
Filipino 11 3 -0.65
Media and Information
Literacy
12 1 -1.04
Strong Effect of Student Grades to the National
Achievement Test. The standardized beta coefficient
measures the strength of each independent and
dependent variable's effect; the larger the beta
coefficient's absolute value, the stronger the effect.
Physical Sciences in Grade 11 from Quarters 1 and
English for Academic and Professional Purposes in
Grade 11 from Quarters 1 had the greatest beta
coefficients, indicating a stronger linear association.
The table below shows that Filipino subjects in
quarters 3, 2, and 4 have the closest beta coefficient
to zero, and Filipinos in the third quarter had the
highest absolute beta coefficient value. This could
indicate that in the National Achievement Test, this
subject has a greater impact.
Academic Performance Per Quarter May Affect
the National Achievement Test. Table 5 shows the
results. The feature extraction algorithm chose
Filipino, English for Academic and Professional
Purposes, and Philosophy as subjects. Each quarter,
we can only compare three subjects; the same
subjects are from the same grade level and differ each
quarter. Based on the coefficient value, the algorithm
chose Filipino in grade 11 from quarters 3,2, and 4,
English for Academic and Professional Purposes in
grade 11 from quarters 2 and 1, and Philosophy in
grade 12 from quarters 2 and 1.
Table 5: The same subjects extracted.
Variables Grade Quarter Coeff.
Filipino 11 3 -0.65
Filipino 11 2 0.46
Filipino 11 4 0.15
English for
Academic and
Professional
Purposes
11 2 -30.97
English for
Academic and
Professional
Purposes
11 1 18.32
Philosophy 12 2 -1.36
Philosophy 12 1 1.13
In Quarter 3, the value of the Filipino indicates
that as the value of the Filipino grows, the mean of
the National Achievement Test tends to fall. On the
other hand, Filipino in quarters 2 and 3 may indicate
A2E 2022 - Special Session on Analytics in Educational Environments
520

that as the grade Filipino in these quarters rises, the
mean of the National Achievement Test will climb.
When the grade in English for Academic and
Professional Purposes in Quarter 2 of grade 11
improves, the mean of the National Achievement Test
decreases. As the grade of English for Academic and
Professional Purposes in Quarter 1 of grade 11
improves, the mean of the National Achievement Test
will increase. When the grade of Philosophy in
Quarter 2 rises, the mean of the National
Achievement Test normally falls. The mean of the
National Achievement Test will improve if the grade
in Philosophy in Quarter 1 improves.
Validation. The VLM (Very Low Mastery) and LM
(Low Mastery) anticipated values are shown in the
Confusion Matrix (Low Mastery). As indicated in
Table 6, 42.85% of the population received a National
Achievement Test rating of Very Low Mastery, with
a yield sensitivity of 96.33 percent and a fair kappa
rating of.852.
Table 6: Confusion Matrix.
Observed Y Predicted Y Accuracy
VLM True LM True
VLM True
42.85 0.26% 96.33%
LM False
7.15 49.74 87.12
Overall Accuracy
92.59%
5 CONCLUSION AND
RECOMMENDATION TO
FUTURE WORK
We discovered ten subjects that had a significant
finding on the National Achievement Test when
creating the model. Physical Science, Personal
Development, Culture, Society, and Politics, 21st
Century Literature in the Philippines and the World,
Philosophy, English for Academic and Professional
Purposes, Filipino, Media and Information Literacy,
Earth and Life Sciences, and Arts are among the
subjects covered.
We can deduce that not only the subjects differ,
but also the quarters in which the subject was taken
may have an impact on the National Achievement
Test score. Students' performance in Filipino at the
same grade level and from various quarters had an
unexpected impact on the National Achievement
Test. It can be argued that as a student's Filipino grade
rises, so does the mean of the National Achievement
Test. In comparison to Filipinos in Quarter 4,
Filipinos in Quarter 2 have a bigger impact.
The mean of the National Achievement Test
Scores tends to decrease as the value of the students'
performance grade in Physical Sciences, Personal
Development, Understanding Culture, Society, and
Politics, 21st Century Literature in the Philippines
and the World, Philosophy, English for Academic
Purposes, Filipino, and Media and Information
Literacy rises. Filipino subjects from quarters 3,2, and
4 have a stronger effect in the National Achievement
Test.
According to the algorithm, the only three
disciplines with the same quarter may have a
significant impact on the National Achievement Test
are Filipino, English for Academic Purposes, and
Philosophy. We can presume that quarterly grades or
academic achievement in the listed areas may have an
impact on the National Achievement Test outcome
because the coefficients for these topics vary each
quarter.
The researcher may suggest studying broader
datasets and including scores from other schools,
such as one division or region. Another study
including the use of several algorithms and
comparing the results of various algorithms could
yield positive results.
ACKNOWLEDGEMENTS
I'd like to thank Central Mindanao University for
providing funds for this research. I'd also like to thank
my colleagues from the College of Information
Sciences and Computing for all of their assistance. As
motivation to continue my studies, I dedicate this
letter to my family and friends. For guidance and
clear thinking for this research, I thank to the
Almighty God.
REFERENCES
Abu Saa, A. (2016). Educational Data Mining & Students’
Performance Prediction. International Journal of
Advanced Computer Science and Applications, 7(5).
https://pdfs.semanticscholar.org/b280/216a1d63015afc
6a3d1aac9595aeb2b7dd5a.pdf
Alyahyan, E., & Düştegör, D. (2020). Predicting academic
success in higher education: literature review and best
practices. International Journal of Educational
Technology in Higher Education. 10.1186/s41239-020-
0177-7
Amazona, M., & Hernandez, A. (2019, May 4). Modelling
Student Performance Using Data Mining Techniques:
Modelling the Effect of Academic Performance on National Achievement Test (NAT)
521

Inputs for Academic Program Development.
Proceedings of the 2019 5th International Conference
on Computing and Data Engineering, 36-40.
10.1145/3330530.3330544
Arshad, M., Zaidi, S. M. I. H., & Mahmood, K. (2015).
Self-Esteem & Academic Performance among
University Students. Journal of Education and
Practice, 6(1). 2222-288X
Baker, R. S. (2007, April 29). Modeling and understanding
students' off-task behavior in intelligent tutoring
systems. Proceedings of the SIGCHI conference on
Human factors in computing systems, 1059-1068.
https://scholar.google.com/citations?view_op=view_ci
tation&hl=en&user=hvs8PEoAAAAJ&citation_for_vi
ew=hvs8PEoAAAAJ:9ZlFYXVOiuMC
Dabhade, P., Agarwal, R., Alameen, K.P., Fathima, A.T.,
Sridharan, R., & Gopakumar, G. (2021). Educational
data mining for predicting students’ academic
performance using machine learning algorithms. 47,
5260-5267. https://doi.org/10.1016/j.matpr.2021.05.646
Ebio, Jr., F. M. (2016, February). Determinants of The
National Achievement Test Results of The Secondary
Schools In The Province of Biliran, Philippines.
IJESRT. Retrieved January 14, 2022, from
http://citeseerx.ist.psu.edu/viewdoc/download?doi=10.
1.1.742.543&rep=rep1&type=pdf
Hamsa, H., Indiradevi, S., & Kizhakkethottam, J. J. (2016).
Student Academic Performance Prediction Model
Using Decision Tree and Fuzzy Genetic Algorithm.
Procedia Technology, 25, 326-332.
10.1016/j.protcy.2016.08.114
Hand, D. J. (2012, November 20). Principles of Data
Mining. 621–622. https://doi.org/10.2165/00002018-
200730070-00010
López-Zambrano, J., Alfonso, J., Torralbo, L., & Romero,
C. (2021). Early Prediction of Student Learning
Performance Through Data Mining: A Systematic
Review. Psicothema, 33, 456-465.
10.7334/psicothema2021.62
Mahmoud, L. (2019, August 2). Prediction of Student's
performance by modelling small dataset size -
International Journal of Educational Technology in
Higher Education. International Journal of Educational
Technology in Higher Education. Retrieved January 24,
2022, from https://educationaltechnologyjournal.
springeropen.com/articles/10.1186/s41239-019-0160-
3#citeas
Regio,, M. S., Musse, S. R., Manssour, I. H., & Rodrigues,
D. (2021). Data Mining on the Prediction of Student’s
Performance at the High School National Examination.
n Proceedings of the 13th International Conference on
Computer Supported Education (CSEDU 2021), 1, 92-
99. 10.5220/0010408000920099
Romero, C., & Ventura, S. (2010, July 26). Educational
Data Mining: A Review of the State of the Art. 40(6),
601 - 618. 10.1109/TSMCC.2010.2053532
Shahiri, A. M., Husain, W., & Rashid, N. A. (2015). A
Review on Predicting Student's Performance Using
Data Mining Techniques. Procedia Computer Science,
72, 414-422. 0.1016/j.procs.2015.12.157.
Sorour, S. E., Mine, T., Goda, K., & Hirokawa, S. (2015,
March). A Predictive Model to Evaluate Student
Performance. Journal of Information Processing,
23(2), 192-201. 10.2197/ipsjjip.23.192.
A2E 2022 - Special Session on Analytics in Educational Environments
522
