
A Spatially Detailed Approach to the Assessment of Rooftop Solar
Energy Potential based on LiDAR Data
Mohammad Aslani
1
and Stefan Seipel
1,2
1
Department of Computer and Geo-spatial Sciences, University of G¨avle, G¨avle, Sweden
2
Division of Visual Information and Interaction, Department of Information Technology,
Uppsala University, Uppsala, Sweden
Keywords:
Deep Learning, Clustering, Segmentation, Solar Energy, LiDAR.
Abstract:
Rooftop solar energy has long been regarded as a promising solution to cities’ growing energy demand and en-
vironmental problems. A reliable estimate of rooftop solar energy facilitates the deployment of photovoltaics
and helps formulate renewable-related policies. This reliable estimate underpins the necessity of accurately
pinpointing the areas utilizable for mounting photovoltaics. The size, shape, and superstructures of rooftops
as well as shadow effects are the important factors that have a considerable impact on utilizable areas. In
this study, the utilizable areas and solar energy potential of rooftops are estimated by considering the men-
tioned factors using a three-step methodology. The first step involves training PointNet++, a deep network for
object detection in point clouds, to recognize rooftops in LiDAR data. Second, planar segments of rooftops
are extracted using clustering. Finally, areas that receive sufficient solar irradiation, have an appropriate size,
and fulfill photovoltaic installation requirements are identified using morphological operations and predefined
thresholds. The obtained results show high accuracy for rooftop extraction (93%) and plane segmentation
(99%). Moreover, the spatially detailed analysis indicates that 17% of rooftop areas are usable for photo-
voltaics.
1 INTRODUCTION
Solar energy generated by rooftop photovoltaics is a
practical renewable energy resource that may provide
a portion of the energy demand of buildings in urban
areas (Joshi et al., 2021). Rooftop photovoltaics con-
vert each building from a passive power consumer to
an active power provider with low investment, thanks
to the steep decline in their deployment costs (B
´
odis
et al., 2019).
However, not all rooftop areas are utilizable for
photovoltaic deployment. Utilizable rooftop areas
are limited by various factors, the most important of
which are the shape, orientation, and superstructures
of roofs, as well as occlusion (Thebault et al., 2020).
A rooftop with proper orientation and no superstruc-
tures or surrounding objects offers high solar energy
potential. In contrast, a north-facing rooftop with
many superstructures surrounded by tall buildings (in
the northern hemisphere) may not offer high solar en-
ergy potential. In addition, the rooftop’s geographical
location and the local climate conditions may affect
its solar energy potential.
Manually finding utilizable rooftop areas by con-
sidering the mentioned factors is laborious and im-
practical, particularly in large areas. Analyzing Li-
DAR datasets has been recognized as a potential way
to automate this laborious process (Gassar and Cha,
2021). LiDAR datasets provide the 3D spatial profiles
of the area and allow for automatic computation of
characteristics of rooftops and their surrounding ob-
jects, such as area, height, tilt, and azimuth. In this
context, one of the common methods of estimating
the total utilizable areas is by applying a set of coef-
ficients that consider roof types (e.g., flat or tilted),
obtained from LiDAR datasets (Byrne et al., 2015).
However, adjusting coefficients in heterogeneous re-
gions is nontrivial, and thus the methods may lead to
inaccurate results. To address this issue, spatially-
based methods using geographical information sys-
tems (GIS) have been proposed, in which roof shapes
are first modeled, and then their utilizable areas are
identified by considering the tilts and orientations of
roofs.
To model the shapes of roofs, it is necessary to first
extract the footprints of rooftops. Numerous tech-
56
Aslani, M. and Seipel, S.
A Spatially Detailed Approach to the Assessment of Rooftop Solar Energy Potential based on LiDAR Data.
DOI: 10.5220/0011108300003185
In Proceedings of the 8th International Conference on Geographical Information Systems Theory, Applications and Management (GISTAM 2022), pages 56-63
ISBN: 978-989-758-571-5; ISSN: 2184-500X
Copyright
c
2022 by SCITEPRESS – Science and Technology Publications, Lda. All rights reserved
niques have been suggested for rooftop extraction. In
this context, machine learning-based methods have
shown high potential. In (Aslani and Seipel, 2020),
support vector machines (SVMs) were employed to
identify rooftops. A new method named data reduc-
tion based on locality sensitive hashing (DRLSH) was
proposed to automatically select instances for training
SVMs. In (Aslani and Seipel, 2021), another instance
selection method for SVMs was developed, and it was
tested on a dataset for rooftop extraction. In (Shin
et al., 2022), PointNet++, a deep network, was used
to identify rooftops from LiDAR datasets.
Once rooftops have been extracted, their shape
(form) can be modeled. In (Lingfors et al., 2017),
roofs were modeled using a predefined library of roof
shapes for the purpose of estimating solar energy po-
tential. More specifically, a model library that con-
tains common roof shapes (e.g., gable and shed) was
first defined, and the shape that best matches the cor-
responding point clouds was chosen. Following this
method, in (Mohajeri et al., 2018), SVMs were used
to choose the best-fitting roof shape from a predefined
library. However, this type of roof shape modeling
may overlook roof superstructures (e.g., chimneys),
which play an important role in identifying utilizable
areas. In (Sampath and Shan, 2010), another type of
approach was used in which roofs are modeled by ag-
gregating their constituent planar patches (roof faces)
extracted by plane segmentation. They used fuzzy k-
means clustering for plane segmentation. To enhance
clustering, a planarity test that distinguishes planar
from non-planar points was incorporated. In (Chen
et al., 2014), a RANSAC-like algorithm was used for
plane segmentation. In (Huang et al., 2015), region
growing was utilized for segmenting planar patches.
Unsuitable roof faces were then removed by applying
area, slope, aspect, and solar irradiation thresholds.
This approach does not require a predefined library of
roof shapes and can model any polyhedral roof shape.
Most of the current spatially-based methods for
identifying utilizable areas are limited to manual dig-
itization or simplified roof shape modeling, and they
may not consider shadow effects. This research iden-
tifies utilizable areas with more spatial details by
considering roof shapes, roof superstructures, and
shadow effects. Our methodology uses LiDAR data
to assess the solar energy potential of rooftops in any
area. It aims to automatically (a) extract rooftops us-
ing a deep learning-based method, (b) segment planar
rooftop patches using a clustering-based method, and
(c) identify utilizable areas using morphological op-
erations.
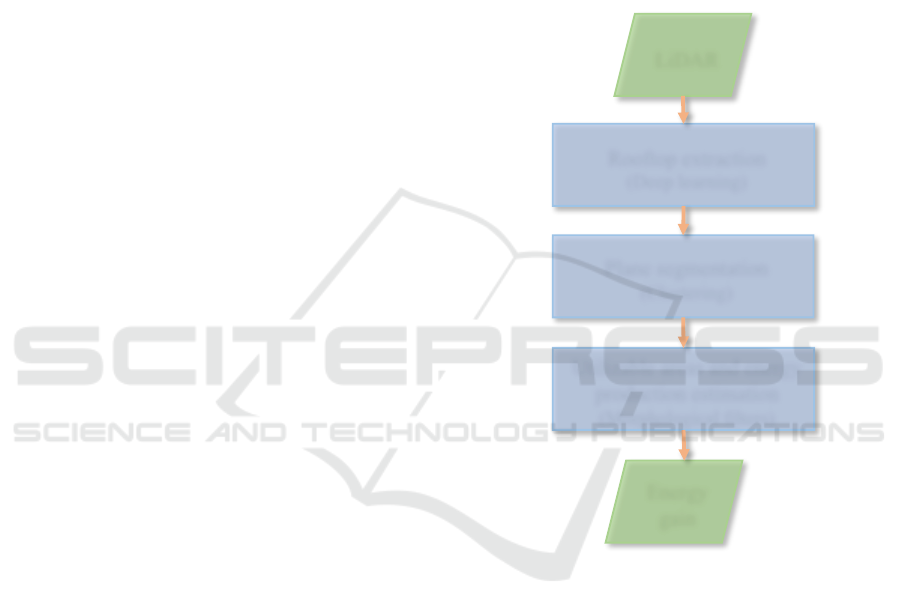
2 METHODOLOGY
This section describes our methodology for automati-
cally assessing rooftop solar energy potential. It lever-
ages LiDAR datasets and assumes that they have suf-
ficient density to model the shape and desired super-
structures of roofs. LiDAR data contain 2.5D in-
formation about an area that can be used to model
rooftops and solar irradiation. The methodology con-
sists of three main steps (Figure 1), explained in fur-
ther detail in the following subsections.
LiDAR
Rooftop extraction
(Deep learning)
Plane segmentation
(Clustering)
Utilizable areas and energy
production estimation
(Morphological filters)
Energy
gain
Figure 1: Overview of the methodology.
2.1 Rooftop Extraction
Extracting rooftops is required to determine the suit-
able areas where photovoltaics may be mounted.
Rooftop extraction is a semantic segmentation task in
which the points that comprise rooftops are identified.
Owing to the remarkable advancements of deep learn-
ing methods and their satisfactory performance in do-
ing semantic segmentation tasks, they are used in this
step. In particular, we use PointNet++ to segment
rooftops in LiDAR data (Qi et al., 2017). PointNet++
is a hierarchical neural network for semantic segmen-
tation of unorganized point data, and it enables multi-
scale point feature learning. It has the potential to be
trained without requiring parameters that are specific
to objects in LiDAR. A PointNet++ network con-
A Spatially Detailed Approach to the Assessment of Rooftop Solar Energy Potential based on LiDAR Data
57

sists of three layers: sampling, grouping, and mini-
PointNet layers. The sampling layer chooses a set of
points that forms the centroids of local regions. The
grouping layer constructs local regions sets around
the centroids. The mini-PointNet layer abstracts the
sets of local features into higher-level representations
using a series of convolution, normalization, relu, and
max-pooling layers. Please refer to (Qi et al., 2017)
for more details. To train PointNet++ for rooftop ex-
traction, we use labeled point clouds containing those
features (please see Section 3).
2.2 Plane Segmentation
In this step, the constituent planar patches of rooftops
are segmented. This step is required as photovoltaics
are installed by considering planar segments of roofs.
A digital surface model (DSM) is created from the
recognized rooftop points using interpolation. This
conversion makes the plane segmentation procedure
easier.
Plane segmentation is performed based on clus-
tering the normal vectors of pixels. A normal vector
of a pixel is perpendicular to the surface at the pixel,
and it is computed by fitting a plane to the pixel and
its neighbors. Pixels on the same planar patch have
similar normal vectors, and thus, by grouping them
together, planar patches can be identified. Some pix-
els in each planar segment may, however, have nor-
mal vectors that are inconsistent with those of other
pixels in the same segment. These pixels are known
as non-planar pixels as they are placed in the vicin-
ity of more than one plane. Including these pixels in
clustering may disturb the creation of planar segments
since they shatter the boundaries of clusters of normal
vectors. As a result, non-planar pixels must be iden-
tified and excluded from clustering. The planarity of
each pixel is evaluated based on the Eigenvalues of a
3D covariance matrix of the pixel and its neighbors
(Awrangjeb and Fraser, 2014).
Initial planar segments are created by clustering
the normal vectors of planar pixels. To delineate clus-
ters, a minimum density divisive clustering (MDDC)
algorithm was used (Tasoulis et al., 2016). Its adapt-
ability (i.e., it requires no input parameters) and high
computational efficiency make it suitable for handling
large-scale plane segmentation. Since segmentation
using MDDC does not consider the spatial connectiv-
ity of pixels, each resulting patch may comprise mul-
tiple parallel planar segments that are spatially sep-
arated. To split multi-part patches, Euclidean clus-
tering based on pixel coordinates is applied (Rusu,
2009). Finally, the non-planar pixels, initially ex-
cluded, are assigned to the best segment using re-
gion growing. In this way, the problem of over-
segmentation that may arise in clustering is also re-
solved. This plane segmentation method can identify
all planar segments of a rooftop, even superstructures,
to the extent that the spatial resolution of the DSM al-
lows.
2.3 Utilizable Areas and Energy
Production Estimation
This step involves computing the solar energy poten-
tial of rooftops. As photovoltaics cannot be installed
over the entire area of a rooftop, it is necessary to
ascertain areas utilizable for photovoltaics to avoid
overestimation of energy production. Utilizable areas
are defined as parts of rooftops where photovoltaics
can be reasonably installed. In this research, each pla-
nar segment is spatially scrutinized to identify its uti-
lizable areas.
Parts of planar segments should be kept free of
photovoltaics to ease accessibility as an installation
requirement of panels. Often, there should be a dis-
tance between the edge of photovoltaics and the seg-
ment that is known as service areas. To exclude these
areas, we utilize a morphological erosion operation
with a circular structuring element whose radius is
equal to the width of the service areas (Sundararajan,
2017). The erosion operation shrinks the roof face by
the width of the service area. In addition to service
areas, there might be some areas of planar segments
that are too small for a photovoltaic to fit, and these
areas should be excluded. To do so, the algorithm
suggested in (Aslani and Seipel, 2022) is employed in
this paper. It iteratively applies a series of morpho-
logical opening operations and then aggregates their
results. The structuring elements of the opening op-
erations represent a photovoltaic with different rota-
tions. The length and width of the structural elements
are the same length and width as the photovoltaics that
are being used.
After removing geometrically unsuitable areas,
the remaining planar segments are evaluated in terms
of solar irradiation. The segments whose average
solar irradiation is below a specific threshold SI are
removed. This is because photovoltaics are usually
not installed on rooftop areas with low solar irradi-
ation. In this way, planar segments that are mainly
in shadow or those with unsuitable tilts (e.g., too
steep) or azimuths (e.g., north-facing) are discarded.
It should be noted that the solar irradiation of each
segment is estimated using the solar model of Ar-
cGIS Desktop (Fu and Rich, 2000; Rich et al., 1994).
The solar model incorporates viewshed analysis to ac-
count for shadowing effects. The viewshed analy-
GISTAM 2022 - 8th International Conference on Geographical Information Systems Theory, Applications and Management
58

sis generates a Boolean image indicating the extent
to which the sky is obscured by surrounding objects
as seen from a certain place in the DSM. In addition
to occlusion, the solar model takes into account site
orientation, atmospheric effects, and variations in the
sun’s position, making it a reliable tool in estimating
global solar irradiation.
After the utilizable rooftop surfaces are extracted,
the energy potential of rooftops is determined. The
total solar electricity yield of a rooftop is calculated
according to Equation 1. S
i
and T
i
are the total solar
irradiance (in kWh/m
2
) and the tilt angle of the i-th
utilizable segment, e and p are the efficiency and per-
formance ratio of the photovoltaics, d is the area of
each pixel of the DSM (in m
2
), and N is the number
of utilizable segments of a rooftop. E is the total solar
electricity yield of a rooftop in kWh.
E = d · e · p ·
N
X
i=1
S
i
cosT
i
(1)
3 DATASETS
This study makes use of two different datasets. Day-
ton Annotated LiDAR Earth Scan (DALES) is the first
dataset (Varney et al., 2020) used to train and evalu-
ate PointNet++ for rooftop extraction. It is a publicly
available dataset, and it contains an extensive collec-
tion of LiDAR data from a wide range of environ-
ments, making it ideal for training deep networks. It
comprises 40 scenes that were manually labeled. The
second dataset is part of Uppsala city in Sweden, and
its LiDAR point cloud was produced by Uppsala mu-
nicipality
1
. It is used for plane segmentation and so-
lar energy estimation. We manually labeled planar
segments of rooftops to produce ground truth data for
plane segmentation evaluation. Figure 2 shows some
scenes from the datasets.
4 EXPERIMENTAL SETUP,
RESULTS, AND DISCUSSION
In this section, the methodology is applied to the
datasets, and the results are presented and discussed.
As mentioned in Section 2.1, the first step of the
methodology is to extract rooftops, which is done by
utilizing PointNet++. 29 scenes out of 40 scenes from
the DALES dataset are used for training, and the re-
maining ones are used for testing. To efficiently take
advantage of the dataset, each scene is divided into
1
www.uppsala.se
small, non-overlapping tiles with a size of 50-by-50
meters. Each tile is then downsampled to contain only
9000 points, speeding up the training process. To train
the deep network, the Adam optimizer with a gradi-
ent decay rate of 0.9 is used (Kingma and Ba, 2015).
The maximum number of training epochs is set to 20,
with each epoch consisting of 485 iterations. At the
beginning of the training, the learning rate is set to
0.0005 and is reduced by a factor of 0.1 in epoch 10.
Regularization is used to minimize overfitting, and the
regularization factor is set to 0.1 (Murphy, 2012). The
output of PointNet++ is a per-point prediction, show-
ing which points are part of rooftops.
By applying the trained deep network to the test
scenes and comparing its results (predicted rooftops)
with the ground truth labels, the performance of the
trained deep network for rooftop extraction is eval-
uated. We use accuracy and intersection over union
(IOU) as two metrics to quantitatively measure the de-
gree to which the predicted and actual labels are sim-
ilar. These metrics are calculated according to Equa-
tions 2 and 3, where T P, FP, and FN are the numbers
of true positives, false positives, and false negatives,
respectively.
Accuracy =
T P
T P + FN
(2)
IOU =
T P
T P + FP + FN
(3)
Table 1 shows the evaluation results of rooftop ex-
traction in the test scenes of the DALES dataset. We
observe that the trained deep network has an accuracy
of 92.60% and an IOU of 87.38% on average, show-
ing its satisfactory performance in rooftop extraction.
Thus, the trained deep network can be applied to any
area. We employ it in the extraction of rooftops from
the second dataset. Figure 3 shows some examples
of rooftop extraction from the second dataset. The
boundaries of rooftops have been extracted and reg-
ularized using α-shape (Akkiraju et al., 1995) and
polyline compression (Gribov, 2019) algorithms, re-
spectively. The figure illustrates that rooftops have
been successfully separated from other objects. How-
ever, there are some cases where the trained deep net-
work fails to correctly identify rooftops. Figure 4
shows an example where the main part of a rooftop
has been missed.
Table 1: Rooftop extraction evaluation results.
Accuracy (%) IOU (%)
Average 92.98 87.75
In the next step, planar patches of rooftops are seg-
mented using clustering, followed by region growing.
A Spatially Detailed Approach to the Assessment of Rooftop Solar Energy Potential based on LiDAR Data
59
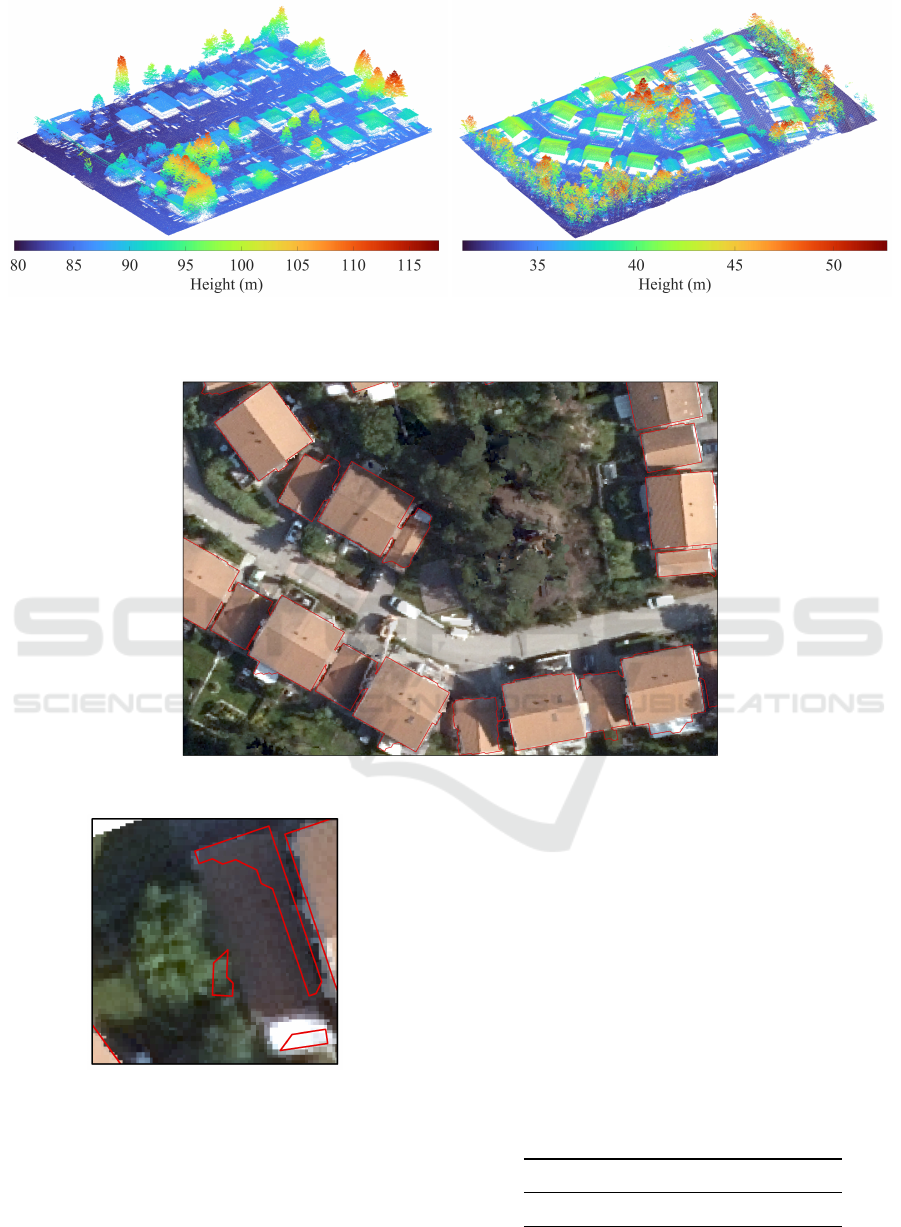
(a) (b)
Figure 2: Sample scenes from dataset 1 (a) and dataset 2 (b).
Figure 3: Some detected rooftops. The background orthophoto is only for visualization purposes.
Figure 4: Partially detected rooftop.
The MDDC algorithm used for clustering normal vec-
tors is adaptive, that is, it does not require any input
parameters. The height and angle thresholds used in
region growing were set to 10 cm and 7
◦
, obtained
using trial and error in a small part of the dataset.
Figure 5 shows plane segmentation results of some
rooftops. As seen in the figure, the plane segmenta-
tion method has been successful in the identification
of roof faces. Minor superstructures, including vents
and small chimneys, that cannot be recognized as in-
dependent planar segments appear as holes in the seg-
ments. In this way, the impact of superstructures can
be considered in the identification of utilizable areas.
We quantify the performance of plane segmentation
by comparing its results with the ground truth data.
Table 2 shows the performance of plane segmentation
in terms of accuracy and IOU. It suggests that most
planar segments have been accurately identified and
that the method is effective.
Table 2: Plane segmentation evaluation results.
Accuracy (%) IOU (%)
Average 98.69 98.22
GISTAM 2022 - 8th International Conference on Geographical Information Systems Theory, Applications and Management
60
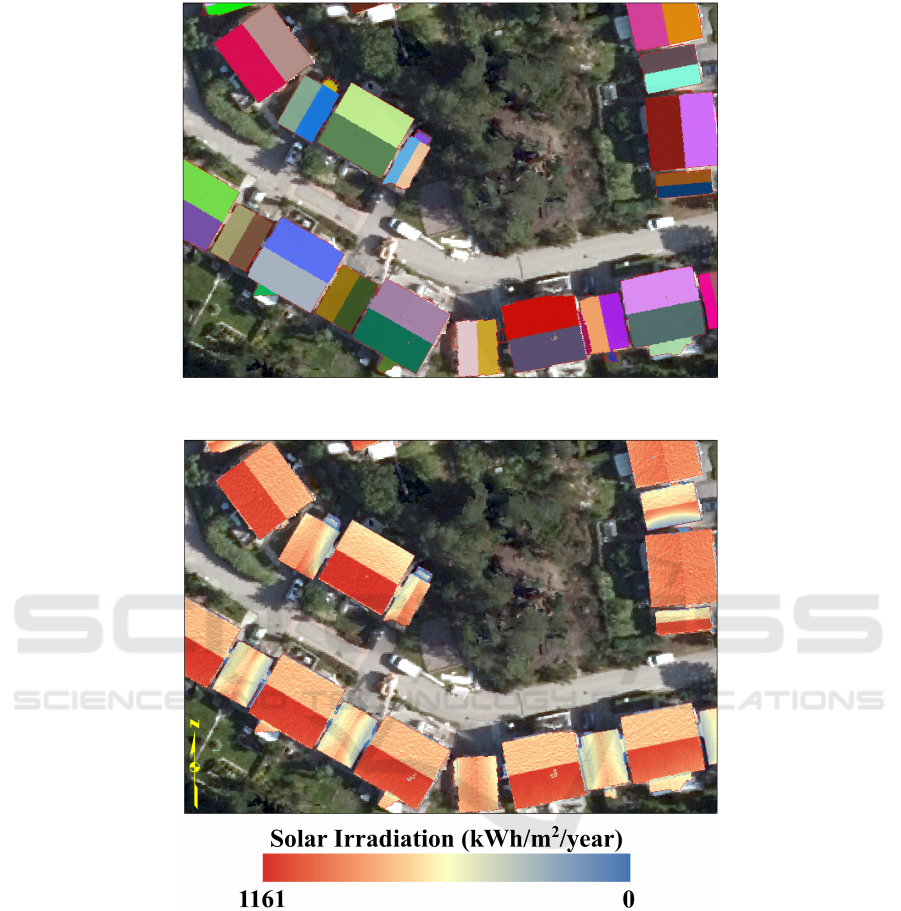
Figure 5: Plane segmentation results of some rooftops.
Figure 6: Annual global solar irradiation of some rooftops in the study area.
To pinpoint areas utilizable for photovoltaics, a
solar irradiation map of rooftops is necessary, in
addition to planar segments. This is due to cost-
effectiveness considerations, which prevent photo-
voltaics from being installed over areas with low solar
irradiation. Figure 6 illustrates the annual global so-
lar irradiation distribution across some rooftops, com-
puted with ArcGIS Desktop. The effects of shadows
cast by nearby objects can be seen in this illustration.
Utilizable areas of rooftops are identified by elim-
inating service areas as well as geometrically unsuit-
able and low-irradiated areas. To remove service ar-
eas, an erosion operation whose structuring element
has a radius of 30 cm is used. To eliminate areas that
cannot accommodate a photovoltaic panel, a series of
opening operations are used. The size of the struc-
turing elements of opening operations is set to 1.7 m
× 1.0 m, which is the common size of a commercial
rooftop photovoltaic panel. Moreover, the solar ir-
radiation threshold SI used to remove low-irradiated
areas is set to 1000 kWh/m
2
/year. Figure 7 shows
the resulting utilizable areas of some rooftops in the
dataset. As is evident from the figure, the impact of
minor superstructures, highlighted by white circles,
has been considered in the identification of the uti-
lizable areas. Buffers with the width of service areas
A Spatially Detailed Approach to the Assessment of Rooftop Solar Energy Potential based on LiDAR Data
61
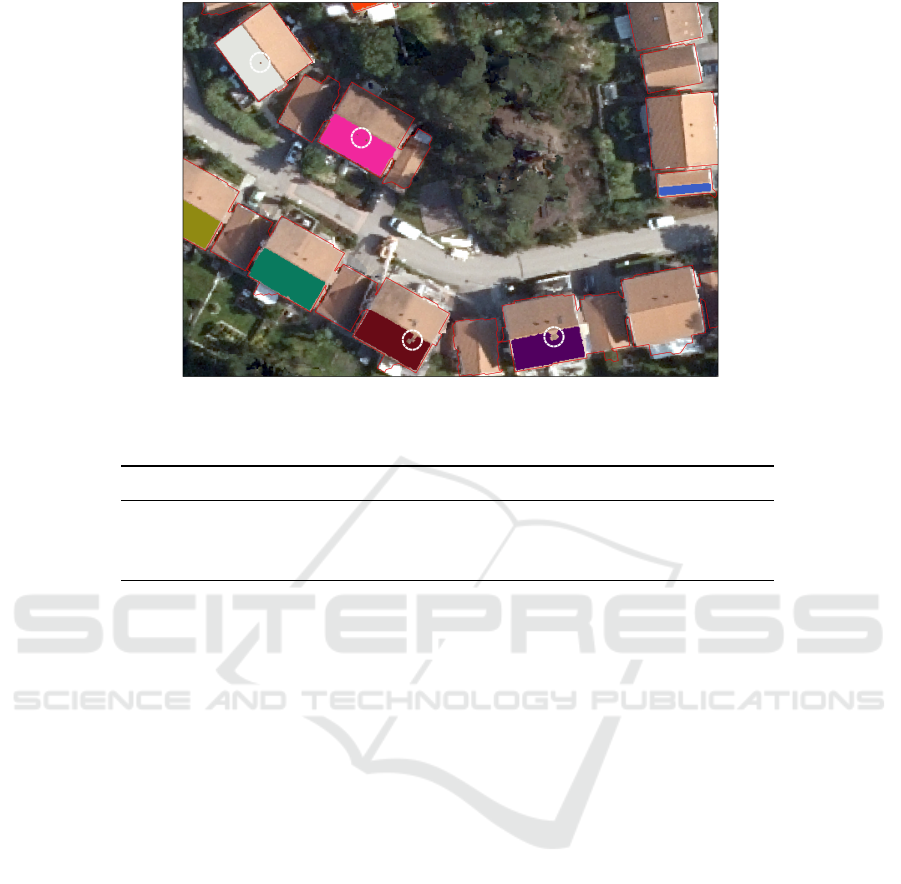
Figure 7: Utilizable areas of rooftops in the sample scene. White circles show the impact of superstructures.
Table 3: Comparing rooftop regions with utilizable regions over the entire study area.
Total area (m
2
) Total annual electricity yield (kWh)
Utilizable regions 699.83 90104.87
Entire rooftop regions 4224.43 403505.43
Ratio 16.57% 22.33%
have been excluded from planar segments. Moreover,
some large planar segments have been discarded due
to a lack of solar irradiation. It can be inferred that
the methodology is able to consider the shape, orien-
tation, and superstructures of rooftops as well as oc-
clusions in the identification of the utilizable areas.
The total area (in m
2
) and annual electricity yield
(in kWh) for the rooftops and their utilizable parts
in the entire study area are shown in Table 3. The
electricity yield has been estimated using Equation 1,
where the efficiency and performance ratio of the pho-
tovoltaics were set to 0.16 and 0.75, respectively. Ac-
cording to this table, the utilizable regions based on
spatially detailed analysis comprise a small propor-
tion of the entire rooftops (16.6%), hence assessing
the solar energy potential of buildings based on the
entire rooftop areas may lead to an overestimation.
5 CONCLUSION
In this study, a three-step methodology was developed
to estimate the solar energy potential of rooftops.
Rooftops were recognized in LiDAR point clouds us-
ing deep learning. MDDC and Euclidean cluster-
ing were employed to delineate the initial planar seg-
ments of rooftops. Afterward, utilizable areas were
identified by excluding geometrically unsuitable and
low-irradiated regions as well as service areas from
the identified planar segments. Solar electricity yield
of utilizable areas was finally estimated.
Rooftop extraction and plane segmentation were
validated using ground truth data. The validation re-
sults showed that rooftops and their planar segments
were successfully extracted with 93% accuracy and
88% IOU and 99% accuracy and 98% IOU, respec-
tively. It was observed that the shape, orientation, and
superstructures of rooftops and shadow effects were
satisfactorily considered in the identification of utiliz-
able areas, and thus the methodology can provide a vi-
able means for practically valid rooftop solar energy
potential estimation. The methodology is beneficial
for facilitating investment decisions on photovoltaics
deployment, particularly in areas where 3D city mod-
els are unavailable.
ACKNOWLEDGEMENTS
This work was partly funded by the European
Regional Development Fund (ERDF), contract ID
20201871. The authors would like to thank Uppsala
municipality for providing the data for this study.
GISTAM 2022 - 8th International Conference on Geographical Information Systems Theory, Applications and Management
62

REFERENCES
Akkiraju, N., Edelsbrunner, H., Facello, M., Fu, P., M
¨
ucke,
P., E., and Varela, C. (1995). Alpha Shapes: Definition
and Software. In Proceedings on International Com-
putational Geometry Software Workshop, Minneapo-
lis.
Aslani, M. and Seipel, S. (2020). A fast instance selec-
tion method for support vector machines in building
extraction. Applied Soft Computing, 97:106716.
Aslani, M. and Seipel, S. (2021). Efficient and decision
boundary aware instance selection for support vector
machines. Information Sciences, 577:579–598.
Aslani, M. and Seipel, S. (2022). Automatic identification
of utilizable rooftop areas in digital surface models for
photovoltaics potential assessment. Applied Energy,
306, Part A:118033.
Awrangjeb, M. and Fraser, C. S. (2014). Automatic Seg-
mentation of Raw LIDAR Data for Extraction of
Building Roof. Remote Sensing, 6(5):3716–3751.
B
´
odis, K., Kougias, I., J
¨
ager-Waldau, A., Taylor, N., and
Szab
´
o, S. (2019). A high-resolution geospatial assess-
ment of the rooftop solar photovoltaic potential in the
European Union. Renewable and Sustainable Energy
Reviews, 114:109309.
Byrne, J., Taminiau, J., Kurdgelashvili, L., and Kim, K. N.
(2015). A review of the solar city concept and meth-
ods to assess rooftop solar electric potential, with an
illustrative application to the city of Seoul. Renewable
and Sustainable Energy Reviews, 41:830–844.
Chen, D., Zhang, L., Mathiopoulos, P. T., and Huang, X.
(2014). A Methodology for Automated Segmenta-
tion and Reconstruction of Urban 3-D Buildings from
ALS Point Clouds. IEEE Journal of Selected Topics
in Applied Earth Observations and Remote Sensing,
7(10):4199–4217.
Fu, P. and Rich, P. M. (2000). The Solar Analyst 1.0 Man-
ual. Technical report, Helios Environmental Modeling
Institute (HEMI), USA.
Gassar, A. A. A. and Cha, S. H. (2021). Review of
geographic information systems-based rooftop solar
photovoltaic potential estimation approaches at urban
scales. Applied Energy, 291:116817.
Gribov, A. (2019). Optimal Compression of a Polyline
While Aligning to Preferred Directions. In 2019 In-
ternational Conference on Document Analysis and
Recognition Workshops (ICDARW), volume 1, pages
98–102.
Huang, Y., Chen, Z., Wu, B., Chen, L., Mao, W., Zhao, F.,
Wu, J., Wu, J., and Yu, B. (2015). Estimating Roof
Solar Energy Potential in the Downtown Area Using
a GPU-Accelerated Solar Radiation Model and Air-
borne LiDAR Data. Remote Sensing, 7(12):17212–
17233.
Joshi, S., Mittal, S., Holloway, P., Shukla, P. R.,
´
O Gal-
lach
´
oir, B., and Glynn, J. (2021). High resolu-
tion global spatiotemporal assessment of rooftop solar
photovoltaics potential for renewable electricity gen-
eration. Nature Communications, 12(1):5738.
Kingma, D. P. and Ba, J. (2015). Adam: A Method for
Stochastic Optimization. In International Confer-
ence on Learning Representations (ICLR), San Diego.
Ithaca.
Lingfors, D., Bright, J. M., Engerer, N. A., Ahlberg, J.,
Killinger, S., and Wid
´
en, J. (2017). Comparing the ca-
pability of low- and high-resolution LiDAR data with
application to solar resource assessment, roof type
classification and shading analysis. Applied Energy,
205:1216–1230.
Mohajeri, N., Assouline, D., Guiboud, B., Bill, A., Gud-
mundsson, A., and Scartezzini, J.-L. (2018). A city-
scale roof shape classification using machine learn-
ing for solar energy applications. Renewable Energy,
121:81–93.
Murphy, K. P. (2012). Machine Learning: A Probabilistic
Perspective. MIT Press, Cambridge, Massachusetts.
Qi, C. R., Yi, L., Su, H., and Guibas, L. J. (2017). Point-
Net++: Deep Hierarchical Feature Learning on Point
Sets in a Metric Space. In 31st Conference on Neural
Information Processing Systems (NIPS 2017), Califor-
nia.
Rich, P., Dubayah, R., Hetrick, W., and Saving, S. (1994).
Using Viewshed models to calculate intercepted so-
lar radiation: applications in ecology. American Soci-
ety for Photogrammetry and Remote Sensing Techni-
cal Papers, pages 524–529.
Rusu, R. B. (2009). Semantic 3D Object Maps for Everyday
Manipulation in Human Living Environments. PhD
thesis, Technical University of Munich, Munich, Ger-
many.
Sampath, A. and Shan, J. (2010). Segmentation and Recon-
struction of Polyhedral Building Roofs From Aerial
LiDAR Point Clouds. IEEE Transactions on Geo-
science and Remote Sensing, 48(3):1554–1567.
Shin, Y.-H., Son, K.-W., and Lee, D.-C. (2022). Semantic
Segmentation and Building Extraction from Airborne
LiDAR Data with Multiple Return Using PointNet++.
Applied Sciences, 12(4).
Sundararajan, D. (2017). Digital Image Processing A Sig-
nal Processing and Algorithmic Approach. Springer,
Singapore.
Tasoulis, N. G. P., Hofmeyr, D. P., and K., S. (2016).
Minimum Density Hyperplanes. Journal of Machine
Learning Research, 17(156):1–33.
Thebault, M., Clivill
´
e, V., Berrah, L., and Desthieux, G.
(2020). Multicriteria roof sorting for the integration
of photovoltaic systems in urban environments. Sus-
tainable Cities and Society, 60:102259.
Varney, N., Asari, V. K., and Graehling, Q. (2020). DALES:
A Large-scale Aerial LiDAR Data Set for Seman-
tic Segmentation. In 2020 IEEE/CVF Conference on
Computer Vision and Pattern Recognition Workshops
(CVPRW), pages 717–726.
A Spatially Detailed Approach to the Assessment of Rooftop Solar Energy Potential based on LiDAR Data
63
