
Sea Level Rise Future Predictions: A Case Study in Crete
Antigoni Panagiotopoulou
1,*
, Lemonia Ragia
1
and Froso Sarri
1,2
1
Information Management Systems Institute, Athena Research Center, Artemidos 6, Marousi 151 25, Greece
2
School of Electronic and Computer Engineering, Technical University of Crete, Kounoupidiana, Chania, Greece
Keywords: Sea Level Rise, Mediterranean Coastal Database, Coastal Data Estimator, Crete Island.
Abstract: This work presents an estimation approach for coastal data with regard to climate change. Specifically,
future sea level rise (SLR) values are predicted on the basis of initial corresponding values, which are
identical to the values for the year 2025 that are provided by the Mediterranean Coastal Database (MCD).
The proposed estimator is named Coastal Data Estimator (CDE) and is used for predictions in the Crete
island, Greece. During the years from 2030 to 2100, the CDE estimation performance is evaluated against
the MCD regarding the representative concentration pathways 2.6 (RCP26), 4.5 (RCP45) and 8.5 (RCP85)
as well as the medium and high ice-sheet melting scenarios. Concerning the high ice-sheet melting scenario
in RCP26, the CDE deviates less than 10% for the years 2030-2065 and 2080-2100. In the case of RCP45,
the CDE estimator achieves predictions with deviations less than 10% from the year 2030 to the year 2080
and 2075 for medium and high scenario, correspondingly. Future work includes the CDE testing in other
Mediterranean sites. Additionally, the CDE equation could become multibranch as well as estimations
should be automized, excluding the per year constants.
*
Corresponding author
1 INTRODUCTION
Coastal erosion to be managed during climate
change needs valid projections of shoreline change
across large time scales i.e. decades and hundreds of
years. Nevertheless, coastal erosion modelling
presents important challenges like that the long-term
evolution of the shoreline entails interacting and
coupled short-to-long term coastal processes, also
influenced by the climate change. Besides, future
estimates of shoreline change are affected by multi-
source uncertainties (Toimil et al., 2020).
Several works on coastal erosion estimations
have appeared in the literature. A collection of
numerical models is used to assess coastal erosion
and the performance of various recommended
solutions, along a section of coast in southern Rhode
Island, US, in (Hayward et al., 2018). The study in
(Cham et al., 2020) proposes a novel method, of
utilizing multitemporal remote sensing images
during 1965-2018 and digital evaluation model with
tidal correction, to analyse the changes in shoreline
and estimate the rate of erosion and accretion in the
Cua Dai estuary, Vietnam. In the work of (Scardino
et al., 2020) a new predictive model of submersion is
developed to support coastal management in sea
level rise (SLR) conditions over the next decades up
to 2100 for the Gulf of Taranto in southern Italy.The
paper in (Toimil et al., 2020) reviews the
contemporary techniques which are used to model
climate change-induced coastal erosion.
Robust estimations penalizing outliers
(Panagiotopoulou, 2012; Panagiotopoulou, 2013;
Tukey, 1983) could prove useful for the prediction
of coastal data values. Actually, individual coastal
adaptation practitioners may have different
preferences and acceptable degrees of risk. The
particular uncertainty should be passed onto end
users and get incorporated into decision analysis
(Hinkel et al., 2019).
In the present work a novel estimation approach
for SLR is presented. Specifically, SLR values get
predicted for the future based on corresponding
present time values. The starting point of estimation,
thus present values, is equivalent to the
Mediterranean Coastal Database (MCD) provided
values for the year 2025. The proposed estimator is
called Coastal Data Estimator (CDE) and serves for
predictions in the Crete island, Greece. SLR values
that are provided by the MCD are utilized for the
166
Panagiotopoulou, A., Ragia, L. and Sarri, F.
Sea Level Rise Future Predictions: A Case Study in Crete.
DOI: 10.5220/0011112900003185
In Proceedings of the 8th International Conference on Geographical Information Systems Theory, Applications and Management (GISTAM 2022), pages 166-172
ISBN: 978-989-758-571-5; ISSN: 2184-500X
Copyright
c
2022 by SCITEPRESS – Science and Technology Publications, Lda. All rights reserved

evaluation of the CDE estimation performance
throughout the years from 2030 to 2100.
2 THE SEA LEVEL RISE EFFECT
GLOBALLY
Enhanced greenhouse effects on earth environment
have brought the global climate change. Thermal
expansion of sea water, resulting from temperature
increment of the ocean upper layer, is defined as the
main source of SLR (Woodworth, 2017; Shannon et
al., 2019). SLR is anticipated to have a tremendous
impact on human activity near coastal regions. In fact,
inundation of low-lying coastal areas is a direct
outcome of SLR and constitutes a long-term problem
having been under consideration in a variety of fields
(Pickering et al., 2017; IPCC, 2021).
The ocean thermal expansion and the melting of
glaciers, ice-sheets cause SLR that demonstrates a
timescale of 100–200 years, which is related to the
continuance of CO2 in the atmosphere and therefore
the radiative forcing time span. In accordance with
the model of (Jevrejeva et al., 2012), SLR of 0.57–
1.10 m by 2100 has been predicted. In effect,
simulation indicates that sea level will keep at rising
for many centuries after stabilization of radiative
forcing, finally outstretching between 1.84 and 5.48
m above sea level by 2500 concerning all scenarios,
apart from the RCP3PD low emission scenario. The
work (Hinkel et al., 2014) evaluates on a global
scale the coastal flood damage and adaptation costs
under 21
st
century SLR. Devoid of adaptation, it is
expected that 0.2–4.6% of the world’s population
will be flooded annually by 2100 within 25–123 cm
of a global mean SLR. Moreover, concerning coastal
sea level changes and the associated risks of
flooding and erosion, wind waves are a key factor.
The work (Melet et al., 2020) is based on empirical
formulations, different estimates of beach slopes and
an ensemble of global wave models, to propose a
first‐order estimate of the correlation significance of
the input of atmospheric climate directed wave setup
changes to 20‐year mean projected coastal sea level
changes at global scale.
Thereafter, the challenge for coastal regions
globally is the projection of SLR and its effects into
the future. The Intergovernmental Panel on Climate
Change (IPCC) is seriously concerned with the latter,
but also governments individually are simultaneously
trying to estimate future SLR projections for their
own regions. Future climate projections are attainable
through global climate models. In these models,
uncertainties and assumptions regarding future
greenhouse gas emissions (i.e., Representative
Concentration Pathways-RCPs) are contained whilst
the factors that will influence global climate,
including ice melt and consequently SLR, are
modeled (Griggs and Reguero, 2021). Nowadays, all
predictions for the next few decades, generally agree,
but projections in concern with the end-of-century
vary between models. In fact, RCPs play a substantial
role, with growingly broader uncertainties and ranges
in estimations by 2100. By the newest estimates, the
values for the end-of-century (2100) range from a low
of ~50 cm to as high as ~310 cm, independence of
greenhouse gas emission scenarios and various proba-
bilities, mainly regarding the extent of Greenland and
Antarctica ice melt (De Conto et al, 2016).
Virtually definitely, global mean sea level
(GMSL) will keep up rising over the 21st century
coming after the continued warming of the climate
system (IPCC, 2021). The SLR will carry on with
over the centuries and millennia following emissions
stopping, which is related to continuing ocean heat
growth and the slow adjustment of the ice sheets. By
2100, GMSL is projected to increase per 0.28–0.55
m under SSP1-1.9 and per 0.63–1.02 m under SSP5-
8.5 relative to the 1995–2014 average (IPCC, 2021),
where SSP represents a shared socio-economic
pathway. Concerning the scenarios of higher CO2
emissions, sea level projections for 2100 and beyond
are strongly debatable, which is linked with the ice-
sheet responses to warming. In the case of a low
probability, hard plot and a high CO2 emissions
scenario, ice-sheet processes, that are characterized
by deep unpredictability, could bring GMSL rise up
to about 5 m by 2150.
Considering the long-term commitment,
uncertainty in relation to the timetable of
outstretching different GMSL rise levels is an
important contemplation for adaptation planning.
Regional sea level changes differ from global
estimates. This happens due to alterations in ocean
density and circulation, in atmospheric pressure as
well as in Earth Gravity, in Earth Rotation and in
viscoelastic solid-Earth deformation with regards to
mass redistributions such as ice melting and
groundwater extractions (Gregory et al., 2019;
Toilim et al., 2020). In fact, SLR tends to increase at
lower latitudes and decrease at higher latitudes.
Due to the great uncertainty issues and the
complex factors that have to be considered in
simulation models, future climate projections and in
specific SLR projections, would need an alternative
way of estimating. Here lies the usability of the CDE
estimator which is proposed in the current work. The
Sea Level Rise Future Predictions: A Case Study in Crete
167

CDE estimator constitutes a novel mathematical
model for future SLR predictions. The proposed
estimator could prove useful for predicting how much
the sea level will rise, without the need for gathering
the various data of global patterns in the ocean and
atmosphere, that climate models get as input.
3 SEA LEVEL RISE PROVIDED
BY THE MEDITERRANEAN
COASTAL DATABASE
The area of interest in the present study is Crete
island in Greece. Six geographical locations in
Crete, whose the latitude and longitude coordinates
are given in Table 1, are considered. For this region,
coastal data are available through the MCD (Argus
et al., 2014; Peltier et al., 2015; Wolf et al., 2018).
Table 1: Geographical Point Coordinates in Crete island.
Location Numbe
r
Latitude Longitude
1 35.5296 23.9249
2 35.5145 23.9790
3 35.5162 24.0269
4 35.5296 24.0488
5 35.5193 23.8993
6 35.5357 24.0480
In particular, there are regionalized SLR
scenarios, which take into account the effects of
regional gravity and rotation due to changes in ice
mass distribution and steric changes i..e. changes
caused by ocean temperature and salinity variations.
Particularly, mean SLR relative to 1985-2005 in
meters for RCP values equal to 2.6, 4.5 and 8.5 for a
high ice-sheet melting scenario as well as for a
medium ice-sheet melting scenario are given (Hinkel
et al., 2014). The latter study provides results of
equal range as those of national studies (Molinari et
al., 2019) but a couple of uncertainties inherent to
the nature of the global socioeconomic coastal
analysis endure. Also, the study in (Hinkel et al.,
2014) mistreats the issue of groundwater depletion
for human use, which was projected to contribute up
to about 8 cm to global SLR by the end of the
century (Wada et al., 2012). Along with SLR,
potential storminess changes and possible rise in
cyclone intensity could modify flood damage
(Jevrejeva et al., 2012) but are not regarded here. An
additional primary element of uncertainty is human-
induced subsidence resulting from the withdrawal of
ground fluids, particularly within densely populated
deltas, which may lead to rates of local relative SLR
that are one order of magnitude higher than current
rates of climate-induced global-mean SLR (Syvitski
et al., 2009).
In Tables 2-3 the MCD values for the mean SLR
in meters are presented. The six geographical points
in Crete island which are described in Table 1 are
attributed approximately the same mean SLR (Wolf
et al., 2018). The SLR shows an increasing trend
throughout the years from 2025 to 2100. Also, the
high ice-sheet melting scenario values supersede
those of the medium scenario (Hinkel et al., 2014).
The aforementioned facts hold true for all three RCP
values.
Table 2: Mean Sea Level Rise in meters for representative
concentration pathways 2.6 and 4.5 (Hinkel et al., 2014).
Year RCP26 RCP45
M
1
H
2
M H
2025 0.079 0.110 0.080 0.111
2030 0.101 0.145 0.100 0.140
2035 0.121 0.174 0.119 0.168
2040 0.138 0.200 0.141 0.202
2045 0.156 0.228 0.164 0.236
2050 0.178 0.260 0.190 0.275
2055 0.197 0.288 0.218 0.317
2060 0.215 0.318 0.246 0.361
2065 0.232 0.345 0.276 0.410
2070 0.250 0.374 0.306 0.461
2075 0.267 0.402 0.337 0.510
2080 0.284 0.429 0.368 0.557
2085 0.302 0.458 0.397 0.604
2090 0.320 0.486 0.428 0.651
2095 0.338 0.513 0.457 0.698
2100 0.356 0.542 0.487 0.746
1
Medium scenario,
2
High scenario
Table 3: Mean Sea Level Rise in meters for representative
concentration pathway 8.5 (Hinkel et al., 2014).
Year RCP85
M
1
H
2
2025 0.086 0.124
2030 0.108 0.154
2035 0.134 0.190
2040 0.156 0.227
2045 0.188 0.268
2050 0.221 0.317
2055 0.255 0.371
2060 0.295 0.434
2065 0.336 0.450
2070 0.381 0.568
2075 0.426 0.639
2080 0.475 0.718
2085 0.528 0.803
2090 0.583 0.893
2095 0.638 0.988
2100 0.696 1.090
1
Medium scenario,
2
High scenario
GISTAM 2022 - 8th International Conference on Geographical Information Systems Theory, Applications and Management
168

4 THE COASTAL DATA
ESTIMATOR
In this section the proposed estimator, called CDE,
is presented. The values of mean SLR for the years
2030 to 2100 are estimated, where as starting point
or present value is taken the mean SLR value for the
year 2025 that is provided by the MCD.
The CDE mathematical formula is given in
equation (1):
𝑆𝐿𝑅
𝑆𝐿𝑅
100 𝜎
.
(1)
where 𝑆𝐿𝑅
stands for the mean SLR in year 𝑦 and
𝜎 denotes the standard deviation of the set of mean
SLR values in the year 𝑦.
As far as 𝑐 in equation (1) is concerned, it is a
constant relating to the year as described in Table 4.
Mean SLR values for medium and high scenario as
well as for all three RCP values are included in the
aforementioned set. For the year 2030 predictions,
the CDE utilizes the SLR values of 2025 as given by
the MCD. Regarding all other years, the CDE
estimates SLR values by taking into consideration its
own predictions five years behind.
Table 4: Constant 𝑐 values in relation to the year of
prediction.
Yea
r
𝑐
2030 1
2035 2.4
2040 3.8
2045 4.4
2050 5.6
2055 7.1
2060 8.6
2065 9.8
2070 11.2
2075 13.2
2080 15.1
2085 15.1
2090 15.1
2095 16.4
2100 17.6
The CDE estimations as resulting from equation
(1) are given in Tables 5-6. The % deviation
between the MCD and CDE estimations is presented
in Tables 7 and 8, where the MCD values are
considered as the groundtruth ones. With regard to
RCP26 and medium scenario, the CDE deviations
are smaller than 10% for the years 2030-2060 and
2085. Concerning the high scenario in RCP26, the
CDE deviates less than 10% for the years 2030-2065
and 2080-2100. In the case of RCP45, the CDE
estimator achieves predictions with deviations less
than 10% from the year 2030 to the year 2080 and
2075 for medium and high scenario, respectively. As
far as RCP85 is concerned, for both medium and
high scenarios, during the years 2030-2050 the CDE
deviations are smaller than 10%. This holds true
additionally for the year 2065 in the high scenario.
Table 5: Mean Sea Level Rise in meters for representative
concentration pathways 2.6 and 4.5 by the Coastal Data
Estimator.
Year RCP26 RCP45
M
1
H
2
M
H
2030 0.101 0.141 0.103 0.142
2035 0.121 0.169 0.124 0.170
2040 0.135 0.189 0.138 0.190
2045 0.157 0.220 0.161 0.222
2050 0.183 0.257 0.188 0.259
2055 0.209 0.293 0.215 0.296
2060 0.233 0.327 0.240 0.331
2065 0.260 0.365 0.268 0.370
2070 0.295 0.414 0.304 0.419
2075 0.324 0.455 0.334 0.461
2080 0.327 0.459 0.337 0.465
2085 0.330 0.463 0.340 0.469
2090 0.377 0.513 0.377 0.520
2095 0.402 0.547 0.402 0.555
2100 0.429 0.583 0.429 0.592
1
Medium scenario,
2
High scenario
Table 6: Mean Sea Level Rise in meters for representative
concentration pathway 8.5 by the Coastal Data Estimator.
Year RCP85
M
1
H
2
2030 0.110 0.159
2035 0.132 0.191
2040 0.147 0.213
2045 0.171 0.248
2050 0.199 0.289
2055 0.227 0.330
2060 0.253 0.368
2065 0.283 0.411
2070 0.321 0.466
2075 0.353 0.513
2080 0.356 0.517
2085 0.359 0.521
2090 0.398 0.577
2095 0.425 0.615
2100 0.453 0.656
1
Medium scenario,
2
High scenario
Sea Level Rise Future Predictions: A Case Study in Crete
169

With regard to all considered RCPs and the two
ice-sheet melting scenarios, the time spans of CDE
estimation deviations smaller than 10% are clearly
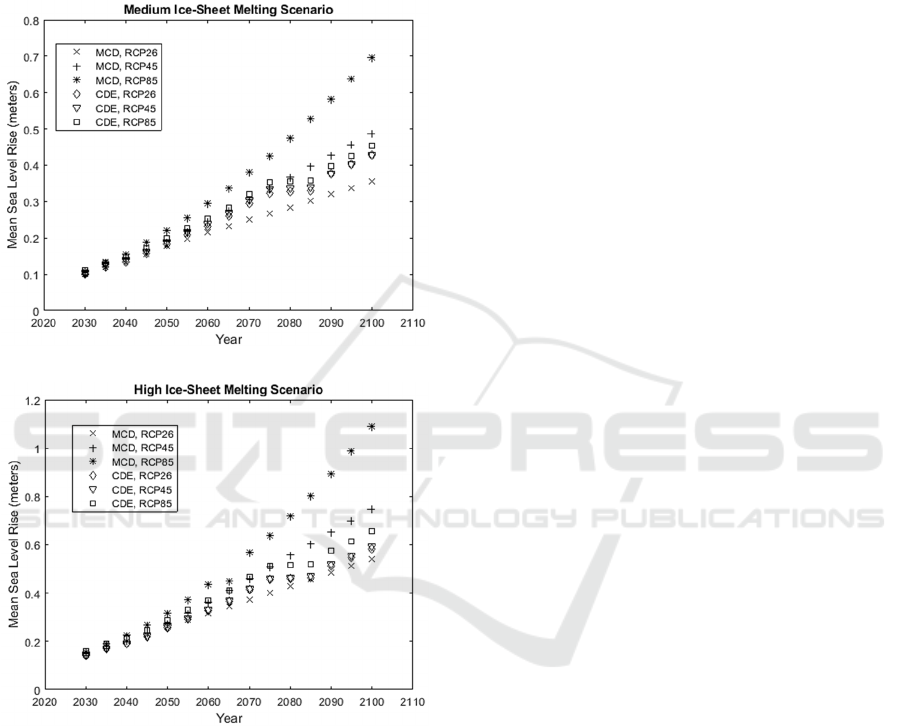
presented in Table 9. Also, Figure 1 plots the mean
SLR predictions of MCD and CDE that are
presented in Tables 2-3 and 5-6. The prediction
accuracy of CDE is smallest in the case of RCP85.
Table 7: Percentage deviation (%) regarding the
comparison of mean sea level rise estimations, for
representative concentration pathways 2.6 and 4.5, by the
Coastal Data Estimator to the Mediterranean Coastal
Database values. The minus symbol denotes
underestimation.
Year RCP26 RCP45
M
1
H
2
M H
2030 0 -2.8 3.0 1.4
2035 0 -2.9 4.2 1.2
2040 -2.2 -5.5 -2.1 -5.9
2045 0.6 -3.5 -1.8 -5.9
2050 2.8 -1.2 -1.1 -5.8
2055 6.1 1.7 -1.4 -6.6
2060 8.4 2.8 -2.4 -8.3
2065 12.1 5.8 -2.9 -9.8
2070 18.0 10.7 -0.7 -9.1
2075 21.3 13.2 -0.9 -9.6
2080 15.1 7.0 -8.4 -16.5
2085 9.3 1.1 -14.4 -22.3
2090 17.8 5.5 -11.9 -20.1
2095 18.9 6.6 -12.0 -20.5
2100 27.2 7.6 -11.9 -20.6
1
Medium scenario,
2
High scenario
Table 8: Percentage deviation (%) regarding the
comparison of mean sea level rise estimations, for
representative concentration pathway 8.5, by the Coastal
Data Estimator to the Mediterranean Coastal Database
values. The minus symbol denotes underestimation.
Year RCP85
M
1
H
2
2030 1.9 3.2
2035 -1.5 0.5
2040 -5.8 -6.2
2045 -9.0 -7.5
2050 -9.9 -8.8
2055 -11.0 -11.0
2060 -14.2 -15.2
2065 -15.8 -8.7
2070 -15.7 -18.0
2075 -17.1 -19.7
2080 -25.0 -28.0
2085 -32.0 -35.1
2090 -31.7 -35.4
2095 -33.4 -37.7
2100 -34.9 -39.8
1
Medium scenario,
2
High scenario
Table 9: Time spans where the percentage deviation (%),
regarding the comparison of mean sea level rise
estimations by the Coastal Data Estimator to the
Mediterranean Coastal Database values, is smaller than
10%. The three representative concentration pathways and
both ice-sheet melting scenarios are shown.
Scenario RCP26 RCP45 RCP85
Medium
2030-2060,
2085
2030-2080 2030-2050
High 2030-2065,
2080-2100
2030-2075 2030-2050,
2065
5 CONCLUSIONS
Managing coastal erosion in the process of climate
change needs valid projections of shoreline change
across very large time scales. However, coastal
erosion modelling presents significant challenges
while future estimates of shoreline change get
affected by uncertainties arising from multiple
sources. Robust estimations could prove useful for
the prediction of coastal data values, where the
prediction uncertainty may be evaluated by
individual coastal adaptation practitioners and be
passed on to end users as well as to decision
analysis.
In the present work a new estimation approach
for sea level rise is proposed. The starting point of
estimation is equivalent to the Mediterranean
Coastal Database provided values for the year 2025.
The proposed estimator is named Coastal Data
Estimator and is used for predictions in the Crete
island, Greece throughout the years from 2030 to
2100. There is calculated the % deviation between
the MCD and CDE estimations, where the MCD
values are considered as the groundtruth ones.
Concerning the high ice-sheet melting scenario in
RCP26, the CDE deviates less than 10% for the
years 2030-2065 and 2080-2100. In the case of
RCP45, the CDE estimator achieves predictions with
deviations less than 10% from the year 2030 to the
year 2080 and 2075 for medium and high scenario,
correspondingly.
The current study presents certain limitations
which need to be addressed in future work. In
specific, future work includes the CDE application
and testing in other Mediterranean sites. Also, the
CDE mathematical formula could become multi-
branch to better adapt to medium and high ice-sheet
melting scenarios and/or RCP values. Additionally,
the CDE formula automation, excluding the per year
constants, should be worked out.
GISTAM 2022 - 8th International Conference on Geographical Information Systems Theory, Applications and Management
170
ACKNOWLEDGEMENTS
This study has been financially supported by the
National R&D Project “ECITO: Effects of climate
change in the old city of Chania”,
https://ecito.athenarc.gr/, that is funded by John S.
Latsis, Public Benefit Foundation.
(a)
(b)
Figure 1: The Mediterranean Coastal Database and the
Coastal Data Estimator predictions for mean sea level rise
throughout the years up to 2100, per representative
concentration pathway (a) Medium ice-sheet melting
scenario (b) High ice-sheet melting scenario.
REFERENCES
Argus, D. F., Peltier, W. R., Drummond, R., Moore, A. W.
(2014). The Antarctica component of postglacial
rebound model ICE-6G_C (VM5a) based on GPS
positioning, exposure age dating of ice thicknesses,
and relative sea level histories. InGeophysical Journal
International, vol. 198, pp. 537–563,
https://doi.org/10.1093/gji/ggu140.
Cham, D. D., Son, N. T., Minh, N. Q., Thanh, N. T.,
Dung, T. T. (2020). An analysis of shoreline changes
using combined multitemporal remote sensing and
digital evaluation model, In Civil Engineering
Journal, vol. 6, no. 1. http://dx.doi.org/10.28991/cej-
2020-03091448
DeConto, R. M. and Pollard, D. (2020). Contribution of
Antarctica to past and future sea-level rise, In Nature,
vol. 531, pp. 591–597, https://doi.org/10.1038/
nature17145
Gregory J. M. et al. (2019). Concepts and terminology for
sea level: mean, variability and change, both local and
global, In Surveys in Geophysics, pp. 1-39,
https://doi.org/10.1007/s10712-019-09525-z
Griggs G. and Reguero B.G. (2021). Coastal adaptation to
climate change and sea-level rise, Water, vol. 13, no.
2151, https://doi.org/10.3390/w13162151
Hayward, S. et al. (2018). Numerical simulation of coastal
erosion and its mitigation by living shoreline methods:
A case study in Southern Rhode Island, In Shore &
Beach, vol. 86, no. 4, pp. 13-25.
Hinkel, J. et al. (2014). Coastal flood damage and
adaptation costs under 21st century sea-level rise.
In Proceedings of the National Academy of Sciences,
U.S.A, vol. 111, pp. 3292–3297, https://doi.org/10.10
73/pnas.1222469111.
Hinkel, J. et al. (2019). Meeting user needs for sealevel
rise information: a decision analysis perspective. In
Earth’s Future 7, https://doi.org/10.1029/2018EF00
1071
Masson-Delmotte, V. P.et al., (In Cambridge University
Press). IPCC, 2021: Summary for Policymakers, In
Climate Change 2021: The Physical Science Basis.
Contribution of Working Group I to the Sixth
Assessment Report of the Intergovernmental Panel on
Climate Change.
Jevrejeva S, Moore J, Grinsted A. (2012). Sea level
projections to ad2500 with a new generation of climate
change scenarios.In Global Planet Change,vol.80–81,
pp. 14–20.
Melet A. et al., (2020). Contribution of wave setup to
projected coastal sea level changes, In Journal of
Geophysical Research: Oceans, https://doi.org/10.10
29/2020JC016078
Molinari, D. et al., (2019). Validation of flood risk
models: current practice and possible improvements,
In International Journal of Disaster Risk Reduction,
vol. 33, pp. 441-448. https://doi.org/10.1016/j.ijdrr.20
18.10.022
Panagiotopoulou, A. (2012). Multi-frame super-resolution
image reconstruction employing the novel estimator
L1inv-norm. In Proceedings of International
Conference on Systems, Signals and Image
Processing, (IWSSIP), pp. 562-565.
Panagiotopoulou, A. (2013). Iterative multi-frame super-
resolution image reconstruction via variance-based
fidelity to the data. In International Journal of Remote
Sensing Applications, vol. 3, pp. 203-214.
Sea Level Rise Future Predictions: A Case Study in Crete
171

Peltier, W. R., Argus, D. F., Drummond, R. (2015). Space
geodesy constrains ice age terminal deglaciation: The
global ICE-6G_C(VM5a) model. In Journal of
Geophysical Research: Solid Earth, vol. 120, pp. 450–
487, https://doi.org/10.1002/2014jb011176.
Pickering M. D. et al., (2017). The impact of future sea-
level rise on the global tides, In Continental Shelf
Research, vol. 142, pp. 50-68, http://dx.doi.org/10.10
16/j.csr.2017.02.004
Scardino, G. et al., (2020). Sea-level rise and shoreline
schanges along an open sandy coast: case study of gulf
of Taranto, Italy, In Water, vol. 12, no. 1414,
doi:10.3390/w12051414
Shannon S. et al., (2019). Global glacier volume
projections under high-end climate change scenarios,
In The Cryosphere, vol. 13, pp. 325-350,
https://doi.org/10.5194/tc-13-325-2019
Syvitski, J.P.M. et al. (2009). Sinking deltas due to human
activities. In Nature Geoscience, vol. 2, pp. 681-686.
Toimil, A. et al. (2020). Climate change-driven coastal
erosion modelling in temperature sandy beaches:
Methods and uncertainty treatment. In Earth-Science
Reviews, vol. 202. https://doi.org/10.1016/j.earscirev.
2020.103110
Tukey, J.(1983).Understanding Robust and Exploratory
DataAnalysis. John Wiley and Sons. New York, USA.
Wada, Y. et al. (2012). Past and future contribution of
global groundwater depletion to sea-level rise.In
Geophyical Research Letters,vol. 39, no . 16.
Wolf, C. et al. (2018). Data Descriptor: A Mediterranean
costal database for assessing the impacts of sea-level
rise and associated hazards. In Scientific Data. DOI:
10.1038/sdata.2018.44.
Woodworth, P.L. (2017). Differences between mean tide
level and mean sea level, In Journal of Geodesy, vol.
91, pp. 69-90, https://doi.org/10.1007/s00190-016-
0938-1
GISTAM 2022 - 8th International Conference on Geographical Information Systems Theory, Applications and Management
172
