
A Self-assessment Tool for Teachers to Improve Their LMS Skills based
on Teaching Analytics
Ibtissem Bennacer, Remi Venant and Sebastien Iksal
University of Le Mans, Avenue Olivier Messiaen, 72085 Le Mans, France
Keywords:
Teaching Analytics, Learning Management System, Self-assessment, Peer Recommendation, Clustering
Analysis, Principal Component Analysis.
Abstract:
While learning management systems have spread for the last decades, many teachers still struggle to fully
operate an LMS within their teaching, beyond its role of a simple resources repository. Moreover, there
is still a lack of work in the literature to help teachers engage as learners of their own environment and
improve their techno-pedagogical skills.Therefore, we suggest a web environment based on teaching analytics
to provide teachers with self and social awareness of their own practices on the LMS. This article focuses
on the behavioral model we designed on the strength of (i) a qualitative analysis from interviews we had
with several pedagogical engineers and (ii) a quantitative analysis we conducted on teachers’ activities on the
University’s LMS. This model describes teachers’ practices through six major explainable axes: evaluation,
reflection, communication, resources, collaboration as well as interactivity and gamification. It can be used
to detect particular teachers who may be in need of specific individual support or conversely, experts of a
particular usage of the LMS who could bring constructive criticism for its improvement. While instrumented
in our environment, this model enables supplying teachers with self-assessment, automatic feedback and peer
recommendations in order to encourage them to improve their skills with the LMS.
1 INTRODUCTION
The trend of using Learning Management Systems
(LMS) is now spreading quickly across all areas of
education (Setiawan et al., 2021), with an accelera-
tion observed during the COVID-19 health situations
last year. An LMS is a digital learning platform for
deploying and monitoring online training, managing
courses and learners, and collecting user traces for re-
engineering (Setiawan et al., 2021). Most universi-
ties offer LMSs as a “one size fits all” technology so-
lution for all teachers of any discipline. Despite the
growing trend for LMS to facilitate educational activ-
ities, the number of teachers using it is not increas-
ing as quickly as one might have imagined (Wang
and Wang, 2009), and many teachers face several dif-
ficulties to integrate these platforms into their prac-
tices (Setiawan et al., 2021). The main problems
of teachers appear to be technical or organizational,
due to the lack of support and the lack of time de-
voted to its learning (Nashed et al., 2022; Dhahri and
Khribi, 2021). Furthermore, most universities are hir-
ing pedagogical engineers (PE), especially to support
and train teachers in order to ensure a proper use of
their LMS and ensure their pedagogical fit. With few
PE compared to teachers (Daele, 2014), the former
struggle to support every teacher. For instance, in
France, these problems were one of the reasons that
led the Ministry of Higher Education to launch the
HyPE-13 project
1
(Hybridizing and Sharing Teach-
ings) in November 2020. Carried by a consortium of
12 french universities, it aims to accompany teachers
and students towards success with new learning de-
vices promoting the hybridization of training.
On the other hand, the use of LMS allows the cap-
ture of large amounts of quantitative data concerning
the behavior of users and designers, and thus paves
the way for Learning and Teaching Analytics (LA,
TA). Learning Analytics relates to the collection and
exploitation of traces left by learners to enhance the
learning process. Teaching Analytics, which are not
explored as much as the former, refer to methods and
tools to help teachers analyzing and improving their
pedagogical designs, and more recently, to analyze
how teachers deliver their lessons (Sergis and Samp-
son, 2017; Alb
´
o et al., 2019). Hence, we consider
1
https://organisation.univ-pau.fr/fr/labels/le-projet-
hype-13.html
Bennacer, I., Venant, R. and Iksal, S.
A Self-assessment Tool for Teachers to Improve Their LMS Skills based on Teaching Analytics.
DOI: 10.5220/0011126100003182
In Proceedings of the 14th International Conference on Computer Supported Education (CSEDU 2022) - Volume 1, pages 575-586
ISBN: 978-989-758-562-3; ISSN: 2184-5026
Copyright
c
2022 by SCITEPRESS – Science and Technology Publications, Lda. All rights reserved
575

Teaching Analytics as a challenging field of research
that may have a great impact on teaching methods as
well as the way in which courses are delivered to the
students. In our University, the LMS has been in place
for more than 10 years, and is considered nowadays as
a critical service heavily promoted to teachers. How-
ever, the University is facing the same issues we iden-
tified previously (LMS use expectations are not met
and only 5 pedagogical engineers have to deal with
more than 600 teachers). Our main objective is then to
provide teachers with personal and social awareness,
in order for them to engage in learning situations that
aim at improving their LMS skills.
To do so, we propose the design and instrumental-
isation of a teachers’ behavior model to support their
self-assessment and leverage peer-learning through
automatic recommendations. We address here two
first research questions: (i) How to model the ex-
ploitation of an LMS a teacher does and could do in
an intelligible way ? (ii) What TA indicators can be
propose from this model to support self-assessment
and enable feedback and recommendations?
The present paper details the teacher model we de-
signed from the analysis of a mixed study in order to
depict their behaviors on the platform, and exposes a
first instrumentalisation based on several TA metrics
we defined and implemented into a web-based envi-
ronment. The next section is dedicated to the related
work on teachers’ behavior on an LMS, whose limits
led us to consider a mixed study that we define and
expose its results obtained from the qualitative and
quantitative analysis in section 3. From these results
we describe then our model, its instrumentalisation
and present a first prototype to address these metrics
to teachers and PE in section 4. We discuss our model
limitations and potential bias as well as the perspec-
tives we consider in the last section.
2 RELATED WORK
Many efforts have been made to understand student
behaviors on LMS, but there seems to be a lack of
work that aims at analyzing teacher’s behavior in such
platforms (Alb
´
o et al., 2019). Nevertheless, some
researchers were interested in Teaching Analytics to
understand how teachers deliver their lessons. For
instance, (Sampson, 2017) proposed the concept of
Teaching and Learning Analytics as a synergy be-
tween Teaching Analytics and Learning Analytics in
order to support the process of teacher inquiry. The
latter is defined by (Avramides et al., 2015) as a set of
actions in which “teachers identify questions for in-
vestigation in their practice and then design a process
for collecting evidence about student learning that in-
forms their subsequent educational designs”. The use
of this process of teacher inquiry is possible in the
case of our work, however the identification of ques-
tions regarding teachers’ practices is not trivial and
could be accompanied to encourage and help them
adopt the approach.
On the other hand, (Ndukwe and Daniel, 2020)
proposed a Teaching Outcomes Model (TOM) that
aims to provide teachers with guidance on how to
engage and reflect on teaching data. TOM is a TA
life cycle that begins with the data collection stage
where teaching data are extracted and collected. Then
follows the data analysis stage by applying different
machine learning (ML) techniques to discover hidden
patterns. After that comes the data visualization stage,
where data is presented in the form of a Teaching An-
alytics Dashboard (TAD) for the teacher. Finally, the
action phase where actions are implemented by teach-
ers to improve their pedagogical practices.The TOM
model is interesting when analyzing teacher behavior,
but it seems to be limited to only quantitative analy-
ses that may yield inconclusive or incomplete findings
without a qualitative study.
A TAD is a category of dashboard for teachers that
holds a unique role and value. It could allow teach-
ers to access student learning in almost real-time and
scalable manner, therefore, allowing teachers to im-
prove their self-awareness by monitoring and observ-
ing student activities. It also tracks teachers’ personal
activities, as well as students’ feedback on their teach-
ing practice. For example, (Barmaki and Hughes,
2015) explored a TAD that provides automated real-
time feedback based on speaker posture to help teach-
ers perform classroom management and content de-
livery skills. They used different types of multimodal
data, including talk-time and nonverbal behaviors of
the virtual students, captured in log files; talk time
and full body tracking data of the participant; and
video recording of the virtual classroom with the par-
ticipant. For feedback, a visual indication was used
whenever the participant exhibited a closed, defensive
posture. Furthermore, (Prieto et al., 2016) used TA
to automatically extract teaching actions during face-
to-face classrooms (explanation, monitoring, testing,
etc.). They used data collected from multiple wear-
able sensors (including accelerometers, EEG or eye-
trackers) and explored ML techniques to character-
ize what teachers really do during their courses. This
study allowed to automatically detect the teacher’s ac-
tivity (explanation, monitoring, questioning ...), and
to distinguish between the moment when the teacher
interacts individually, in small groups, or with the
whole class. The studies of (Barmaki and Hughes,
EKM 2022 - 5th Special Session on Educational Knowledge Management
576

2015) and (Prieto et al., 2016) effectively allowed to
explore teachers’ behavior and provide them with use-
ful feedback. However, they only used multimodal
data without investigating teachers’ traces on LMS,
which makes their work beyond our research scope.
Some studies have been conducted to explore
teacher behavior in hybrid learning (HL) systems.
From that perspective, (Coomey and Stephenson,
2001) propose a theoretical model (DISC) that iden-
tifies four main characteristics of e-learning which
are considered essential to good practice: Dialogue,
Involvement, Support and Control. Thereafter, they
proposed four paradigms according to variations in
locus of control (teachers or students) and task spec-
ification (strictly specified or open) with a list of ad-
vice for each paradigm. On the other hand, (Peraya
et al., 2006) built an empirical framework based on 5
main dimensions to describe how teachers cope with
techno-pedagogical environment in HL setting. These
dimensions include modalities of articulation of face-
to-face and distant phase, human support, forms of
media, mediation and degree of openness. While the
last two works propose models to study teacher be-
havior, they are contextualized for HL systems (re-
mote/ face-to-face learning), and are not appropri-
ate to analyse the use of an LMS used mostly as
a complement to face-to-face learning. In this con-
text, other researchers were interested in analyzing
the behavior of teachers. For example, (Whitmer
et al., 2016) aimed to uncover archetypes of course
design across multiple institutions. To this end, they
performed a clustering analysis and identified five
different groups consider courses with mainly con-
tent and low interactions, with one-way communica-
tion, with strong peer interactions, courses more ori-
ented to evaluation and eventually those with a bal-
ance between content, communication and evalua-
tion. Moreover, (Regueras et al., 2019) proposed a
method to automatically certify teachers’ competen-
cies from LMS data to help universities make strate-
gic decisions. Three clustering methods were applied,
and they were able to identify 6 types of courses (non
active, submission, deposit, communicative, evalua-
tive, balance). To enable teachers to measure and
evaluate their courses, (Valsamidis et al., 2012) used
Markov Clustering and Kmeans algorithms to ana-
lyze LMS courses and student activity, then computed
metrics based on the number of sessions and page
views per user. While the latter allowed for a pre-
liminary ranking of courses, they are only based on
students actions and thus do not related to the activi-
ties the teacher perform on the LMS.
Overall, these analysis of teachers’ actions tar-
get various purposes: some studies attempt to cate-
gorize courses, to profile teachers or to analyze the
overall use of LMS, while others aimed at automat-
ically certifying teachers or to evaluate and mea-
sure their courses performance. However, it appears
that none of them have targeted the modelisation
of the teacher’s behavior for its application to self-
assessment. Such modelisations give proper insights
to what is currently done on the LMS, and may be
used to compare a teacher to another, but present com-
mon limits. Indeed, they use student-related data that
are difficult to compare since it is not the same popu-
lation, nor the same number of students, etc. In addi-
tion, the empirical models we reviewed depict current
platform usage, with the rejection of unused variables
and cannot adapt to future use that are expected. We
suggest then to design a model from both data min-
ing and expert knowledge when expectations involve
LMS use that are not observed yet. Furthermore, the
models proposed in the literature depend on the data
within the LMS used by the researchers. However
features used by teachers and their behavior change
from one LMS to another, which requires us to create
a new model.
3 TEACHER BEHAVIOR
ANALYSIS
3.1 Methodology
In order to qualify the current and expected teachers’
uses of the LMS, we applied a quantitatively driven
mixed method (Johnson et al., 2007). We started ap-
plying a quantitative analysis to deduce statistically
different profiles of LMS use, in order to find groups
of teachers or profiles of interest, based on the LMS
log data. We performed a Principal Component Anal-
ysis (PCA) and a clustering analysis. PCA analysis
allows to highlight diversity of the dataset in a re-
duced set of variables (components) while the clus-
tering one aims to regroup the different instances of
the dataset regarding their similarity. Afterwards, we
conducted semi-structured interviews (i.e. : qualita-
tive interview) with pedagogical engineers. In a se-
ries of open-ended questions prepared in advance to
guide our interview, we collected information to im-
prove the quantitative study. This qualitative method
was chosen because we needed the interviewee to an-
swer freely, express a specific point of view, and bring
out potential new working hypotheses (Magaldi and
Berler, 2020). We performed then a second quan-
titative analysis using the same previous method to
address the engineer’s comments by adding or mod-
ifying some variables. In order to design a behav-
A Self-assessment Tool for Teachers to Improve Their LMS Skills based on Teaching Analytics
577

ior model that can handle both present and future
expected usages of the LMS, we merge both results
we obtained from this latest analysis and those we
obtained from the interviews. Particularly, some of
the discussed LMS features are still not used enough
to appear in the results of the quantitative analysis.
Moreover, the choice of the model axes (i.e.: the
structure, how variables are grouped by axis) is also
made from the results of the last PCA analysis, and
modified thanks to the qualitative interviews.
Finally, this model allowed to design several TA
metrics. We applied clustering methods to be able to
provide a social awareness-based indicator and then
defined interpretable scores to offer more detailed per-
sonal awareness. In parallel to that, we created a ques-
tionnaire of teachers on LMS habits in order to (i) val-
idate our needs and the interest of our work, and (ii)
have directions on the functionalities of the applica-
tion we will develop for the purpose of exploiting the
results of our model and metrics.
Based on the TA metrics and the questionnaire, we
eventually designed a tool mainly dedicated to teach-
ers but also to the university’s pedagogical engineers.
It supports self-assessment and awareness, and can
also provide automatic peer recommendations using
our model and metrics.
3.2 Qualitative Study
We chose to conduct interviews with pedagogical en-
gineers because they are always in contact with teach-
ers to help them use the University’s LMS, so they
have a global insight into the practices used by teach-
ers and the problems they encounter when using the
platform. In addition, with the transition to fully on-
line teaching due to COVID19, it was difficult to con-
tact teachers due to their charges unlike PE. There-
fore, the interviews were conducted separately with
3 female engineers on the same day and each lasted
40 to 50 minutes. All interviews were tape-recorded,
transcribed, and analyzed by 2 researchers who com-
pared the different responses by grouping similar ones
and detecting particular cases.
Prior to the interviews, we prepared the inter-
view guide that includes the different questions, clas-
sified according to their themes: introduction (mu-
tual presentation, research objectives, PE biographies
and competencies); implementation of pedagogical
scenarios on LMS (method used to implement teach-
ers’ practices); use of the LMS by teachers (PE’ per-
ception of the teachers’ use, difficulties encountered
by teachers for the implementation of their practices,
typical teachers’ profiles observed, suggested indica-
tors to define and detect these profiles); evaluation
of the variables used in the first analysis (opin-
ion about the variables used in the first analysis, dis-
cussion about other variables that might be relevant);
evaluation of the groups of teachers obtained (con-
sistency of the identified groups, and usability of the
model); tool and expectations (the vision PE have of
an application for them and expectations for the fur-
ther development of the research project).
Throughout the interviews, no contradictory state-
ments were detected, and there was a consensus on
most of the conclusions. For the implementation of
pedagogical scenarios, they mentioned not using any
predefined formalism but rather adapt to the teacher’s
choice. Regarding LMS usage, they indicated the
LMS of the University is underutilized to its potential.
One engineer specified that its use is mainly in science
faculty with people who are “not afraid of computers”
and that this use is very variable from one teacher to
another. The difficulties experienced by these engi-
neers are considered mainly due to insufficient knowl-
edge of the platform and to the lack of time for learn-
ing. Another engineer added that teachers only see the
LMS as a computer tool, which prevents them from
improving. According to them, the different activi-
ties used in the LMS are resource repository, com-
munication, evaluation, and feedback. More recently
they have noticed a demand for more fun and attrac-
tive activities. Then, they proposed some indicators
to assess these profiles which revolve around activi-
ties’ frequency of consultation by students, the use of
links, individual or collective resources and quizzes.
With respect to the first analysis we have done (de-
tailed in the following section), they encouraged us
to correct some variables calculation. For instance,
while we used the resource ”url” proposed in the
LMS to compute the number of external references
a course may do, PE explained that many reference
to external content were directly written in the con-
tent of labels or section summaries. Furthermore,
they suggested adding some activities that were not
collected at the time such as game-type ones. They
also emphasized the importance of including feed-
back that was unfortunately removed during the pre-
processing phase due to its low variance. On the
other hand, they expressed, once they saw the teacher
groups, their interest in getting to know the very active
teachers. They were actually eager to invite them to
have a discussion and get their feedback. At the end,
they described their needs regarding the exploitation
of our results. It consists mainly in the necessity to
have elements to better support teachers without be-
ing drowned in a mass of numbers. Furthermore, they
would like to be able to have insights on how good the
course spaces are to engage students in learning, un-
EKM 2022 - 5th Special Session on Educational Knowledge Management
578

derstand why and visualize the results by department
and by discipline. On the COVID part, they were cu-
rious to see the increase in demand for the LMS.
3.3 Quantitative Study
The LMS adopted by our University is used by most
teachers and students. We recovered traces of teach-
ers’ activities from June 2016 to July 2018 and from
October 2019 to November 2020 (an IT failure on
LMS caused the loss of data between the two peri-
ods). We present here the study we made following
the qualitative study, which takes into account the PE’
remarks. Data were preprocessed from the Moodle
Database and the LDAP server to store them into a
Learning Record Store following the xApi
2
conven-
tion: each action is represented as a standalone docu-
ment that provides a view of the related course and ac-
tivity (if any) and details of the user at the time of the
action. From that LRS, 30 variables have been iden-
tified to analyse the teachers’ behavior. 974 teachers
did at least one action related to these features.
We started the preprocessing phase with removing
variables with low variances. We tested multiple val-
ues and ultimately set a threshold that allowed us to
keep 15 variables with variance greater than 0.4. The
second step aimed to eliminate ”ghost teachers” who
are considered as course editors but have only per-
formed very few actions on the course. Therefore, we
calculated the number of non-zero variables for each
teacher, and we found that most of them (half of the
teachers -487 teachers- represented by the red line in
figure 1) have at least 9 non-zero variables, hence we
eliminated those who have more than 6 null values,
and retained the 585 teachers left. Afterwards, we re-
moved variables highly correlated to each other (i.e.:
a Pearson correlation coefficient > 0.8 with a p-value
< 0.005 after having applied a Bonferroni correction).
Two variables appeared to be redundant: label and fo-
rum discussion as they were respectively correlated
to the overall number of links to external resources
(r = 0.89) and the number of forum posts(r = 0.87).
The final dataset is eventually composed of 585 in-
stances and 13 variables described in table 1.
We conducted a PCA analysis to detect typologies
of LMS uses by teachers. Using the criterion of eigen-
value (Tamura and Tsujita, 2007), the best model in-
cludes 5 components that explain 72% of the total in-
ertia (the information contained in the dataset). The
rationale for using the eigenvalue criterion is that each
component must explain the value of at least one vari-
able, and therefore it indicates that only components
with eigenvalues greater than 1 should be retained.
2
https://xapi.com/developer-overview/
Figure 1: The number of teachers per the number of non-
zero variables.
The first component (comp 1) expresses 33.97%
of the total variance, and represents the global usage
of the platform with a consistent use of most platform
tools. In other words, all variables are involved with
the same polarity and regardless of the type of ac-
tivities exploited, which synthesizes the overall use
of the LMS. The second component (comp 2), which
explains 11.56% of the total variance, highlights the
management of evaluation within the LMS. It gathers
tools to manage assignments and submissions (grade,
quiz, assignment), as well as the use of calendars
which is mainly intended to manage deadlines for
assignments and assessments. The third component
(comp 3) concerns exclusively the use of forums (fo-
rum, forum posts) and expresses 10.42% of the to-
tal variance. The fourth component (comp 4) repre-
sents essentially the use of chat activities and the ex-
ploitation of images in course sections, and it explains
8.61% of total variance. Based on the fact we have no
theoretical support nor empirical insight to consider
such odd association, we consider that this component
which relates chats to images is coincidental. The last
component (comp 5) expresses 7.18% of total vari-
ance and it is based on course structure. It brings to-
gether tools used on LMS to organize and personalize
lessons like pages and folders.
3.4 Teacher Questionnaire on LMS
Habits
In order to validate our needs and evaluate the extent
to which teachers would be willing to use our tool,
we have developed a web survey intended for them.
There were four sections in the survey. The first one
was on general questions that were used to capture
contextual factors which characterize the teacher (uni-
versity site, gender, age, department and specialty) as
well as the number of courses taught and professional
experience. The second section was a system usabil-
ity scale (SUS), which is a standardized survey with
A Self-assessment Tool for Teachers to Improve Their LMS Skills based on Teaching Analytics
579
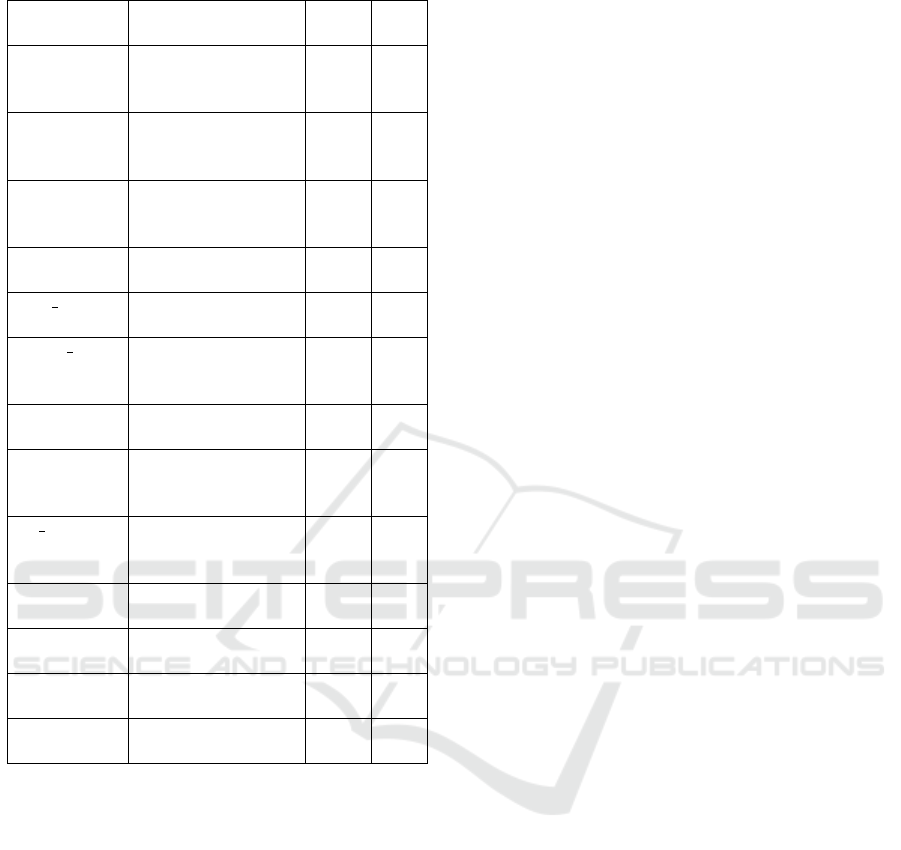
Table 1: Description of the final dataset variables.
Variable Description : The
average number of
Mean Std
grade teacher’s cre-
ations/editions of
grades.
1.40 3.86
quiz teacher’s cre-
ations/editions of
quizzes.
0.34 1.21
assignment teacher’s cre-
ations/editions of
assignments.
0.36 0.77
calendar teacher’s use of cal-
endar.
1.86 4.91
chat message teacher’s chat mes-
sages sent.
0.61 3.84
forum post teacher’s publica-
tions of posts in the
forums.
2.41 21.44
forum teacher’s creations
of forums.
0.32 0.99
img teacher’s use of im-
ages included in the
course sections.
0.19 1.00
all links teacher’s use of
links in sections,
labels or URL.
4.01 10.40
url teacher’s use of the
URL resource.
1.46 4.44
file teacher’s use of the
file resource.
5.82 10.31
folder teacher’s use of the
folder resource.
0.99 2.55
page teacher’s use of the
file resource.
0.66 1.90
Likert scale questionnaires designed to be both simple
and quick. It consists of 10 questions and aims to de-
termine the level of satisfaction experienced by users
of a service or system. In our case, we aim to examine
the effectiveness, efficiency, and satisfaction of teach-
ers in using the institutional LMS, which will allow
us to more easily determine those teachers who use
the platform and those who do not. Thereafter, teach-
ers who are satisfied with the platform can provide us
with information in the next two sections about the
problems they face, how they use the platform and
what can motivate them to improve their uses. On
the other hand, dissatisfied teachers can give reasons
why they do not use the LMS and if there is a way to
motivate them to use the platform in the future. The
third section is devoted to functionalities and ease of
use, so that teachers can explain the difficulties they
encounter when setting up their courses on the LMS
in order to (i) validate the answers of the pedagogi-
cal engineers during the qualitative study, (ii) detect
other problems for which solutions might be found.
Furthermore, some questions are intended to collect
the functionalities of the platform most used by the
teachers to validate the quantitative study and others
to determine the curiosity of teachers to explore more
features of the LMS and whether they would be will-
ing to help each other (my colleagues encourage me
to use LMS). The latter allows us to study the sub-
jective norm which is a very important criterion in
the TAM (Technology acceptance model) which is the
most used model in the studies of user acceptance of
different technologies (Yuen and Ma, 2008). It is de-
fined by the social pressure exerted by directors and
other teachers on teachers to use the systems (Cig-
dem and Topcu, 2015) and it allows, in our case, to
enrich the peer recommendations and the TA metrics
that we propose. The last section of our survey is
about confidentiality and teacher expectations to see
if they would be interested in our awareness tool, and
if they would provide support to each other, so that
we can be prepared and make possible modifications
to the tool before the experimentation.
At the time of writing this article, we have re-
ceived 43 answers. Regarding the general informa-
tion of the respondents, there was almost an equal-
ity in terms of gender with 51.2% female and 48.8%
male. The majority of the respondents’ ages were in
the range of 35-50 years old (which was 53.5% of
respondents). 69.8% of the respondents were from
site 2 while the rest from site 1. The largest num-
ber of the respondents belonged to a technical de-
partment (32.5% Science and technology department
and 30.2% university technical institute departments)
while 11.6% were from Letters, Languages, Human
Sciences department. Therefore, computer science
was the speciality of 16.2% of respondents, 9.2%
were acoustician whereas physics, chemistry, biol-
ogy were the specialty of 12% of teachers with 4%
each. For the number of years of experience, 48.8% of
teachers had between 10 and 20 years of experience,
and 83.6% taught between 1 and 10 courses with only
one teacher who taught a single course.
The results of the SUS questionnaire allowed us to
construct the satisfaction score. This score is between
1 and 100. A score is generally considered ”good”
from 75, fair or correct between 50 and 75. A score
below 50 indicates major problems in terms of cus-
tomer satisfaction. So, according to the teachers’ an-
swers, we have just 3 teachers who are not satisfied of
the University’s LMS, 28 who find the platform quite
satisfactory and 12 who have shown their high satis-
faction of the LMS, as shown in the figure 2 .
Regarding the use of the platform, the figure 3
EKM 2022 - 5th Special Session on Educational Knowledge Management
580
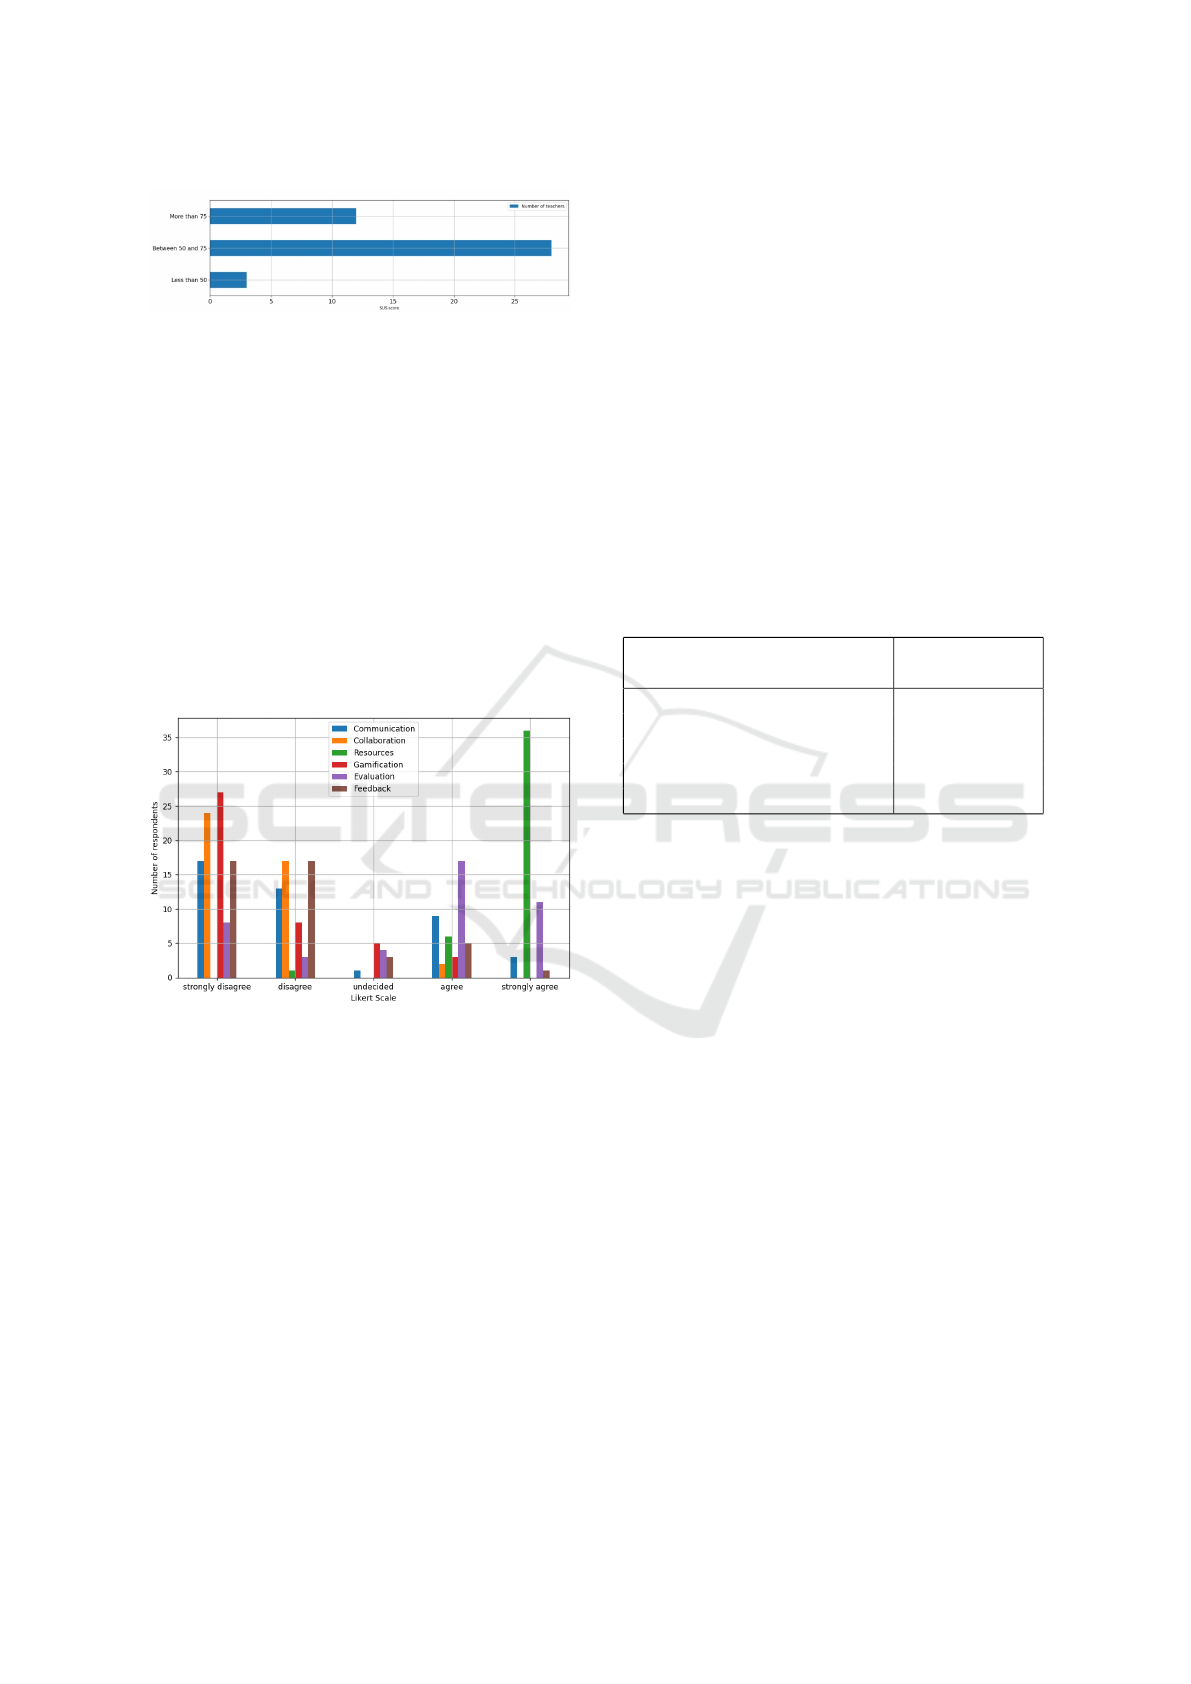
Figure 2: SUS score.
shows that most teachers (36 respondents strongly
agreed and 6 agreed) frequently use the LMS re-
sources. Then comes the evaluation features with 11
respondents strongly agreeing and 17 mostly agree-
ing. On the other hand, gamification and collabora-
tion features are apparently not used very much by
teachers who responded with 27 and 24 disagreeing
respectively. The use of feedback and features that
allow to get students feedback on the courses is also
not very explored by the teachers with 17 disagreeing
and 6 agreeing. Whereas, the communication features
are fairly used with 17 not agreeing and 12 agreeing.
Some teachers mentioned the use of other features
such as activity completion and group selection that
will be considered shortly to improve our model.
Figure 3: Use of the LMS by teachers.
58.13% of respondents expressed their intention
to discover new features on the LMS in order to im-
prove their teaching. 18.6% mentioned that they do
not receive encouragement from their colleagues to
use LMS, however 41.8% contradicted this statement.
Regarding the capture of teachers’ traces on LMS,
at this moment, 17 teachers are against, 18 are for
and 8 are neutral. We then asked teachers who they
would ask for help if they encountered problems on
the LMS. The answers are presented in the table 2, it
clearly shows that they prefer pedagogical engineers
or a close colleagues, which validates the recommen-
dations that we intend to implement. Other teachers
mentioned LMS assistance or internet instead of ask-
ing for help. On the other hand, 86% of respondents
were ready to help their colleagues if they asked.
Finally, we asked if teachers would be interested
in a complementary tool to the LMS to improve their
practices, 37.2% wanted one to get recommendations
from peers, 20.9% to get feedback on their use of the
platform and 16.2% to evaluate themselves. We have
left the question open for further proposals, so one
teacher mentioned that he prefers training on more
times, two other teachers proposed tutorials for cer-
tain functionalities or a guide of good practices and
what they can do on the LMS. It should be mentioned
that 6 respondents did not want any complementary
tools to the LMS since they are satisfied with their
use of the platform (they all have a SUS score higher
than 50). These responses assess the need to provide a
support tool as a significant portion of the teachers are
interested in having it and a large portion of the teach-
ers would like to have recommendations from close
colleagues and pedagogical engineers.
Table 2: Choices for teachers in requesting help.
Choice Number of
respondents
a close colleague 28
a teacher at the university 7
a pedagogical engineer 32
I do not wish to ask for help 1
other 5
4 MODEL DEFINITION AND
EXPLOITATION
4.1 Model
Through the intersection of the qualitative and quan-
titative studies, we designed a teacher behavioral
model. It describes within six axes the behavior of
teachers in a comprehensive way, with respect to pre-
viously discovered components from the PCA anal-
ysis, and to the results of the semi-structured inter-
views we had with the engineers. The objective of this
model is to offer a self-assessment tool to the teachers
on several dimensions, so it allows them to evaluate
themselves according to 6 axes and thus they can de-
tect their weaknesses and strengths on the use of the
LMS. On the other hand, this model includes features
that can be used to represent the current situation, and
features that represent a usage currently low or null,
but that may be of importance in the future.
A.1 Evaluation: this axis represents the different
tools used by the teacher to assess their students. It
reflects the second component of the PCA and with
respect to the results of the qualitative analysis, and
A Self-assessment Tool for Teachers to Improve Their LMS Skills based on Teaching Analytics
581

aims at evaluating how the teacher benefits from the
digital environment to organise and implement stu-
dents’ assessment. It includes obviously the quiz and
assignment variables that provide different ways to
assess students and provide them with formative feed-
back, grade to provide summative feedback and cal-
endar for organization (e.g.: deadlines settings). The
last variable used is the attendance (num. of “at-
tendance” activities manipulated by a teacher). Un-
revealed with the quantitative analysis, it highlights
how the LMS of the University is used to evaluate
students’ presence in the course.
A.2 Reflection: it concerns the LMS features that can
provide teachers with a way to get feedback from stu-
dents on their teaching and the digital resources they
use. Both variables survey and choice (number of re-
spectively “survey” and “choice” activities edited by
the teacher) reveal this particular exploitation of the
LMS. So far they are used marginally, and do not ap-
pear but they must be taken into account as reflection
has been considered as an important axis of evaluation
in the interviews we had with PE.
A.3 Communication: this axis is devoted to the
different means of communication used by teach-
ers to facilitate the transfer of information to
the students and to improve the sharing between
them. It includes forum and chat related vari-
ables (forum, forum discussion, forum posts, chat
and chat messages). It also brings together the third
and the fourth component of the PCA (comp 3 and
comp 4).
A.4 Resources: this axis refers to the diversity of re-
sources the teacher provides to students, and include
then the file, book, folder, page, glossary and url vari-
ables. Based on the comp5 of the PCA analysis, other
variables mentioned were added thanks to interviews
with PE.
A.5 Collaboration: this axis concerns the promotion
of collaboration between students with different LMS
features. It includes the workshop, wiki, via, choice
et data variable, identified mostly by the qualitative
analysis, that all refer to the teacher’s manipulation of
these features. The workshop functionality allows for
the collection, review and peer evaluation of student
work. The wiki allows participants to add and edit a
collection of web pages. The Via feature allows the
creation of synchronous meetings in a virtual class-
room. Lastly, data allows participants to create, main-
tain and search a collection of entries (i.e. records).
A.6 Interactivity and Gamification: this last axis
gathers the interactive or playful activities used by
teachers to animate their courses and make them more
attractive. Also identified on the basis of qualitative
analysis, and not revealed by the quantitative analy-
sis so far, lesson, course format, img, gallery, game,
lti, refer all to different activities that raise interactiv-
ity or gamification. While lessons introduce person-
alization of the sequences based on student’s inputs,
galleries allow to expose collections of pictures inter-
actively with the possibility to comment on them, and
lti allows to include external activities using the LTI
protocol. Eventually, we perceived the modification
of the course format itself as evidence of a reflection
a teacher can have on the interactions students will
have with the course.
4.2 Teaching Analytics Indicators
Based on the teachers’ behavior model derived from
the quantitative and qualitative analysis, we designed
three TA metrics for awareness and self-assessment.
a) LMS Usage Trends. The model we designed
allows to describe how teachers master the LMS
through different pedagogical axes. In order to de-
termine a TA indicator to support social awareness,
we decided first to provide teachers with a current
view of their position relative to the others, with re-
spect to the different axes. We propose here and for
each axis a clustering model in order to distinguish
groups of teachers based on their current behavior.
Thus for each of the axes, we applied the same pre-
processing steps we used in our quantitative analysis,
which consists of filtering variables that would de-
crease the model performance due to their low vari-
ances or their high correlation with each other. Based
on that cleaned dataset, we tested several clustering
algorithms (K-Means, Dbscan, Agglomerative clus-
tering and Gaussian Mixture).
To set the best number of clusters for each model
we relied on the silhouette score S: the mean of all
silhouette scores for each sample that range from -1
(worst) to +1 (best), where a high value indicates that
the sample (teacher) is well matched to its own cluster
and poorly matched to neighboring clusters. We then
retained the best model with regard to its mean sil-
houette score and the consistency of its clusters (and
outliers for Dbscan). The results are exposed in Table
3, with S the mean silhouette score, N the number of
clusters and O the number of outliers for Dbscan.
For each axis, the models converge towards a de-
tection of particular teachers (active teachers and non-
active teachers), and not towards a regular or homo-
geneous classification. This result is consistent with
other studies in literacy so far (Park and Jo, 2017).
The second axis ”Reflection”, initially characterized
by feedback and choice, contains only one feature that
is choice, because feedback was removed in the pre-
processing phase due to its low variance. This ex-
EKM 2022 - 5th Special Session on Educational Knowledge Management
582

Table 3: Results of the clustering analysis.
Axis Kmeans Dbscan Hierarchical
Clust.
Gaussian
mixt.
A.1 S=0.81,
N=2
S=0.85,
N=1,
O=3
S=0.84,
N=2
S=0.2,
N=2
A.2 S=0.91,
N=13
S=0.68,
N=1,
O=11
S=0.81,
N=6
S=0.89,
N=15
A.3 S=0.84,
N=2
S=0.92,
N=1,
O=2
S=0.77,
N=2
S=0.7,
N=2
A.4 S=0.83,
N=2
S=0.91,
N=1,
O=1
S=0.85,
N=2
S=0.59,
N=2
A.5 S=0.76,
N=2
S=0.81,
N=1,
O=1
S=0.76,
N=2
S=0.34,
N=2
A.6 S=0.98,
N=2
S=0.98,
N=1,
O=3
S=0.98,
N=2
S=0.87,
N=2
plains the number of clusters obtained by the four al-
gorithms that have classified the use of choices by
teachers from most to least active. On the other
hand, the models of the remaining axes consistently
returned two clusters that separate the most active
teachers from those who are not or faintly active. For
instance, after the analysis of the evaluation axis, Db-
scan gave the best results with a group of teachers that
use the evaluation tools minimally and three particu-
lar teachers that use most of these tools in a homoge-
neous and intensive way. The best silhouette scores
are obtained by the Dbscan algorithm, except for the
second axis which was Kmeans. We therefore chose
the DBscan algorithm because it is capable of detect-
ing specific instances of the platform usage (teacher
groups and outliers).
This first metric ”LMS usage trends” enables us
to detect groups and special instances (outliers) on
the different axes of our model, hence allowing the
teacher to identify the axes on which he/she is active
and those on which he/she is not.
b) Usage Scores. The previous metric gives an insight
about the present degree of teachers’ mastery with re-
spect to the group. However, the clustering method
discards some of the features (due to the required pre-
processing steps), and only provides an overall view
of the skills related to other teachers. Here we propose
two complementary indicators for self-awareness to
measure how the teacher profits from the LMS, based
on the complete model we designed. The following
usage scores complete the clustering method limits by
refining the teachers’ self-assessment and allowing a
better exploitation of our model.
Curiosity Score: this score indicates the teacher’s de-
gree of curiosity according to each axis. Counting
the number of non null variables over all the teacher’s
courses, it aims to encourage to discover other LMS
features within the axis. This score is formalized by
the next equation:
curiosity
a
(t) = |{
C
t
∑
c=1
x
t,i,c
, x
t,i
> 0 ∀i ∈ [1; m
a
]}| (1)
With x
t,i,c
the value of the feature i ∈ [1, m
a
] (m
a
the num. of features for the axis a) for the teacher t
in the course c ∈ [1,C
t
] and C
t
the number of courses
where the teacher t has at least one non null variable.
Regularity Score: this score considers how often a
teacher exploit the features related to an axis with re-
spect to their courses. In other terms, it helps vali-
dating a skill based on the repetition of practice. It is
calculated by the following formula (using the previ-
ous symbols):
regularity
a
(t) =
∑
m
a
i=1
|{x
t,i,c
, x
t,i,c
> 0 ∀c ∈ [1;C
t
]}|
m
a
·C
t
(2)
4.3 Application
We started the development of a tool to engage teach-
ers into learning situations regarding the different
axes of our model especially since many teachers
wanted such a tool to help them use the university’s
LMS as revealed by the results of the questionnaire on
LMS habits. The main dashboard of teachers is repre-
sented in Figure 4. Once logged, the teacher can have
an overview of his/her situation. Each axis is detailed
within a card in section A of the figure, with a differ-
ent background color and subtitle whether the teacher
was clustered as active or inactive, in other words,
it represents the trend of LMS use by the teacher.
The green color for the axes where the teacher has
a great tendency to use the functionalities of the plat-
form represented by the axis in question, and the red
color for the reverse case. For each card, the two dif-
ferent scores of curiosity and regularity are included
with values in percentage in order to facilitate teach-
ers’ self-assessment and comparison with scores from
other axes. A description of the axis, the definition
of the scores metrics and details about the clustering
are also provided in details for each axis. In section
B of the figure, we provide a radar visualisation that
sums up the two scores for the teacher to have a quick
comparative view of the different axes. This allows
teachers to easily see which scores have similar val-
ues or if there are outliers among each score. Radar
charts are also useful for seeing which variables score
A Self-assessment Tool for Teachers to Improve Their LMS Skills based on Teaching Analytics
583

high or low, making them ideal for displaying per-
formance. Moreover, according to the different met-
rics, our system can provide several automatic rec-
ommendations to improve the teacher’s skill (section
C in the figure) and following the teachers’ answers
to our questionnaires, most of them wanted to con-
tact their close colleagues or pedagogical engineers in
case of need. Therefore, when the teacher obtains low
scores or is clustered as inactive in an axis, if an ac-
tive peer exists with better metric values for that axis,
the system invites the current user to contact this peer,
giving a sample of one of his/her courses selected as
a relevant example. Proximity between teachers will
also be taken into consideration when recommending
to ensure that a close colleague is suggested to each
teacher. If no peers can be found, the system uses
a fallback and recommends to participate in an open
course the PE designed in relation to the axis, or to
contact them directly.
This support tool will be also addressed to PE, to
help them detect cases of importance. The figure 5
represents the pedagogical engineers’ dashboard. At
the top, a data table is provided to visualize the list
of teachers with their information (name, first name,
specialty and service) and a column to display the re-
sults of the evaluation of each teacher according to
the axes. This allows pedagogical engineers to have a
global view on the use of the platform by each teacher.
At the bottom right, a radar visualization shows the
average of the two scores (curiosity and regularity)
by axis. On the left, a bar chart summarizes the aver-
age number of active/inactive teachers by axis as well.
The data in these 3 elements (table, radar, bar chart)
depends on the filter at the top of the page that allows
PEs to select teachers according to their specialties or
departments to which they are assigned, which makes
it easier for them to interpret the teachers’ results.
The different TA metrics we propose can thereby be
used to detect teachers in particular needs for a certain
axis, in order to propose them consistent and precise
help. On the other hand, expert teachers in particu-
lar domains of competencies can also be identified, a
wish PE have as they are also looking for these pro-
files to obtain precise feedback on their LMS in order
to define its functional evolution, and to better orga-
nize tutoring for newcomers.
4.4 Limitations and Potential Flaws
Our behavior model is based on the results of both
qualitative and quantitative analysis we carried out.
While this model allows to describe in an intelligi-
ble way teachers’ activities on the LMS and appears
consistent with both current usage we can observe
through traces and human expert knowledge, these
analyses still have several limitations. We have in-
tegrated all teacher traces on the University’s LMS to
analyze their behavior, but many teachers use other
technologies to manage their teaching, whom we do
not have access to. Moreover, our study does not
take into account what happens in a class, outside the
technological environment, thus two different courses
may be represented the same way in our model. Fur-
thermore, our study considers all teachers the same
way. Although this has the advantage of identifying
context-independent trends, taking the context into
account could provide more refined profiles, partic-
ularly with the inclusion of the teaching field and
the targeted diploma or academic year. However,
the scarcity of our dataset did not allow us to apply
such differential study with the same methods. Also,
part of our dataset concerns the time of the lockdown
caused by COVID, where all the courses were per-
formed remotely with other tools (Teams, Zoom ..).
While the lockdown itself remains quite short, teach-
ers may have changed their habits afterwards, and our
model may not be valid anymore if such changes oc-
curred and will remain durably. A dedicated study
on this problematic is then required. For the teacher
questionnaire on LMS habits, there is a risk that the
population responding to it might not be representa-
tive. Indeed, teachers who are not interested in the
LMS or those who think to be experts do not answer
the questionnaire, and therefore it could be biased. In-
ternally, the model is representative of the teachers’
behavior, which is bound to evolve as well as the pop-
ulation itself (new teachers, others leaving the institu-
tion). The clusters must therefore be recalculated and
the optimum interval is not known. The structure of
the model (the axes) also depends on the functionali-
ties proposed by the LMS and partly on their use by
the teachers (quantitative analysis): this structure is
thus not stable in time. The model needs to be moni-
tored: certain axis functionalities can be added or re-
moved, new axes can be created or recomposed. Such
changes render the analysis of teachers’ evolution in
the long term a delicate task.
5 DISCUSSION AND
CONCLUSION
5.1 Conclusion and Perspectives
In this paper, we designed a behavioral model of
teachers based on a qualitative and a quantitative anal-
ysis. It describes teachers’ practices through six ma-
jor axes of mastery: evaluation, reflection, communi-
EKM 2022 - 5th Special Session on Educational Knowledge Management
584
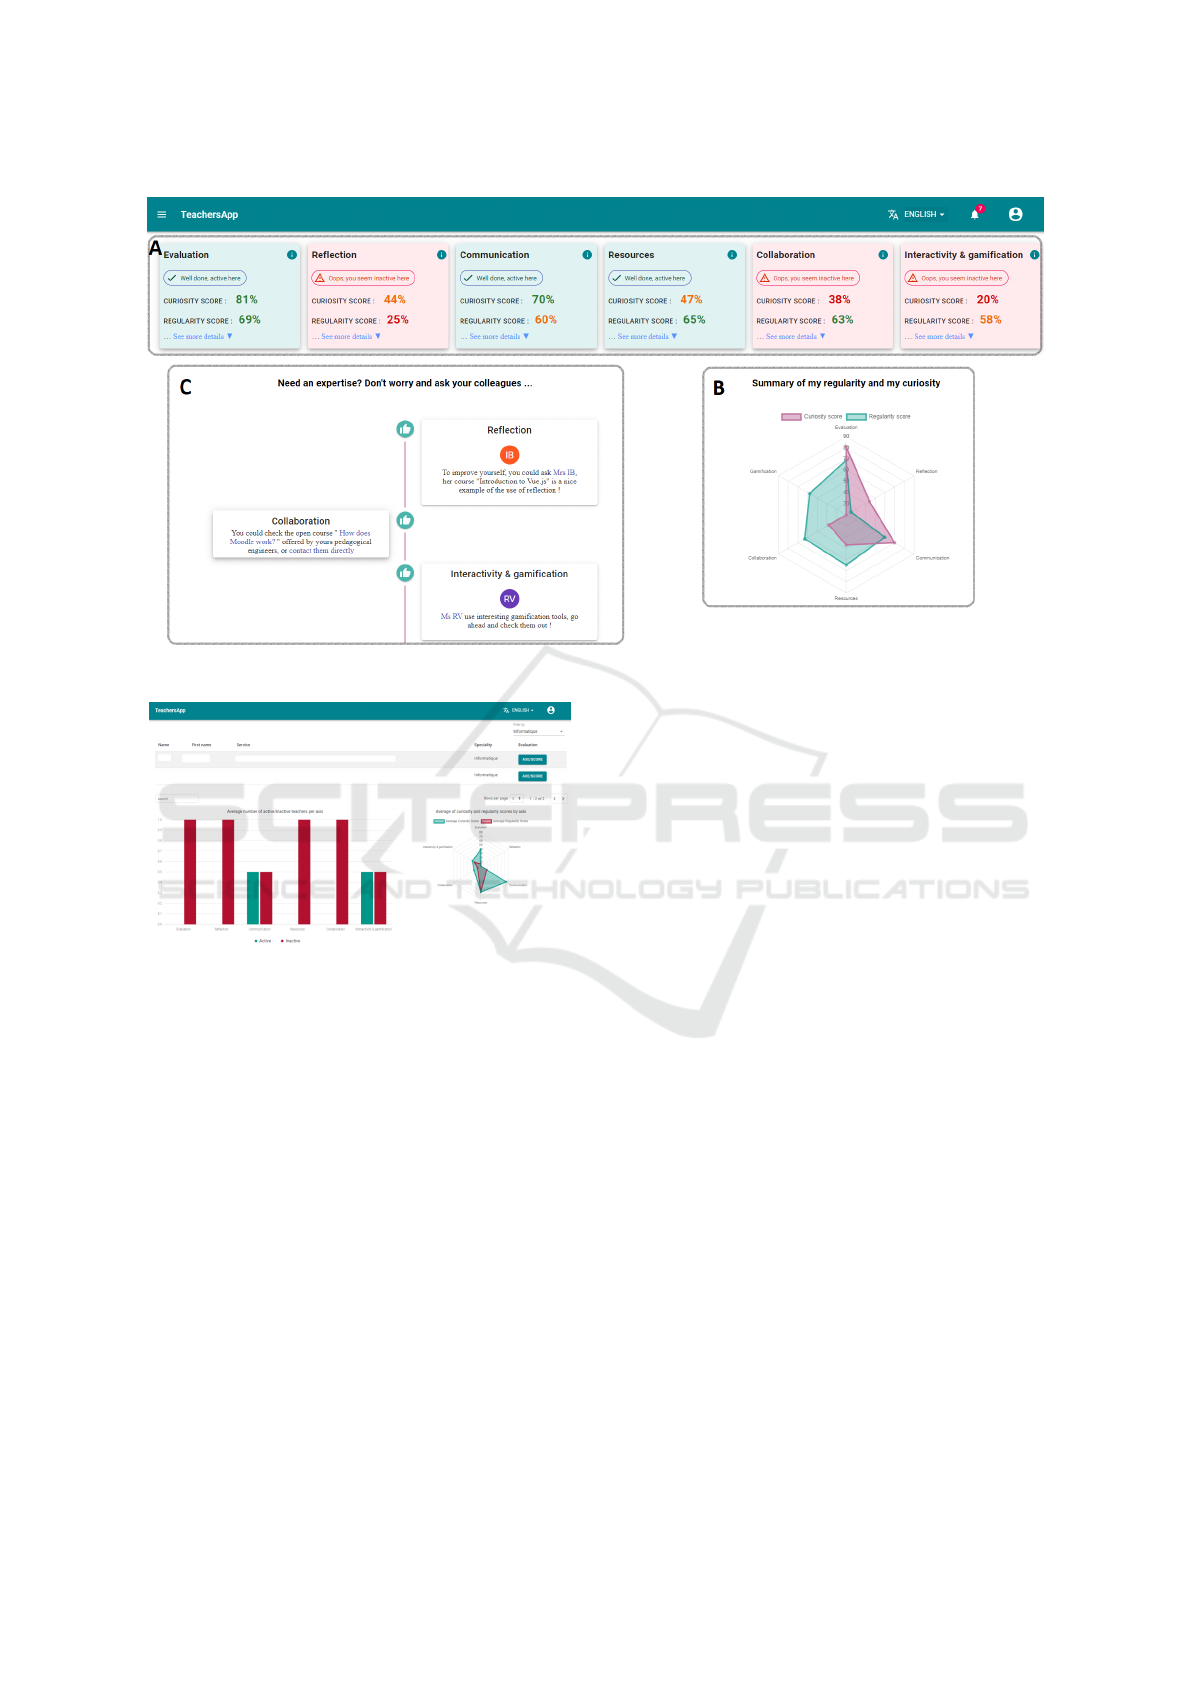
Figure 4: Teacher dashboard for self-assessment and recommendations.
Figure 5: The pedagogical engineers’ dashboard.
cation, resource, collaboration as well as interactiv-
ity and gamification. From this model, we designed
several TA indicators. Eventually, we proposed a first
prototype of a web application that exploits this model
and these indicators, dedicated to teachers and PE to
provide the former with self-assessment and recom-
mendations features, and to allow the latter to detect
teachers in specific needs and teachers with expert
profiles.
We will continue in the short term to refine our
model with the inclusion and analysis of new features
that would consolidate our axes, such as time related
features to express regularity or skill oversight. On
the other hand, other features may also provide new
axes, as with social related features to explore knowl-
edge diffusion through the LMS when teachers are
working together on the same course. Indeed, once
the first version of the tool will be operational, we
will experiment it at the scale of our University to
evaluate its usability, the interest teachers will show
in it, and then test whether it allows inducing learn-
ing situations and if recommendations are followed
and relevant. The recommendation algorithm, im-
plemented with a simple rule based system, requires
also to leverage an important issue: how to recom-
mend on the scarce data? Since teachers do not have
infinite free time for peer tutoring, and because our
model will always have a given latency before any
change, we have to avoid recommending the same tu-
tor too many times. Also, we have to take into account
the users’ proximity, that could be an important fac-
tor of success. Our model is agnostic to the learning
domain so far, and thus does not capture the differ-
ence of practice it may exist from one discipline to
another. Doing so may reduce such risk and at the
same time, improve the probability both teachers ben-
efit from sharing a professional context. At a longer
term, we will complete the development of a tool that
will allow teachers to self-assess and get recommen-
dations in order to enrich their practices on the LMS.
Also, we intend to conduct an experiment on the im-
pact that this tool can have on teachers’ practices.
REFERENCES
Alb
´
o, L., Barria-Pineda, J., Brusilovsky, P., and Hern
´
andez-
Leo, D. (2019). Concept-level design analytics for
blended courses. In European Conference on Tech-
nology Enhanced Learning, pages 541–554. Springer.
Avramides, K., Hunter, J., Oliver, M., and Luckin, R.
(2015). A method for teacher inquiry in cross-
A Self-assessment Tool for Teachers to Improve Their LMS Skills based on Teaching Analytics
585

curricular projects: Lessons from a case study. BJET,
46(2):249–264.
Barmaki, R. and Hughes, C. E. (2015). Providing real-time
feedback for student teachers in a virtual rehearsal
environment. In Proceedings of the 2015 ACM on
International Conference on Multimodal Interaction,
pages 531–537.
Cigdem, H. and Topcu, A. (2015). Predictors of instruc-
tors’ behavioral intention to use learning management
system: A turkish vocational college example. Com-
puters in Human Behavior, 52:22–28.
Coomey, M. and Stephenson, J. (2001). Online learn-
ing: it is all about dialogue, involvement, support and
control-according to the research. Teaching and learn-
ing online: Pedagogies for new technologies, pages
37–52.
Daele, A. (2014). La formation en ligne. les conseillers et
ing
´
enieurs p
´
edagogiques. Distances et m
´
ediations des
savoirs. Distance and Mediation of Knowledge, 2(7).
Dhahri, M. and Khribi, M. K. (2021). Teachers’ informa-
tion and communication technology (ict) assessment
tools: A review. In 2021 International Conference on
Advanced Learning Technologies (ICALT), pages 56–
60. IEEE.
Johnson, R. B., Onwuegbuzie, A. J., and Turner, L. A.
(2007). Toward a definition of mixed methods re-
search. Journal of mixed methods research, 1(2):112–
133.
Magaldi, D. and Berler, M. (2020). Semi-structured inter-
views. Encyclopedia of personality and individual dif-
ferences, pages 4825–4830.
Nashed, N. N., Lahoud, C., and Abel, M.-H. (2022). Edu-
cational resources recommender system for teachers:
Why and how? In Advances in Deep Learning, Artifi-
cial Intelligence and Robotics, pages 71–80. Springer.
Ndukwe, I. G. and Daniel, B. K. (2020). Teaching analytics,
value and tools for teacher data literacy: A systematic
and tripartite approach. IJETHE, 17(1):1–31.
Park, Y. and Jo, I.-H. (2017). Using log variables in a learn-
ing management system to evaluate learning activity
using the lens of activity theory. Assessment & Eval-
uation in Higher Education, 42(4):531–547.
Peraya, D., Charlier, B., and Deschryver, N. (2006). Ap-
prendre en pr
´
esence et
`
a distance: une d
´
efinition des
dispositifs hybrides. Distances et savoirs, 4:469–496.
Prieto, L. P., Sharma, K., Dillenbourg, P., and Jes
´
us, M.
(2016). Teaching analytics: towards automatic extrac-
tion of orchestration graphs using wearable sensors.
In Proceedings of the sixth international conference
on learning analytics & knowledge, pages 148–157.
Regueras, L. M., Verd
´
u, M. J., De Castro, J.-P., and Verd
´
u,
E. (2019). Clustering analysis for automatic certifica-
tion of lms strategies in a university virtual campus.
IEEE Access, 7:137680–137690.
Sampson, D. (2017). Teaching and learning analytics to
support teacher inquiry. In 2017 IEEE Global En-
gineering Education Conference (EDUCON), pages
1881–1882. IEEE.
Sergis, S. and Sampson, D. G. (2017). Teaching and learn-
ing analytics to support teacher inquiry: A systematic
literature review. Learning analytics: Fundaments,
applications, and trends, pages 25–63.
Setiawan, A., Munzil, and Fitriyah, I. J. (2021). Trend
of learning management system (lms) platforms for
science education before-after covid-19 pandemic.
In AIP Conference Proceedings, volume 2330, page
060005. AIP Publishing LLC.
Tamura, M. and Tsujita, S. (2007). A study on the number
of principal components and sensitivity of fault detec-
tion using pca. Computers & Chemical Engineering,
31(9):1035–1046.
Valsamidis, S., Kontogiannis, S., Kazanidis, I., Theodosiou,
T., and Karakos, A. (2012). A clustering method-
ology of web log data for learning management sys-
tems. Journal of Educational Technology & Society,
15(2):154–167.
Wang, W.-T. and Wang, C.-C. (2009). An empirical study
of instructor adoption of web-based learning systems.
Computers & Education, 53(3):761–774.
Whitmer, J., Nu
˜
nez, N., Harfield, T., and Forteza, D. (2016).
Patterns in blackboard learn tool use: Five course de-
sign archetypes.
Yuen, A. H. and Ma, W. W. (2008). Exploring teacher ac-
ceptance of e-learning technology. Asia-Pacific Jour-
nal of Teacher Education, 36(3):229–243.
EKM 2022 - 5th Special Session on Educational Knowledge Management
586
