
Image-based Lesion Classification using Deep Neural Networks
Ákos Hermann and Zoltán Vámossy
a
Software Engineering Institute, John von Neumann Faculty of Informatics, Óbuda University,
Bécsi Street, Budapest, Hungary
Keywords: Melanoma Detection, Machine Learning, Deep Neural Network, Image Processing.
Abstract: This research explores the topic of moles in cancer using a machine learning approach, with the aim of
designing and implementing a system that can determine whether a mole shows a melanoma-like abnormality
based on 2D input photographs, and thus whether further examination by a specialist is required. The target
system is built around a general-purpose convolutional network, GoogleNet InceptionV3, which has been
retrained for the task using a transfer learning technique. In addition to the system, an automated pre-
processing phase has been defined to reduce and eliminate anomalies and noise in each sample by means of
image processing operations. In conclusion, the system provided 156 correct diagnoses in 180 test cases,
indicating a test accuracy of 86.67%, making it an effective melanoma diagnostic tool.
1 INTRODUCTION
Today, according to the National Institute of
Oncology, melanoma is the 8th most common type of
cancer in Hungary (National Institute of Oncology,
2016).
Melanoma is a malignant lesion of the black-
brown pigment-producing cells in the skin, known as
melacytomas, and is one of the most aggressive types
of cancer. Although its development is not directly
linked to moles, as it can also occur on conventional
skin surfaces, they are at higher risk due to their
structure. Moles are skin surfaces with a higher
concentration of the aforementioned pigment-
producing cells. They are therefore at increased risk;
it has been estimated that nearly thirty percent of
melanomas develop from pre-existing moles
(Howard K., 1991, Balch, 2019).
As an aggressive type of cancer, melanoma not
only develops rapidly, but also metastasizes to other
organs in a very short period of time. Mainly to the
bones, or even to the brain, but also to other more
distant organs. Its danger lies precisely in this
characteristic. If the underlying disease is diagnosed
in time, the chances of cure are almost one hundred
percent (~99%), and the treatment consists only of
removing the mole and the surrounding tissue. If
detected later, at stage two or three, the former
a
https://orcid.org/0000-0002-6040-9954
survival rate drops dramatically to around fourteen
percent, and depending on the different metastases,
chemotherapy treatments may be required. Although
melanoma accounts for only one percent of all
diagnosed skin cancers, it alone is responsible for
nearly three quarters of all skin cancer deaths
(Rogers, 2015, American Cancer Society, 2016).
Timely detection is therefore key for healing but
assessing the lesions on moles is often not an easy
task, even for experienced dermatologists.
Identifying moles with cancerous lesions is a complex
problem that involves many factors:
Shape (possible asymmetry)
Irregularity of the edges of the mole
Color
Diameter
Increase over time.
Because of the complexity of the symptoms, an
accurate diagnosis can often only be made by biopsy.
However, this procedure not only causes pain, but in
many cases also scarring, among many other
inconveniences. The difficulties associated with the
procedure are often unnecessary if the mole is
diagnosed as benign.
In the case of software diagnostics, the above
factors are not present, so their effective usage could
certainly make the screening process less problematic
and time-consuming, thus contributing to a raised
Hermann, Á. and Vámossy, Z.
Image-based Lesion Classification using Deep Neural Networks.
DOI: 10.5220/0011126200003209
In Proceedings of the 2nd International Conference on Image Processing and Vision Engineering (IMPROVE 2022), pages 85-90
ISBN: 978-989-758-563-0; ISSN: 2795-4943
Copyright
c
2022 by SCITEPRESS – Science and Technology Publications, Lda. All rights reserved
85
awareness and consciousness to the general public as
the system offers a convenient solution to a problem
that must not be neglected.
2 A DEEP LEARNING
APPROACH
The main complication with the software approach is
the decision issue.
Before the excessive development and spread of
the field of artificial intelligence and machine
learning, the problem of classification was typically
solved using traditional methods. These attempts
mainly used SVM technology or Logistic Regression.
Solutions based on image processing techniques
alone were also encountered. A common feature of
these approaches is that they have not achieved
breakthroughs and have not proved to be more useful
in terms of results than flipping a coin.
The low accuracy of these methods is presumably
due to the difficulty in identifying the complex set of
symptoms of the lesion and the high variability of the
photographic samples. Indeed, the identification of
the visual aspects listed above requires a complex set
of image processing operations and, due to the
diversity of photographs and birthmarks, it is almost
impossible to produce a generally effective solution.
However, in recent years, the explosion in the
field of machine learning has enabled the general and
widespread use of different types of neural networks
(Jenei, 2021). The emergence of convolutional neural
networks, which work well for images and sounds,
also promised efficient classification of photographs
with a high degree of generalization.
The main strength of neural networks lies in their
generalisation ability, which, by their very nature, can
ignore irrelevant factors for classification, given a
sufficiently large learning database. Since the
efficiency of generalisation depends as much on the
size and diversity of the training dataset as on the
accuracy of classification, neural networks can be
considered as an ideal solution when sufficient data
are available (Szegedy, 2016).
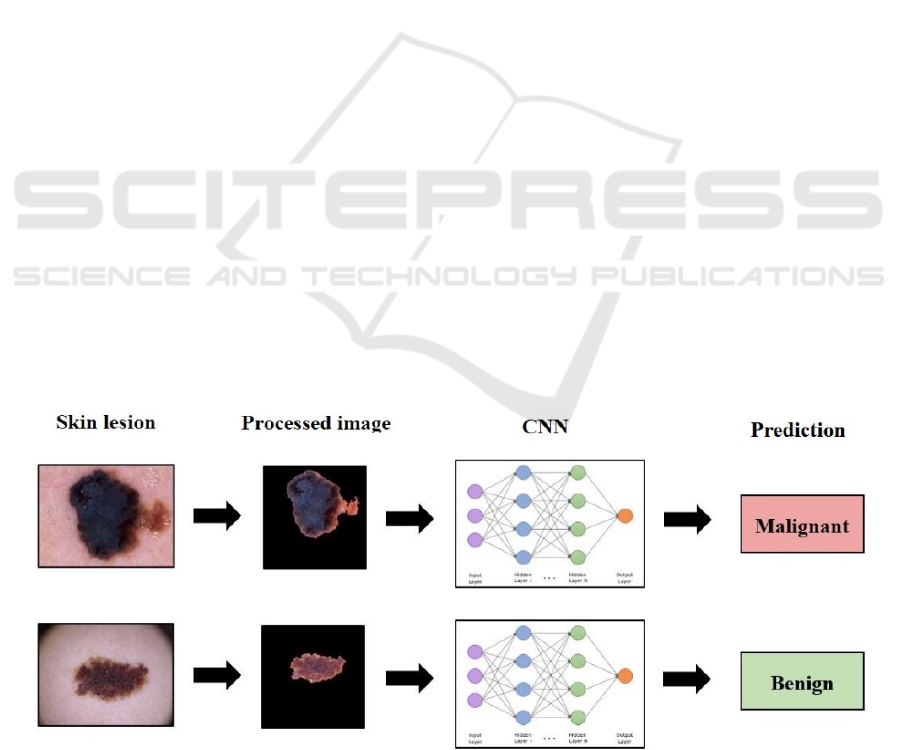
A schematic process describing the operation of
the designed system is shown in Figure 1.
2.1 The ISIC Database
The present research is based on the published and
freely available dermatological database of the
International Skin Imaging Collaboration (ISIC)
melanoma project.
The ISIC gallery consists of approximately
53,000 photographs of lesions with a 1:8 ratio of
confirmed melanoma to benign lesions. Although this
imbalance may at first seem worrying, using the same
number of teaching samples from both diagnostic
groups, we can still speak of a sufficient amount of
data.
The gallery is characterised by the fact that it
includes relatively standardised samples according to
a strict set of rules, which helps to use them in
scientific projects.
The project's gallery requirements include only
and exclusively annotated and biopsy-verified
specimens with mostly centrally located lesions of
good quality. There is no restriction on the device
used to take the photograph. Although this is
irrelevant from a medical point of view, it may be
Figure 1: Schematic of the envisaged melanoma diagnostic system (Kalouche, 2016).
IMPROVE 2022 - 2nd International Conference on Image Processing and Vision Engineering
86
difficult to detect differences due to the specificity of
the devices when processing the images. Having
studied the database, it can be stated that the
following anomalies need to be addressed in the pre-
processing of photographs (International Skin
Imaging Collaboration, 2020):
Different resolution
Different image size
Different illumination
Different skin color around the lesion
Presence of vignetting effect in some images
Presence of hairs in the images.
2.2 Preprocessing of the Data
The ISIC gallery shows a 1:8 bias in favour of benign
lesions in terms of number of samples. When the full
database is used, this imbalance can severely affect
the functioning of the neural network in such a way
that it tends to favour the said diagnostic group. To
avoid this, an equal number of approximately 6,000
photographs from each output category were used.
In order to maximise the accuracy of the
classification, it was necessary to remove anomalies
in the photographs and to remove irrelevant parts and
noise in order to maximise the accuracy of the
classification, given the relatively small number of
samples available.
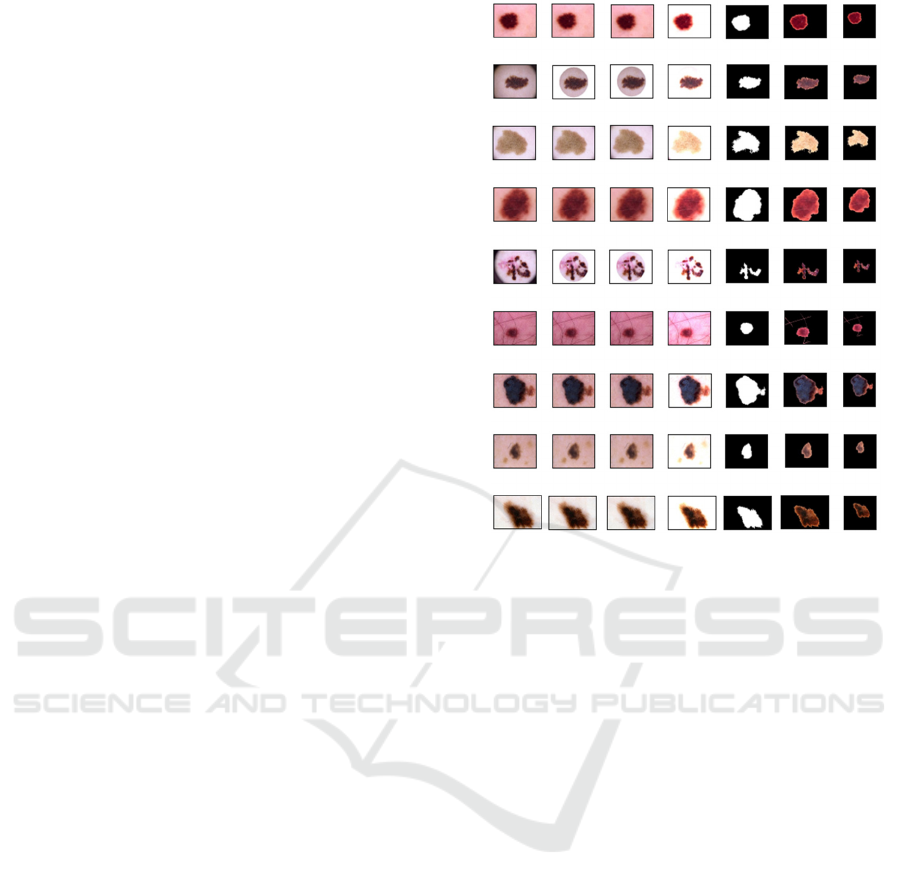
Consequently, a number of custom-made
functions were implemented to automate the
aforementioned processes (Figure 2). The resulting
set of image processing operations can be considered
as a complete pre-processing phase, suitable for both
the preparation of samples used in training and those
diagnosed in real-time. The phase is also responsible
for the uniformization of the images to form a suitable
input to the neural network.
As a first step in the processing, it is necessary to
check for the presence of the so-called vignetting
effect in the photo before starting the denoising
process. If so, it will need to be removed, which
means cropping the photo. This is essentially
blacking out the edges of the photo in circles to bring
out the essence of the content. However, its presence
is counterproductive from an image processing point
of view, as increasing the contrast value can also
highlight the edge of this circle, consequently fooling
the lesion detection algorithm. In order to avoid
unnecessary operations and possible loss of data due
to cropping, a conditional algorithm iterates over the
images in the database and decides whether the effect
is detectable by evaluating the conditions. If so, the
corners of the sample are clipped along a circle of
radius r from the centre of the image.
Figure 2: Pre-processing steps of the samples (from left to
right: original image, cropped, blurred, contrast, mask,
located, resized).
The next step is to de-noise the images. The
algorithm solves noise reduction by Gaussian
smoothing and increasing contrast. While the former
is responsible for thinning out the hairs present in the
sample, the latter helps to separate the edges of the
lesion from the background. The size of each
dimension of the filter mask and the amount of
contrast enhancement are both determined based on
the properties of the sample. In practice, this usually
means a 5×5 pixel square mask and a 60% contrast
enhancement. The latter operation not only increases
each pixel value by a multiple, but also increases it by
a constant beta value (1.1).
One of the advantages of real-life tests is that the
diagnosing specialists know exactly which factors are
relevant considering the diagnosis, so they focus only
on those. In contrast, convolutional networks are not
able to filter out irrelevant content clearly, so we have
to do this ourselves during pre-processing. The last
step before formatting is therefore the determination
of the region of interest. To perform this, a shallow
copy of the given photograph is made, and the phase
continues to work with it. The ROI is determined
based on a thresholding that operates on a run-time
value calculated from the sample parameters.
The result of the thresholding is then used to
search for each contour, from which the largest is
Image-based Lesion Classification using Deep Neural Networks
87

selected and the rest are discarded. Drawing the
selected contour line into an array of the same size as
the image, initially containing zero values, results in
a mask containing binary 1 values only at the location
of the pixels representing the lesion. Using a bit-level
AND operation, the mask just created is combined
with the original photograph to obtain the localized
birthmark with a black background color.
In order to use the samples just processed for deep
learning purposes, they need to be formatted
according to the expected input of the neural network.
In practice, this involves two simple steps. The
upright orientation photographs are rotated clockwise
by 90 degrees to ensure that the orientation
differences do not provide false information to the
CNN. The need for this operation is checked simply
by the ratio of the lengths of the sides. Since the
neural network used in this project receives inputs of
248×248 pixels, the last step in the processing is
rescaling. To do this, a black background image of the
same size as the longest side of the image is created
and the contents of the photo to be reduced are copied
onto it, starting from the top left corner. In the
resulting photo, the content is oriented towards the
top left corner, and can therefore be resized easily
without loss of data. (Kalouche, 2016)
2.3 The InceptionV3 based CNN
Architecture
Since during the preprocessing phase all samples are
converted to 248×248 pixels and the network operates
with RGB color space photographs, the base model is
initialized with input parameters of dimension
(248×248×3). In light of the knowledge transfer to be
applied, the top layers of the model are not imported.
The loaded layers use the original weight values set
on the ImageNet database (Russakovsky, 2015).
All the layers of the resulting model are then
frozen to ensure that their weight parameters are not
altered during the learning process.
In order to use the network as intended, it is
necessary to add additional layers: first, a layer with
a ReLU activation function of 1024 neurons is added
to the last, i.e. output ("mixed7") layer, which is
converted to one-dimensional. To obtain the
corresponding output, another layer is added, in this
case with a single neuron, activated by a softmax
function. In between the two layers attached to the
network, a dropout regularisation layer with a 20%
dropout rate is placed to facilitate higher-level
generalisation.
The model uses an RMSProp optimizer to
minimize the value of the loss function, which is an
optimizer that operates in a similar way to the
momentum-based solutions, but actually works by
parameter-level changes. Described by mathematical
equations, the operation of RMSProp is as follows:
(1)
where E[g
2
] is the moving average of squared
gradients, w is the weight, δC/δw is the gradient of the
cost function with respect to the weight, η is the
learning rate and β is the moving average parameter
(good default value: 0.9).
The corresponding learning rate is initialized at a
lower than usual value of one ten-thousandth.
The actual value of the loss function is calculated
using the binary cross-entropy function, which is
often used in the deep learning domain. To measure
the performance of the resulting network, various
metrics are calculated, which are: accuracy,
validation accuracy, average absolute error.
As a further regularization step, a callback
function implementing Early Stopping was
implemented to stop the teaching in time. The idea is
that it monitors the value of the validation loss
function and monitors the learning process of the
network, stopping it if the value of the function seems
to increase persistently over more than a predefined
number of epochs. In the case of the network, this
tolerance value is three epochs. The learning process
thus runs until it is stopped, or in other cases for 500
epochs.
The complete network configuration is
summarised in Table 1.
Table 1: Parameter values of the network.
Parameters Values
Learning rate 0.001-0.0001
Epoch count 500
Color mode RGB, 3 channels
In
p
ut format
(
248 × 248 × 3
)
Data Au
g
mentation Yes
Activation function ReLU, Softmax
Optimize
r
RMSprop
Dropout laye
r
Yes, rate = 0.2
3 RESULTS AND EVALUATION
During the testing phase, we tried to test the
constructed network with as many combinations of
IMPROVE 2022 - 2nd International Conference on Image Processing and Vision Engineering
88

parameters and complementary methodologies as
possible, with or without them, in order to obtain the
most optimal solution. As a consequence, each
attempt differs in several aspects.
As a first step, the built model was tested both on
the ISIC gallery processed by the demonstrated pre-
processing phase and on the raw database, thus testing
the need for pre-processing and segmentation. In both
cases, the model was instantiated with the same
parameterization as presented, so the results can be
considered representative. The constructed network
produced a segmentation accuracy approximately 6%
higher when using the former dataset, indicating that
the noise filtering phase does help the classification
process.
With this in mind, further experiments were based
on the processed data set alone, in some cases
supplemented by data augmentation steps. This
measure theoretically helps to diversify the database,
thereby increasing the number of cases covered and
improving the generalisation capability of the
network. The results of the two approaches are
summarised in Table 2.
From the analysis of the table just seen, an
interesting observation can be made: although higher
teaching and validation accuracy is observed for the
network that does not augment the data, the testing
accuracy indicates the performance superiority of the
latter. This is presumably due to the better
generalisation ability resulting from the increased
data set.
Table 2: Parameter values of the network.
No data
augmentation
Data
augmentation
applied
Color
mode
RGB RGB
Accuracy 83.07% 81.68%
Validation
accurac
y
77.22% 72%
Correct
melanoma
prediction
60 / 90 70 / 90
Correct
benign
prediction
88 / 90 86 / 90
All correct
prediction
148 / 180 156 / 180
Total test
accurac
y
82.22% 86.67%
In addition, it is also noticeable that the first
network was more prone to false-negative diagnosis,
as 30 out of 90 cases were considered benign,
otherwise cancerous lesions. In contrast, the network
learning on the augmented dataset made only 20 such
diagnostic errors, 33% fewer than the case without
data augmentation. It is worth noting that the number
of false positive predictions is almost identical, with
only a minimal difference. The learning process was
also monitored, so that, in addition to the loss
function, the evolution of the average absolute error
was also observed, with a value of 27.68% by the end
of the learning process.
4 CONCLUSIONS AND FUTURE
WORK
In summary, a relatively high classification accuracy
can be achieved using the InceptionV3 convolutional
neural network, even with a relatively small amount
of data. However, it is important to highlight that, as
shown in Table 1, the model tends to prioritise false-
negative diagnoses, even in cases where it is very
likely to be certain of the diagnosis. One possible
explanation for this phenomenon is that, when
examining the database, it can be stated that
photographs showing melanoma lesions contain a
higher degree of noise and are also fundamentally less
accurately segmented due to their asymmetric shape.
This reduced segmentation efficiency, in turn, leads
to an increase in the number of training samples that
become unusable, which in turn leads to a reduction
in the number of photos that can be used in the
learning process. Consequently, there is a minimal
imbalance in the proportion of samples used, which
may explain the phenomenon described.
While the idea of diagnostics relying specifically
on software solutions seems utopian for the time
being, the results of the system described here clearly
indicate the viability of using artificial intelligence in
this way, whether in melanoma diagnostics or other
medical fields.
The primary objective of the improvement is to
increase the classification accuracy achieved. To this
end, a number of steps can be formulated, mostly
aiming at increasing the number of database,
improving the efficiency of the pre-processing phase
or modifying the network architecture.
An obvious solution could be to increase the
number of cases covered. This could be done by
adding another database with similar samples to the
current dataset. On the other hand, resolving the
imbalance in the database could also lead to a
significant improvement, as it would allow the
exploitation of the full ISIC gallery. In the latter case,
Image-based Lesion Classification using Deep Neural Networks
89

the use of one of the Oversampling and T-link
methodologies would seem to be worthwhile.
In terms of the pre-processing phase, the
improvement is to maximise efficiency. The
bottleneck in processing photographs is to determine
the longest contour line needed to locate the lesions.
This can be explained by the sensitivity of the formula
for calculating the threshold used to determine the
contour to certain parameters. For this reason, it
would therefore seem worthwhile to find a solution
that is less dependent on the average intensity of the
photograph and the patient's skin color.
From an architectural point of view, replacing the
currently used classification model could lead to an
improvement in accuracy. It may be worthwhile to
experiment with the VGG-16, a general-purpose
convolutional network, instead of the current
GoogleNet InceptionV3 model. Furthermore, the use
of two convolutional networks in combination, for
verification purposes, could be a more far-reaching
development direction.
In addition to increasing accuracy, it is also worth
focusing on reducing the number of false negative
predictions. The tendency of the system to produce
false-negative results has been mentioned on several
occasions, exposing the user to significant health
risks. To overcome this phenomenon, it may be useful
to implement a loss function that penalizes false-
negative results more than false-positive ones
(International Skin Imaging Collaboration, 2020).
ACKNOWLEDGEMENTS
The authors would like to thank both the GPGPU
Programming Research Group of Óbuda University
and the Hungarian National Talent Program (NTP-
HHTDK-21) for their valuable support.
REFERENCES
American Cancer Society (2016), Cancer Facts & Figures
2016, American Cancer Society, Atlanta, GA, USA.
Balch, Charles M., Atkins, Michael B., Garbe, Claus,
Gershenwald, Jeffrey E., Halpern, Allan C., Kirkwood,
John M., McArthur, Grant A., Thompson, John F.,
Sober, Arthur J.(2019) Cutaneous Melanoma, Springer
International Publishing, ISBN: 978-3-03-005068-9,
978-3-03-005070-2
Howard K. Koh M.D. (1991) Cutaneous Melanoma, In: N
Engl J Med. July 18, 1991, 325 pp. 171-182, DOI:
10.1056/NEJM199107183250306
International Skin Imaging Collaboration (2020) SIIM-
ISIC 2020 Challenge Dataset. International Skin
Imaging Collaboration https://doi.org/10.34970/2020-
ds01.
Jenei, AZ., Kiss, G., Tulics, M G., Sztahó, Z. (2021)
Separation of Several Illnesses Using Correlation
Structures with Convolutional Neural Networks, Acta
Polytechnica Hungarica, vol. 18. no. 7. pp. 47–66.
Kalouche, Simon (2016) Vision-Based Classification of
Skin Cancer using Deep Learning. Stanford
National Institute of Oncology (2016), National Cancer
register, https://onkol.hu/nemzeti-rakregiszter/, last
visited: 2021.02.28
Rogers HW, Weinstock MA, Feldman SR, Coldiron BM.
(2015) Incidence Estimate of Nonmelanoma Skin
Cancer (Keratinocyte Carcinomas) in the U.S.
Population, 2012. JAMA Dermatol. 2015
Oct;151(10):1081-6. DOI: 10.1001/jamadermatol.20
15.1187. PMID: 25928283.
Russakovsky, O. et al. (2015) Imagenet large scale visual
recognition challenge. Int. J. Comput. Vis. 115, pp.
211–252.
Szegedy, C., Vanhoucke, V., Ioffe, S., Shlens, J. and
Wojna, Z. (2016) Rethinking the inception architecture
for computer vision. In: Proc. of the IEEE Conference
on Computer Vision and Pattern Recognition (CVPR),
pp. 2818-2826
IMPROVE 2022 - 2nd International Conference on Image Processing and Vision Engineering
90
