Swept-source Phase-Stabilized Optical Coherence Tomography Setup
for Elastography
Ana Batista
1a
, Carlos Correia
1b
, Sílvia Barbeiro
2c
, João Cardoso
3d
, José P. Domingues
1,3 e
,
Rafael Henriques
2f
, Custódio Loureiro
3g
, Mário J. Santos
4h
, Pedro Serranho
1,5 i
,
Rui Bernardes
1,6 j
and Miguel Morgado
1,3,* k
1
University of Coimbra, Coimbra Institute for Biomedical Imaging and Translational Research (CIBIT),
Institute for Nuclear Sciences Applied to Health (ICNAS), Coimbra, Portugal
2
University of Coimbra, CMUC, Department of Mathematics, Coimbra, Portugal
3
University of Coimbra, Department of Physics, Faculty of Science and Technology, Coimbra, Portugal
4
University of Coimbra, Department of Electrical and Computer Engineering, Faculty of Science and Technology,
Coimbra, Portugal
5
Universidade Aberta, Mathematics Section, Department of Science and Technology, Lisbon, Portugal
6
University of Coimbra, Clinical Academic Center of Coimbra (CACC), Faculty of Medicine (FMUC), Coimbra, Portugal
Keywords: Optical Coherence Elastography, Swept-source OCT, Phase Stabilization.
Abstract: We present an Optical Coherence Elastography (OCE) system, based on a swept-source Optical Coherence
Tomography (OCT) setup, and evaluate its performance in terms of phase stability and minimum detectable
displacement. The ability to record sub-pixel movements in samples under dynamic conditions was also
assessed. The OCE system has a time stability of 396.9 ± 46.7 ps. The phase stability, given by the standard
deviation of the measured phase difference, was 72.44 mrad, which corresponds to a minimum detectable
displacement of 6.11 nm. Tests showed that the OCE system can detect and measure sub-pixel movements in
samples under dynamic mechanical excitation.
1 INTRODUCTION
Optical Coherence Elastography (OCE) is a recent
imaging modality that maps mechanical properties,
by using Optical Coherence Tomography (OCT) to
measure tissue displacement after mechanical
excitation (Kirby et al., 2017; Larin & Sampson,
2017). Elastography is an inherently highly sensitive
technique, since tissue stiffness provides a dynamic
a
https://orcid.org/0000-0002-5672-8266
b
https://orcid.org/0000-0002-2947-1880
c
https://orcid.org/0000-0002-2651-5083
d
https://orcid.org/0000-0002-8832-8208
e
https://orcid.org/0000-0002-0562-8994
f
https://orcid.org/0000-0003-4173-8469
g
https://orcid.org/0000-0001-7856-2124
h
https://orcid.org/0000-0002-0188-7761
i
https://orcid.org/0000-0003-2176-3923
j
https://orcid.org/0000-0002-6677-2754
k
https://orcid.org/0000-0001-9455-1206
* Corresponding author
range that can reach six orders of magnitude and OCT
has the potential of measuring sub-nanometric
displacements. Compared to current clinical
elastography techniques, based on ultrasound or
magnetic resonance imaging, OCE has the advantage
of providing better spatial resolution (1 to 10 μm), and
imaging rate (higher than 1 kHz). The main limitation
of OCE is its low penetration depth of just a few
millimetres (Kennedy et al., 2014). However, this
Batista, A., Correia, C., Barbeiro, S., Cardoso, J., Domingues, J., Henriques, R., Loureiro, C., Santos, M., Serranho, P., Bernardes, R. and Morgado, M.
Swept-source Phase-Stabilized Optical Coherence Tomography Setup for Elastography.
DOI: 10.5220/0011126500003209
In Proceedings of the 2nd International Conference on Image Processing and Vision Engineering (IMPROVE 2022), pages 269-274
ISBN: 978-989-758-563-0; ISSN: 2795-4943
Copyright
c
2022 by SCITEPRESS – Science and Technology Publications, Lda. All rights reserved
269

disadvantage is not a limiting factor when imaging
ocular tissues.
The high sensitivity of OCE is obtained using
phase-sensitive detection techniques. Therefore, OCT
instruments for elastography must have a high phase
stability, being necessary to minimize the timing
jitters and mechanical instabilities and to maximize
the signal-to-noise ratio (SNR). Timing jitters are
more relevant in swept-source systems than
spectrometer-based Fourier-domain setups, because
of the frequency jitter introduced by wavelength
sweeping based on mechanical moving mirrors
(Moon & Chen, 2018).
Several approaches have been implemented to
improve phase-stabilisation. Common solutions
include using optical timing references, implemented
with Mach-Zehnder Interferometers (MZI) optical
clocks and Fiber Bragg Gratings (FBG) wavelength-
dependent triggers (Moon & Chen, 2018). The MZI
provides a clock signal that is periodic in the
wavenumber space, usually called k-clock, which is
responsible for relative timing. The FBG triggers
provide an accurate timing of a given spectral
wavelength. Additional reference signals, by setting
up a second reference arm, also were proposed
(Vakoc et al., 2005). The best results are obtained
with a common-path OCT configuration, allowing to
measure displacements as low as 0.3 𝑛𝑚 (Li et al.,
2020). However, with a common-path configuration,
space compatibility between the setups for
mechanical excitation and optical sensing is difficult
(Lan et al., 2017). This is particularly true for eye
fundus imaging.
Here, we report on our swept-source OCE (SS-
OCE) setup and its phase stability. The OCE system
was implemented with the purpose of imaging
mechanical properties of the retina of mice. Phase
stability performance was achieved by using a MZI
optical clock and a FBG optical trigger, combined
with a novel algorithm for measuring phase-
differences (Batista et al., 2022, submitted), and post-
processing timing correction using the digitised
trigger signal as reference. Tests performed in
dynamic conditions, using agarose phantoms that
mimic the optical and mechanical properties of
biological tissues, showed that the OCE system can
detect and measure movements smaller than the axial
pixel size, which is around 320 nm in our system,
Measurements of phase stability resulted in a
minimum measurable displacement of 6.11 nm.
2 SS-OCE SETUP AND DATA
ACQUISITION
2.1 Instrumentation
Figure 1 presents the schematic of our home-built SS-
OCE system. It consists of a swept-source OCT (SS-
OCT) and uses, for the dynamic mechanical
excitation of the sample, a piezoelectric actuator (P-
287, Physik Instrumente GmbH & Co., Karlsruhe,
Germany), or a 10 MHz ultrasound A-scan probe
(Imasonic, Voray sur L'Ognon, France). The SS-OCT
is based on a swept-source laser (Axsun, Excelitas
Technologies Corp., Mississauga, Canada) emitting
at a central wavelength of 1060 𝑛𝑚, with a bandwidth
of 110 𝑛𝑚 and a repetition rate of 100 𝑘𝐻𝑧. The
wavelength sweep is implemented by a tunable
MEMS (micro-electromechanical system) filter. The
laser source includes a fiber-based MZI to provide a
k-clock output, evenly spaced in wavenumber space,
for direct analogue-to-digital (A/D) sampling. This
makes possible to sample the OCT interferogram
linearly in wavenumber, allowing its subsequent
direct Fourier processing.
The laser output is split by a 90 to 10 optical fiber
coupler, with 90% of the light being used to produce
the SS-OCT interferograms and the remaining 10%
directed into an FBG (OE Land, Quebec, Canada,
λ
0
= 990 𝑛𝑚, reflectivity of 99.99%, Δλ = 0.352 𝑛𝑚).
The FBG is used to produce trigger pulses
synchronised with the spectral event corresponding to
the Bragg wavelength of 990 𝑛𝑚 (measured
value = 990.128 𝑛𝑚). The optical reflection signal of
the FBG, occurring at 990 nm, is converted into an
electrical signal by a photodiode amplifier and
formatted by a digital delay and pulse generator
(DG535, Stanford Research Systems, CA, USA).
The light used by the OCT is further split 90:10,
respectively, into the sample and reference arms. In
the sample arm, the light is delivered and collected
from the sample using a 50:50 optical fiber coupler
and a long working distance, infinity-corrected,
microscope objective (LSM03-BB, Thorlabs Inc.,
Newton, NJ, USA). The optical setup of the sample
arm can be changed when imaging samples
containing optical elements, like mice’s eyes. In the
reference arm, light is reflected from a stationary
reference mirror. An in-line fiber optic polarization
controller is used to remove differences in
polarisation between the sample and reference
signals.
Imaging4OND 2022 - Special Session on New Developments in Imaging for Ocular and Neurodegenerative Disorders
270
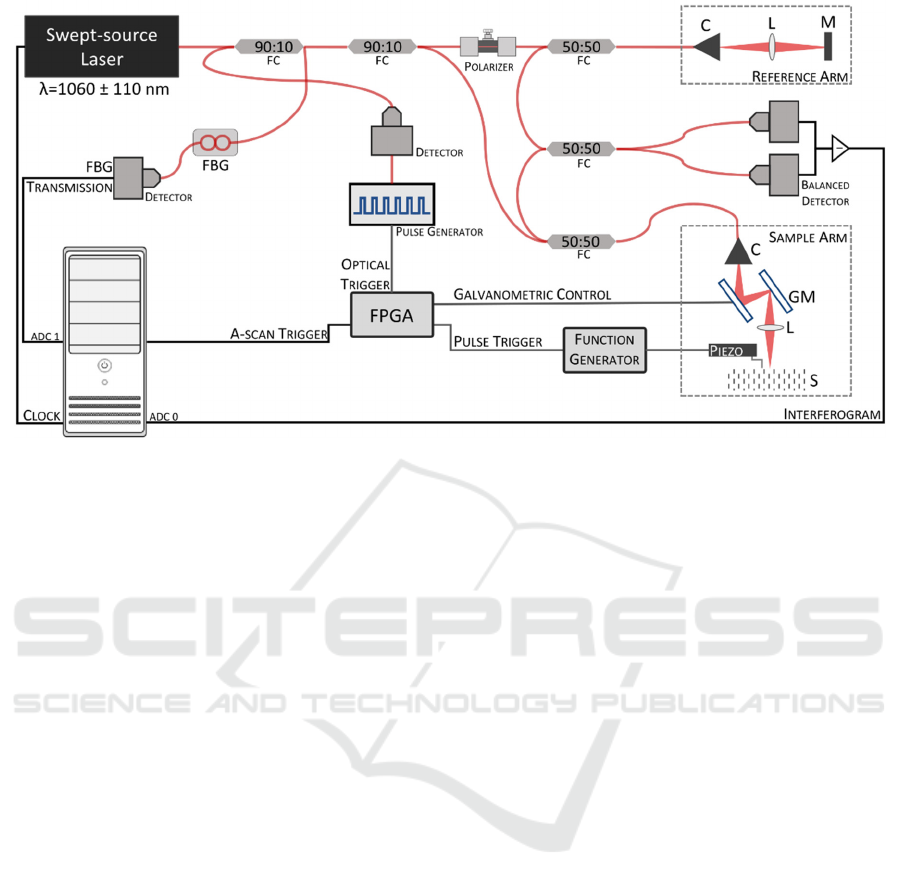
Figure 1: Schematic representation of the SS-OCE system. C – Collimator, L –Lens (microscope objective), M – Mirror, GM
– Galvanometric mirrors, ADC – analogue-to-digital converter channel, FC – Fiber Coupler, FBG – Fiber Bragg Grating.
Interference between light coming from the
sample and reference arms occurs in a 50:50 optical
fiber coupler. The interference fringes are detected by
a balanced photodetector (PDB471C, Thorlabs Inc.),
which removes common-mode noise. The output of
the photodetector is digitised by a data acquisition
(DAQ) board (X5-400M, Innovative Integration,
Inc., Indianapolis, IN, USA), using the trigger derived
from the FBG-generated signal and the laser k-clock
output as the sampling clock. Samples are acquired at
400 MHz, with a resolution of 14-bit.
The optical transmission signal from the FBG is
also digitised, using the second A/D channel of the
DAQ board. This signal is used as timing reference
during a post-processing step for additional timing
jitter correction. In this step, any shift occurring in the
timing reference signal is compensated by shifting the
interferogram by an equivalent value. This correction
is seldom used, as shifts in the timing reference signal
are rare events.
The two-dimensional scanning of the sample is
achieved by a pair of galvanometric mirrors
(GVS002, Thorlabs, Inc.). Their servo drivers are
driven by two 16-bit DACs (LTC2642 from Linear
Technology) with a settling time of 1 μs, programmed
through a 50 MHz SPI interface.
System synchronisation and timing control is the
task of a custom-programmed Xilinx XC6SLX45
field-programmable gate array (FPGA). This device
receives the trigger from the digital delay generator
and produces, with adequate timing, the DAQ board
trigger, the transient pulse that triggers mechanical
excitation and the signal that enables galvanometers
to move. The FPGA is programmed by the SS-OCE
control software running on a PC, through an SPI link
provided by an Adafruit FT232H Breakout module.
2.2 Control and Acquisition Software
The OCE control software was developed using
object-oriented programming (Microsoft Visual
C++/IDE) for the 64-bit Microsoft Windows
operating system. Libraries from Innovative
Technologies were used to deal with data acquisition
and DAQ board control.
The software implements the standard OCT
acquisition modes: axial A-scan in the sagittal plane,
cross-sectional B-scan, in the transversal plane and
volumetric acquisition, which can be used to present
C-like scans in the coronal plane. Elastography
measurements require collecting data using the M-B
scanning protocol (Kirby et al., 2017). In this
protocol, axial scans are repeated 512 times at a given
location. This corresponds to a scanning time of
5.12 ms per location. B-scans are then generated by
matching in time several distinct lateral locations.
Typically, imaging is performed in 512 distinct lateral
positions covering approximately 6.25 mm, in steps
of 12.20 μm. Sample mechanical excitation occurs
once per each lateral location, with a delay of 200 μs
(corresponding to 20 A-scans) to the beginning of
data acquisition for that location.
Swept-source Phase-Stabilized Optical Coherence Tomography Setup for Elastography
271
3 DISPLACEMENT
CALCULATION
In phase-resolved OCE, the displacement Δ𝑑 is
calculated from the measured phase difference, 𝛥𝜙,
according to (Kennedy et al., 2014):
Δ𝑑 𝛥𝜙
𝜆
4
𝜋𝑛
(1)
where, 𝜆
0
is the central wavelength of the laser, and 𝑛
is the sample’s refractive index.
The phase difference, 𝛥𝜙, at each depth 𝑧, is
computed as the difference between the phase of two
consecutive A-scans (𝜙
1
(𝑧) and 𝜙
2
(𝑧)), acquired at
the same lateral location:
𝛥𝜙
𝑧
𝜙
𝑧
𝜙
𝑧
. (2)
A-scan phases are obtained from the inverse
Fourier transform of the interferograms.
We developed a new method to measure phase
differences in OCE (Batista et al., 2022, submitted).
Briefly, if we consider 𝐺(𝑘) a function in the
wavenumber (frequency) k-space, obtained by
concatenating two consecutive interferograms from
the same location, 𝐹
1
(𝑘) and 𝐹
2
(𝑘), where 𝐹
1
(𝑘) is
flipped prior to concatenation, its phase (ϕ
𝐺
), given by
the angle of its inverse discrete Fourier transform
(IDFT), 𝑔(𝑧), is equivalent to:
𝜙
𝜙
𝜙
𝑟𝑎𝑚𝑝 Δ𝜙 𝑟𝑎𝑚𝑝
(3)
where ramp corresponds to an amount linearly
dependent on depth that ranges from 0 to 2π for the
entire signal. So, phase differences can be computed
directly from the IDFT of the concatenated spectra.
4 SYSTEM EVALUATION
Here we present results concerning the timing and
phase stability performance of the SS-OCE system
and show that the system can detect and measure axial
movements smaller than its axial pixel size.
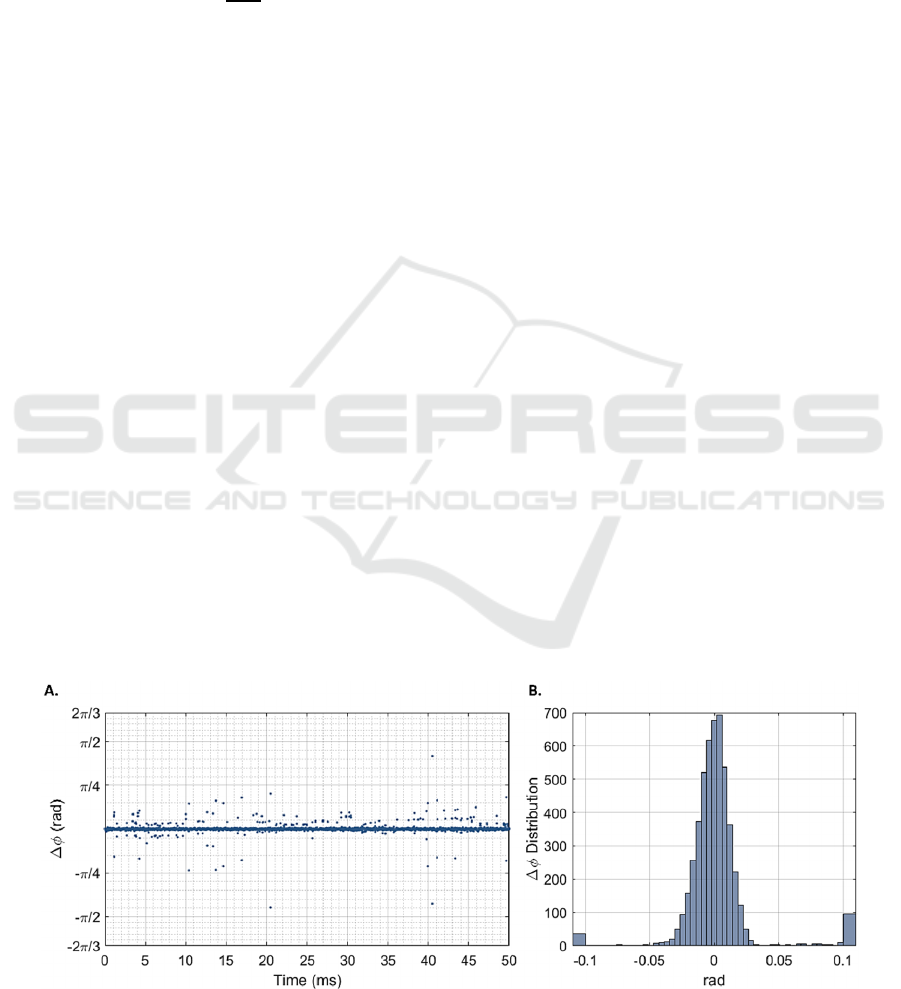
4.1 Time and Phase Stability
For assessing the time and phase stability of our OCE
system, we made measurements in static conditions,
i.e., without any mechanical excitation, using a gold-
coated mirror as sample. Data was recorded with the
sample located at the position where the optical path
difference between the sample and the reference arm
of the OCT interferometer is close to zero, with this
position corresponding to the highest signal to noise
ratio (SNR).
The system’s time stability was assessed by the
standard deviation of the interference fringes arrival
time at zero-crossing (Li et al., 2020). For finer
analysis, we used a cubic interpolation of the data, at
zero-crossing, to achieve a time resolution of 3.5 ps.
Measurements showed that our SS-OCE has a time
stability of 396.9 ± 46.7 ps.
The phase stability was assessed by the standard
deviation of the measured phase difference (σ
Δ
𝜙
) in
static conditions. Following equation (1), this value
can measure the minimum detectable displacement.
Figure 2 shows the phase differences over 5000
consecutive interferograms and their distribution.
When considering full volumes of 512 M-scans, the
distribution of phase differences presents a standard
deviation σ
Δ
𝜙
of 72.44 mrad, which, according to
equation 1, corresponds to a minimum detectable
displacement of 6.11 nm.
Figure 2: Phase differences (𝛥𝜙) for a static gold-mirror at highest signal-to-noise ratio, over 5000 consecutive interferograms
(A) and their overall distribution (B). This distribution presents a standard deviation σ
Δ𝜙
equal to 72.44 mrad.
Imaging4OND 2022 - Special Session on New Developments in Imaging for Ocular and Neurodegenerative Disorders
272
4.2 Performance in Dynamic
Conditions
To assess the performance of the SS-OCE in dynamic
conditions, we used transient pulses to induce surface
motion in homogeneous agarose phantoms with
tissue-mimicking characteristics. These phantoms
were prepared by mixing, while stirring, agar with
distilled water at high temperature (85
o
C). Glass
microspheres were added to the mixture to increase
optical scattering. The mixture was placed into
cylindrical containers for moulding and cured for
24 h. The produced phantoms had diameters and
heights of approximately 5.2 cm and 3.5 cm,
respectively.
The mechanical excitation of the phantoms was
provided by the piezoelectric actuator, driven by
different pulse widths of 200 μs, 300 μs, 400 μs and
500 μs, at a fixed amplitude of 200 mV. These pulses
induced, on the surface of the phantoms,
displacements lower than the size of the A-scan pixel
of the SS-OCT system (around 320 nm). This implies
that these displacements were not measurable from
the OCT A-scans, which correspond to the plot of the
amplitude of the IDFT of the interferograms.
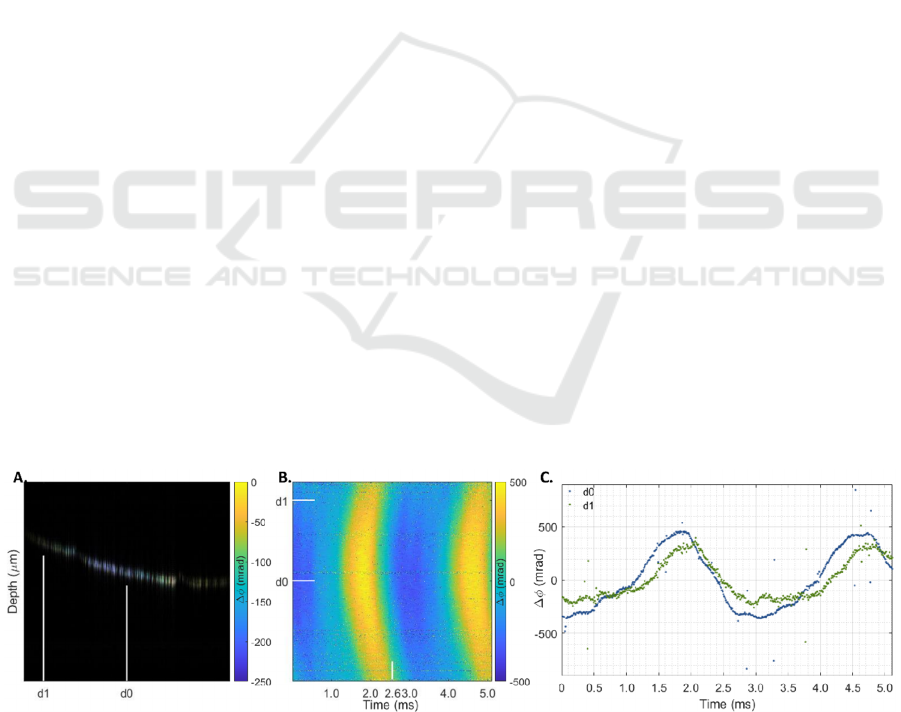
Figure 3 shows the phase difference ( 𝛥𝜙 )
reconstruction for a homogeneous phantom with an
agarose concentration of 10 g/l, after mechanical
excitation by a transient pulse of 200 μs. The figure
includes the structural B-scan and 𝛥𝜙 overlay at
2.56 ms (A), the projection over time for all 512
locations (B) and the 𝛥𝜙 curves for two locations
closer to (d0) and further away (d1) from the
excitation point (C). The mechanical excitation was
applied approximately 1 mm away from the OCT
beam scanning direction (C). From these figures, the
SS-OCE system’s ability to record sub-pixel
displacements is evident.
5 CONCLUSION
We presented a custom-built, swept-source OCE
system, and evaluated its performance under static
and dynamic conditions.
The developed SS-OCE presented a time stability
of 396.9 ± 46.7 ps. The measured phase stability,
given by the standard deviation of the distribution of
phase-differences measured in stationary conditions,
was 72.44 mrad. This corresponds to a minimum
detectable displacement of 6.11 nm.
Tests under dynamic conditions showed that the
OCE system can detect and measure sub-pixel
movements in samples under dynamic mechanical
excitation. The observed phase-differences and,
therefore, sample displacements confirm that the
system meets the requirements posed by biomedical
applications of optical coherence elastography.
The phase stability performance of the OCE
system can still be improved. In the shot noise limit,
the minimum measurable phase difference
corresponds to the reciprocal of the square root of the
signal-to-noise ratio (Hyle Park et al., 2005). The
phase stability of our system is still one order of
magnitude higher than this theoretical limit. One
approach to improve the phase performance of the
OCE system is to optimize the delays between the
timing signals (trigger and clock) and the
interferogram. It was shown that signal relative
delays have a large impact on phase stabilization due
to incoherent timing corrections and collisions
between the timing signals (Moon & Chen, 2018).
Delay optimization can improve phase stabilization
by an order of magnitude, allowing to achieve noise
limited performance.
Figure 3: Phase difference (𝛥𝜙) reconstruction for a 10 g/l homogenous agarose phantom after a transient pulse of 200 μs.
Structural B-scan and 𝛥𝜙 overlay at 2.56 ms (A), 𝛥𝜙 projection over time (B), and 𝛥𝜙 curves at two lateral positions located
closer (d0) and further (d1) from the piezoelectric actuator contact rod (mechanical excitation), positioned approximately
1 mm away from the OCT beam scanning direction (C). Lateral positions are indicated in the overlay images and projections.
Swept-source Phase-Stabilized Optical Coherence Tomography Setup for Elastography
273

ACKNOWLEDGEMENTS
This work was financed by FEDER Funds through
the Operational Program for Competitiveness Factors
- COMPETE and by Portuguese National Funds
through FCT-Foundation for Science and
Technology under the PTDC/EMD-
EMD/32162/2017 project.
REFERENCES
Batista, A., Serranho, P., Santos, M. J., Correia, C.,
Domingues, J. P., Loureiro, C., Cardoso, J., Barbeiro,
S., Morgado, M., & Bernardes, R. (2022). Improving
Displacement Measurements in Phase-resolved Optical
Coherence Elastography. Submitted.
Hyle Park, B., Pierce, M. C., Cense, B., Yun, S.-H., Mujat,
M., Tearney, G. J., Bouma, B. E., de Boer, J. F., Huang,
D., Swanson, E., Lin, C., Schuman, J., Stinson, W.,
Chang, W., Hee, M., Flotte, T., Gregory, K., Puliafito,
C., Fujimoto, J., … Bouma, B. (2005). Real-time fiber-
based multi-functional spectral-domain optical
coherence tomography at 1.3 µm. Optics Express, Vol.
13, Issue 11, Pp. 3931-3944, 13(11), 3931–3944.
https://doi.org/10.1364/OPEX. 13.003931
Kennedy, B. F., Kennedy, K. M., & Sampson, D. D. (2014).
A Review of Optical Coherence Elastography:
Fundamentals, Techniques and Prospects. Ieee Journal
of Selected Topics in Quantum Electronics, 20(2).
isi:000329997200032
Kirby, M. A., Pelivanov, I., Song, S., Ambrozinski, Ł.,
Yoon, S. J., Gao, L., Li, D., Shen, T. T., Wang, R. K.,
& O’Donnell, M. (2017). Optical coherence
elastography in ophthalmology. Journal of Biomedical
Optics, 22(12), 1. https://doi.org/10.1117/1.JBO.22.12.
121720
Lan, G., Singh, M., Larin, K. V., & Twa, M. D. (2017).
Common-path phase-sensitive optical coherence
tomography provides enhanced phase stability and
detection sensitivity for dynamic elastography.
Biomedical Optics Express, 8(11), 5253.
https://doi.org/10.1364/BOE.8.005253
Larin, K. V., & Sampson, D. D. (2017). Optical coherence
elastography – OCT at work in tissue biomechanics
[Invited]. Biomedical Optics Express, 8(2), 1172.
https://doi.org/10.1364/BOE.8.001172
Li, Y., Moon, S., Chen, J. J., Zhu, Z., & Chen, Z. (2020).
Ultrahigh-sensitive optical coherence elastography.
Light: Science & Applications 2020 9:1, 9(1), 1–10.
https://doi.org/10.1038/s41377-020-0297-9
Moon, S., & Chen, Z. (2018). Phase-stability optimization
of swept-source optical coherence tomography.
Biomedical Optics Express, 9(11), 5280.
https://doi.org/10.1364/BOE.9.005280
Vakoc, B. J., Yun, S. H., de Boer, J. F., Tearney, G. J.,
Bouma, B. E., Huang, D., Swanson, E. A., Lin, C. P.,
Schuman, J. S., Stinson, W. G., Chang, W., Hee, M. R.,
Flotte, T., Gregory, K., Puliafito, C. A., Fujimoto, J. G.,
Izatt, J. A., Kulkami, M. D., Yazdanfar, S., … Nelson,
J. S. (2005). Phase-resolved optical frequency domain
imaging. Optics Express, Vol. 13, Issue 14, Pp. 5483-
5493, 13(14), 5483–5493. https://doi.org/10.1364/
OPEX.13.005483
Imaging4OND 2022 - Special Session on New Developments in Imaging for Ocular and Neurodegenerative Disorders
274
