Segmenting Maps by Analyzing Free and Occupied Regions with Voronoi
Diagrams
Alicia Mora, Adri
´
an Prados and Ram
´
on Barber
Robotics Lab, Universidad Carlos III de Madrid, Legan
´
es, Spain
Keywords:
Room Segmentation, Voronoi Diagram, Occupancy Grid Map, Indoor Environments, Mobile Robots.
Abstract:
Traditional mapping techniques rely on metric properties, which represent indoor information with specific
geometric characteristics. This fact highly differs from the way in which people interpret their surroundings.
By geometrically segmenting occupancy grid maps into rooms, robots are brought closer to the way in which
we understand indoor environments. In this work, Voronoi diagrams are proposed as the main tool to locate
map partitions. As a novelty, they are extracted from free and occupied spaces to analyze their shape. This
allows to locate narrow passages on free zones which coincide with protruding parts on occupied zones,
indicating a nearby door. An additional advantage is the use of a varying threshold that depends on the map
structure. This dynamic value can adjust to multiple scenarios, avoiding the use of a fixed threshold that
cannot be generalized. Experiments have been conducted in multiple maps, showing the potential of the
propose method.
1 INTRODUCTION
Indoor environments have been traditionally repre-
sented by occupancy grid maps because of their fa-
cility of being built with techniques such as Simulta-
neous Localization and Mapping (SLAM). A grid is
used to partition the environment and each of its cells
is then classified as either occupied, unoccupied or
unknown. However, this way of representing indoor
locations differs from the way in which we humans
interpret our surroundings. Typical indoor scenarios
are divided into rooms and corridors, to which people
assign a different utility. That is why geometrically
segmenting occupancy grid maps is nowadays a ma-
jor subject of study. Knowing where these regions are
gets robots a step closer to understanding indoor lo-
cations meaningfully. Additionally, partitions can be
used for multiple applications such as extracting topo-
logical maps (Joo et al., 2010), applying coverage al-
gorithms for cleaning robots (Kleiner et al., 2017) or
performing multi-robot tasks (Wurm et al., 2008).
In this work, we propose an offline method based
on the use of Voronoi diagrams as the main tool for
segmenting occupancy grid maps into meaningful re-
gions. The main purpose is segmenting static envi-
ronments for further uses such as topological plan-
ning on robotic applications. Other works have al-
ready proposed these diagrams as a tool for geometri-
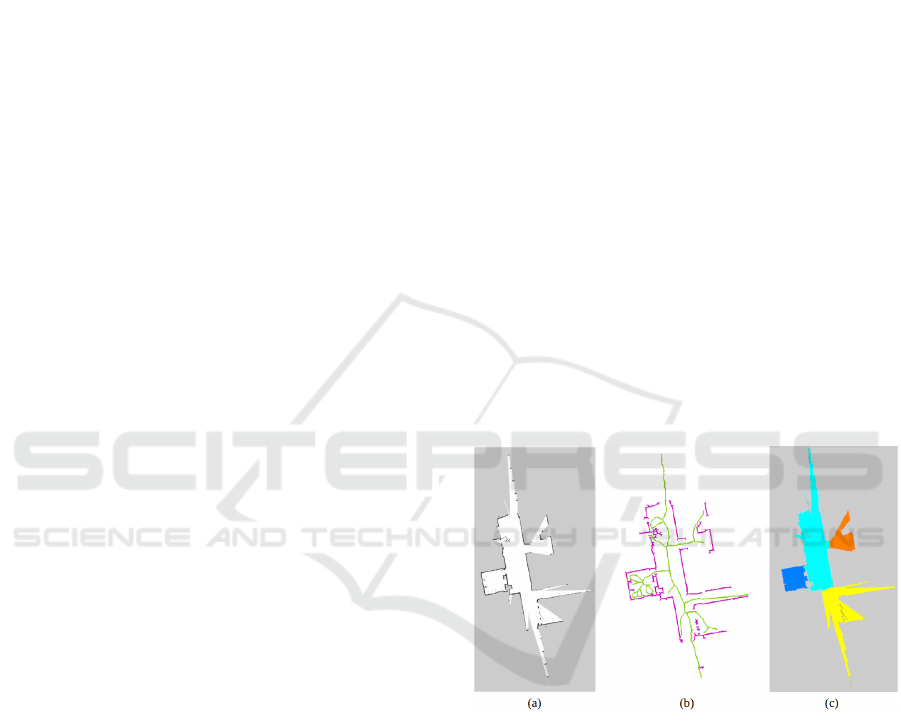
Figure 1: Representative example of the proposed method:
(a) occupancy grid map, (b) Voronoi diagrams extracted
from free regions (green) and occupied regions (ma-
genta), (c) final map segmentation resulting from analyzing
Voronoi diagrams properties.
cally segmenting indoor scenarios. However, they are
only extracted from free space, similarly to the way in
which they are used for path planning. A major draw-
back of these methods is that they typically require
additional procedures such as combining Voronoi di-
agrams with image processing techniques or merging
small regions after segmenting. The main novelty of
the proposed method is using Voronoi diagrams to an-
alyze the structure of both free and occupied zones.
The diagram corresponding to free space allows us
to locate narrow passages, where the occupied space
Mora, A., Prados, A. and Barber, R.
Segmenting Maps by Analyzing Free and Occupied Regions with Voronoi Diagrams.
DOI: 10.5220/0011141600003271
In Proceedings of the 19th International Conference on Informatics in Control, Automation and Robotics (ICINCO 2022), pages 395-402
ISBN: 978-989-758-585-2; ISSN: 2184-2809
Copyright
c
2022 by SCITEPRESS – Science and Technology Publications, Lda. All rights reserved
395

happens to have protruding areas. By locating these
zones, we define a method that does not depend on
other procedures and does not require any merging
steps. Fig. 1 shows a representative example of the
extracted Voronoi graphs from an occupancy grid map
and the resulting map partitions. The use of the terms
Voronoi diagram and Voronoi graph are used inter-
changeably in the rest of the paper.
The rest of the paper is divided as follows. Sec-
tion 2 reviews related work on room segmentation. In
Section 3, the proposed method based on Voronoi di-
agrams is described. Results obtained from applying
this method to multiple occupancy grid maps is shown
in Section 4. Finally, conclusions and future work are
derived in Section 5.
2 RELATED WORK
Many of the works on room segmentation rely on ex-
tracting features from occupancy grid maps. Authors
in (Joo et al., 2010) propose the extraction of corner
features to partition an occupancy grid map. These
features are selected by analyzing curvature and angle
at each individual cell on the grid. Then, doorways
are defined by segments that relate two features with
a length smaller than 1.2 m. Additionally, genetic al-
gorithms are used as a second check to remove un-
necessary segments. Another method is presented in
(Fermin-Leon et al., 2017), where the proposed tool
for segmenting an occupancy grid map is its bound-
aries. Regions between the map’s boundaries and the
convex hull, named pockets, are iteratively partitioned
to calculate their concavity. Those with a value big-
ger than a threshold are selected as division points.
Room partitions are then created by joining them. In
(Liu et al., 2018), free cells on the grid map are clus-
tered into groups marked by randomly selected ini-
tial points according to the distance among them and
proving that no occupied cells are in between. Result-
ing regions are merged by analyzing their connectiv-
ity using Breath-First Search algorithm. It can be no-
ticed that most of these methods rely on heuristically
determined thresholds, which could not be suitable
for every scenario, or they require a second step in
which exceeding divisions are removed or segmented
regions are merged, adding extra computational costs.
Another typically used method is Watershed algo-
rithm. It is based on the way in which rivers drain
basins in nature, where deeper zones are first filled
up until water from different basins touch each other.
Authors in (Fabrizi and Saffiotti, 2000) propose the
application of the Watershed algorithm on fuzzy grid
maps, where each cell value ranges from 0 to 1 indi-
cating the probability of being occupied. This method
is adapted to work online in (Buschka and Saffiotti,
2002). In (Kleiner et al., 2017), the distance trans-
form of a binary occupancy grid map is calculated
before applying the Watershed segmentation proce-
dure. Then, heuristics are applied for room and corri-
dor merging. As it happened with previous methods,
heuristics need to be included in order to merge re-
gions after applying the segmentation procedure. The
main disadvantage of the Watershed algorithm is that
it tends to oversegment regions since it is highly sen-
sitive to local minima. In order to mitigate this fact,
authors in (Ryu, 2020) propose the use of morpho-
logical operations before segmenting. By combining
erosion and dilation, an initial estimation of the num-
ber and location of the different rooms is computed.
Due to these operations, the initial map size is lost, so
regions need to be grown afterwards until they reach
the original map size. This procedure results in a mis-
localization of some doorways, since some regions
grow faster than others.
Voronoi graphs are one of the most applied tech-
niques for room segmentation. In (Thrun, 1998), the
Voronoi graph of free zones is analyzed. Points of
local minima on the graph are selected as critical
points. Then, critical lines which represent doorways
are formed by joining these points to their closest
occupied cells. A similar procedure is presented in
(Beeson et al., 2005), which computes gateway loca-
tions in real time. Voronoi graphs and morphological
operations are combined in (Myung et al., 2009) to
locate door positions. First, the door C-space is cal-
culated by eroding free space by half of doors width.
Then, it is overlapped with the Voronoi graph to locate
doorways. Authors in (Hou et al., 2019) propose the
combination of Voronoi diagrams and alpha-shapes.
Every free cell on the map is assigned to one Voronoi
edge, creating multiple small regions. Alpha shapes
are finally computed on the map to calculate which
areas should be merged. A review of some room
segmentation approaches is presented in (Bormann
et al., 2016), where the Voronoi graph-based method
turned out to be the most stable one, being closer to
the ground-truth segmentation. Voronoi graphs are
proven to be a handy tool for region characterization.
However, they still have the same problem of being
conditioned to determining a fixed threshold, which
does not always work properly on all possible scenar-
ios, deriving into erroneous door location and over-
segmentation.
Other segmentation methods rely on learning
techniques. Authors in (Mozos et al., 2007) propose
the use of the AdaBoost classifier to identify locations
corresponding to corridors, rooms or doorways. Simi-
ICINCO 2022 - 19th International Conference on Informatics in Control, Automation and Robotics
396
larly, in (Goeddel and Olson, 2016) a CNN is applied.
In the work presented in (Friedman et al., 2007), con-
ditional random fields are applied to Voronoi graphs
to label places. Authors in (Hiller et al., 2019) pro-
pose to concatenate two CNNs. Even though these
methods are effective, their design is complex and
computationally expensive since they require training
procedures. This is why we mainly focus this work
review on geometric procedures.
In contrast to the methods described above, our
proposal does not depend on a fixed heuristically de-
termined threshold and does not need any merging
steps. By analyzing properties of Voronoi diagrams
from both free and occupied zones, doorway locations
are estimated.
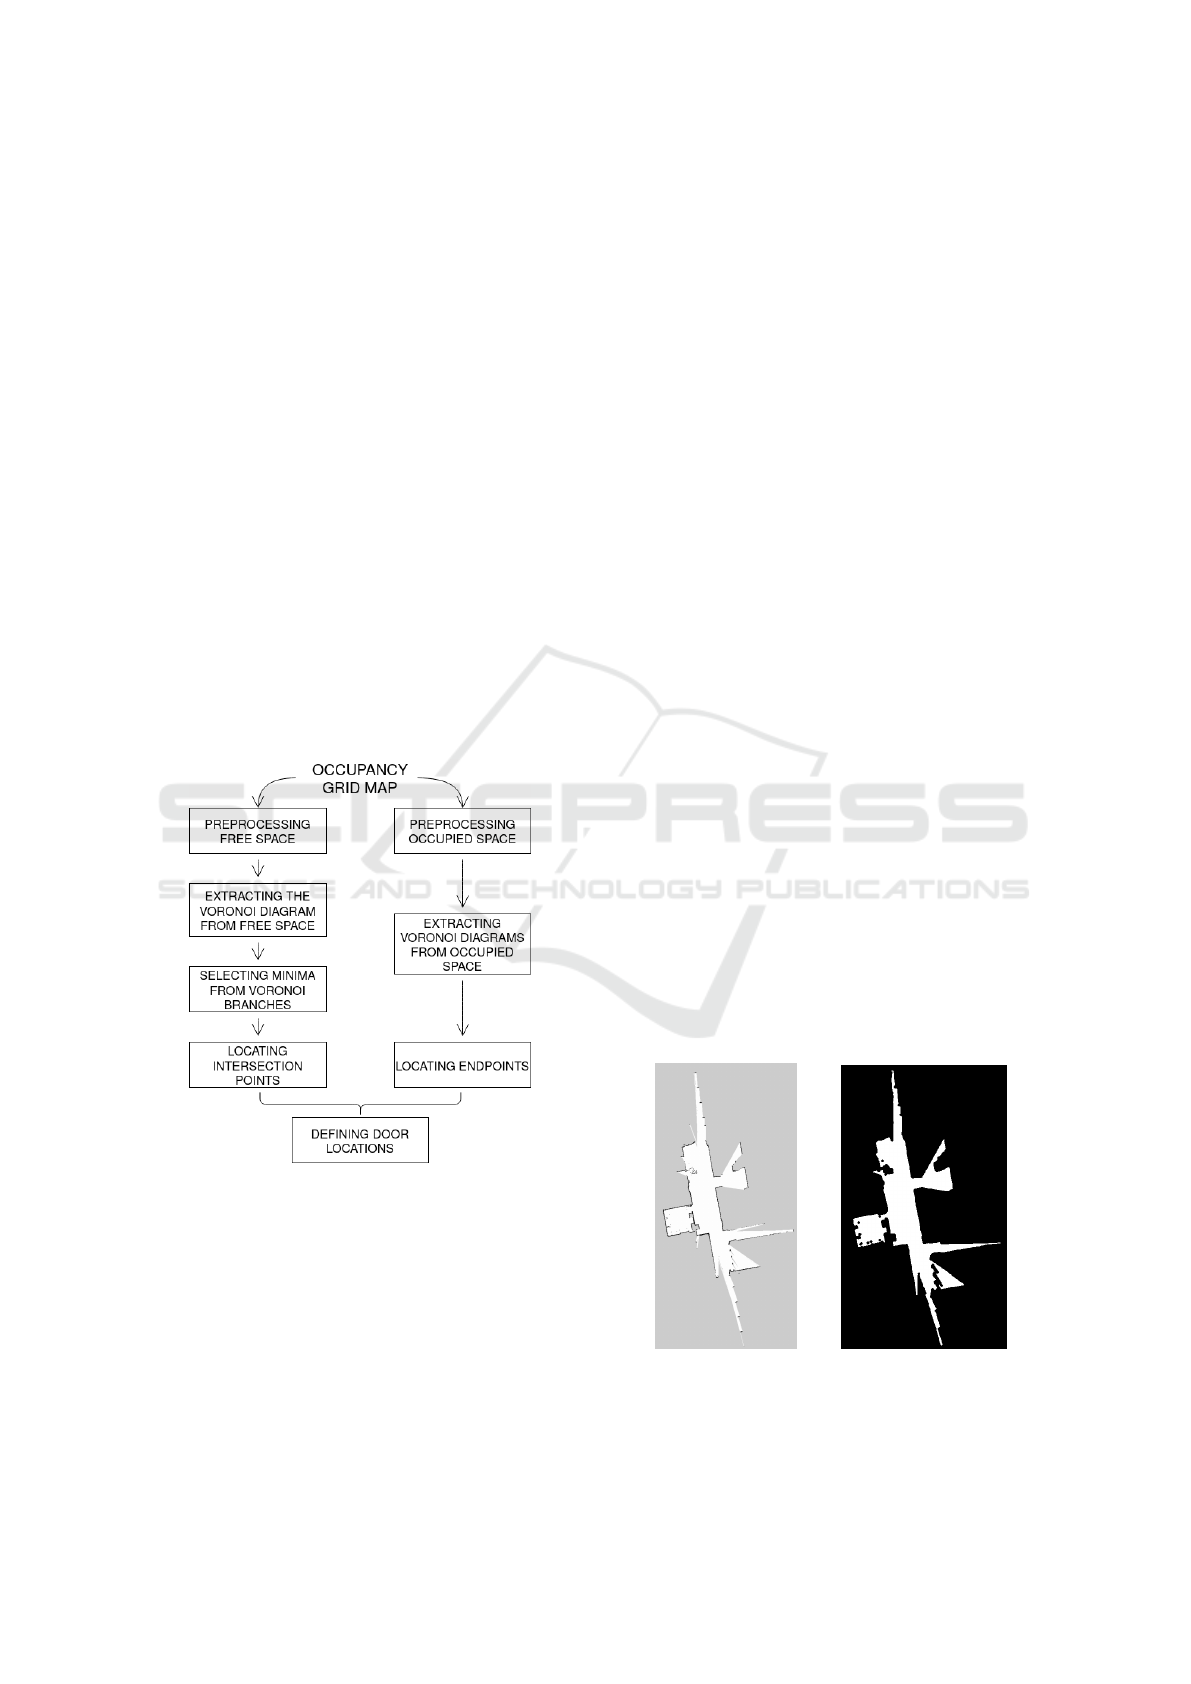
3 MAP SEGMENTATION
The proposed method is based on extracting features
from occupancy grid maps by using Voronoi diagrams
as the main tool. Fig. 2 shows a summary of the pro-
posed steps for segmenting these maps into meaning-
ful regions.
Figure 2: Methodology steps: the left branch corresponds
to free space and the right branch corresponds to occu-
pied space. By analyzing them with Voronoi diagrams, key
points are extracted from both and are used to define door
locations.
It can be seen that there are two main branches
on the procedure, one for analyzing free space and
the other one for occupied space. Finally, both are
merged to define door locations. With respect to free
space, steps are focused on locating narrow passages.
For that reason, points of minimum value with re-
spect to distance are selected on the Voronoi branches.
Then, intersection points are defined by their two
closest occupied cells on the map. With respect to
occupied space, we look for protruding parts, which
can be found by locating endpoints on Voronoi dia-
grams, given that they indicate a change in the struc-
ture of occupied zones. By analyzing the location of
intersection points and endpoints, door locations are
found. In the following subsections, a more detailed
explanation of these steps is provided.
3.1 Analyzing Free Space
One of the main processes of the proposed method
is analyzing free space. More specifically, it is in-
tended to find narrow passages by using Voronoi dia-
grams. For that reason, an auxiliary binary image is
created in which free space of the occupancy grid map
is marked with value 1 and occupied and unknown
spaces are marked with value 0. This image is prepro-
cessed to remove noise, the Voronoi graph is extracted
and points of minimum value with respect to distance
are located on its branches to indicate possible door
locations. Details on how these processes are carried
out are provided below.
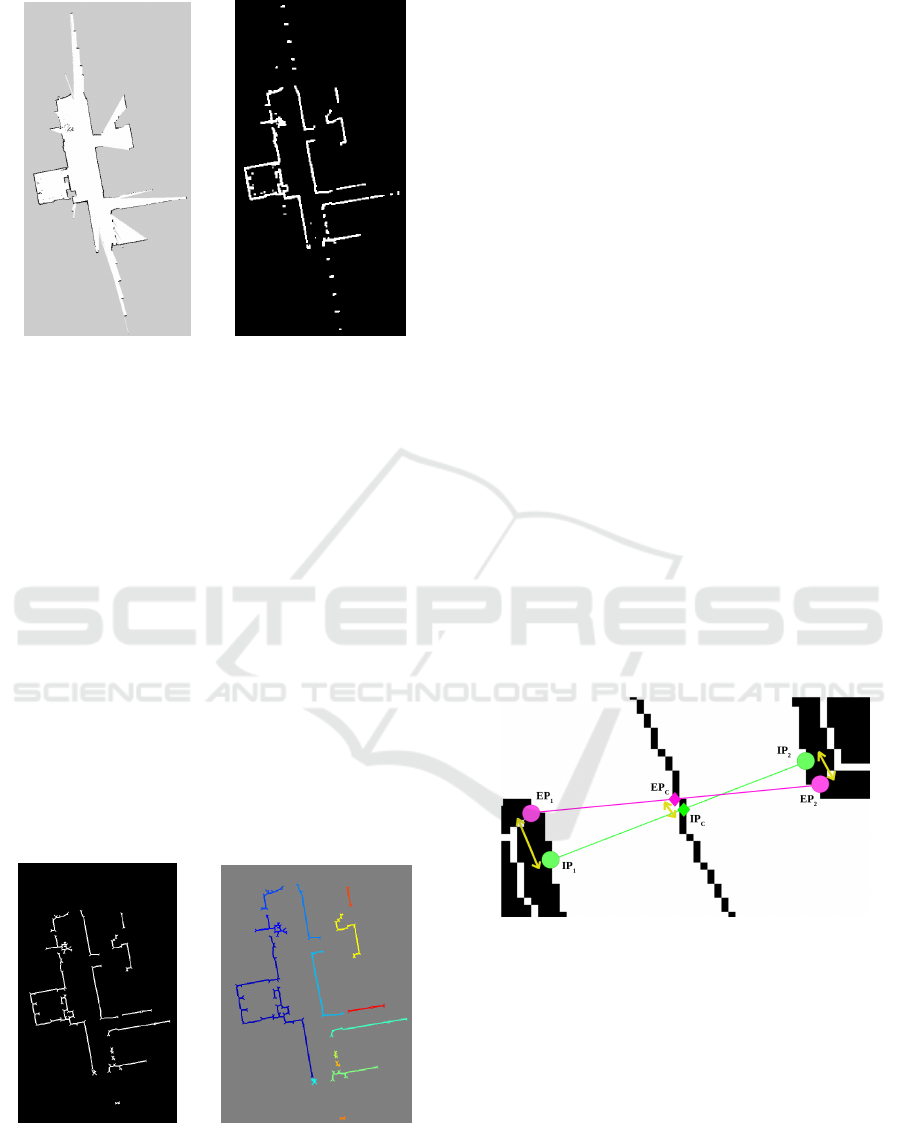
3.1.1 Preprocessing Free Space
Before extracting Voronoi diagrams, it is important to
preprocess the corresponding binary image. This is
because this type of diagrams are highly sensitive to
noise, producing additional branches that do no pro-
vide any relevant information. For that reason, typical
image processing techniques are applied to the map.
First, an erosion process is conducted with a structur-
ing element of rounded shape. Then, a median filter
is applied to round corners (Zuo et al., 2020). A rep-
resentative example of results can be seen in Fig. 3.
(a) (b)
Figure 3: Preprocessing of free space: (a) original occu-
pancy grid map, from which free space is selected, (b) re-
sulting binary image after preprocessing free space.
Segmenting Maps by Analyzing Free and Occupied Regions with Voronoi Diagrams
397
3.1.2 Extracting the Voronoi Diagram from Free
Space
Once the binary image has been correctly prepro-
cessed, the Voronoi diagram is calculated. As an ap-
proximation, the image skeleton is proposed. It can
be represented by the set of points corresponding to
the centers of the maximal disks enclosed in free ar-
eas, touching its boundaries at two or more points
(Saha et al., 2016). Since each disk is tangent to map
boundaries at multiple points, and being the position
of the center equidistant to them, the skeleton repre-
sents paths equidistant to objects. This definition is
similar to the Voronoi diagram, which ensures a graph
as far as possible from obstacles. Morphological op-
erations are used to obtain the skeleton of the im-
age. More specifically, MATLAB’s function bwskel
(MathWorks, 2022) is applied. Fig. 4 shows results of
applying this method to the preprocessed map shown
in Fig. 3. Finally, nodes are removed from the graph,
leaving only its branches separately. Those with less
that 10 pixels are additionally removed. Fig. 4 shows
the resulting labeled branches.
(a) (b)
Figure 4: Extracted Voronoi diagram by using the image
skeleton: (a) resulting image skeleton, (b) labeled branches.
3.1.3 Selecting Minima from Voronoi Branches
Branches extracted on the previous step are used to lo-
cate points corresponding to possible doorways. For
that reason, the distance transform of free space is
used to assign the distance to the closest occupied
cell for each branch point. Then, every branch is
separately analyzed. For each of them, the smallest
value of its points is found and pixels with such value
±2 pixels of margin are selected. This is done to help
the creation of pixel sets, avoiding loose pixels. The
result is a set of line segments corresponding to nar-
row passages on the scenario, which can be seen as
promising door locations. For every segment, cen-
troid and orientation are saved.
3.1.4 Locating Intersection Points
The next step for locating doors is finding intersec-
tion points. They are defined as the closest occupied
points on the binary map to the centroids of the pre-
viously computed line segments in perpendicular di-
rection with respect to their orientation, one on each
sense. By joining the two points corresponding to the
same centroid, a line segment is defined, which cor-
responds to promising door locations. Fig. 5 shows a
representative example, where minimum value points
are marked with green dots and line segments are
drawn by joining each pair of intersection points.
(a) (b)
Figure 5: Promising door locations: (a) Points of minimum
value on the Voronoi graph, (b) derived line segments cor-
responding to promising door locations.
3.2 Analyzing Occupied Space
Another main process of the proposed method is ana-
lyzing occupied regions. It is intended to find protrud-
ing zones by using Voronoi diagrams. The first step
is creating a binary image where occupied zones are
marked with value 1 and free and unknown regions
are marked with value 0. Then, it is preprocessed,
Voronoi diagrams are extracted and endpoints are lo-
cated. A more detailed explanation of these steps is
given below.
3.2.1 Preprocessing Occupied Space
As it happened for free space, it is essential to pre-
process the binary image corresponding to occupied
space before extracting Voronoi diagrams. Image pro-
cessing techniques are again applied. In this case, we
are interested in highlighting protruding areas. For
that reason, rounding corners needs to be avoided. In
contrast to the previous case, the selected structuring
element for applying image processing techniques is a
square with which a dilation process is performed. A
representative example of results can be seen in Fig. 6.
ICINCO 2022 - 19th International Conference on Informatics in Control, Automation and Robotics
398
(a) (b)
Figure 6: Preprocessing of occupied space: (a) original
occupancy grid map, where occupied space is marked in
black, (b) resulting binary image after preprocessing occu-
pied space.
3.2.2 Extracting Voronoi Diagrams from
Occupied Space
Voronoi graphs are extracted from the binary image
corresponding to occupied space in the same way as
explained in Sec. 3.1.2, where skeletons are used
as an approximation. In this case, multiple Voronoi
graphs are obtained, each one corresponding to a dif-
ferent occupied zone, in contrast to free space, where
a single Voronoi diagram was obtained since all free
space is connected. Additionally, those branches with
less than 20 pixels are removed. In this way, small
mapped zones normally corresponding to mapping er-
rors due to sensor noise are removed. Fig. 7 shows
the resulting diagrams obtained from the binary map
shown in Fig. 6 and a labeled image with a different
color assigned for each of the diagrams.
(a) (b)
Figure 7: Extracting Voronoi graphs from occupied space:
(a) resulting Voronoi graphs, each one corresponding to a
different occupied zone, (b) labeled graphs.
3.2.3 Locating Endpoints
Voronoi graphs extracted from occupied zones are a
helpful tool for locating protruding parts, which are
placed near door locations. Every change in the shape
of occupied zones results into a new branch on the
Voronoi graphs. By locating these branches, protrud-
ing parts can be easily defined. In order to do so, end-
points are selected as representative points on Voronoi
graphs. They are defined as pixels with exactly one
pixel neighbor using connectivity 8.
3.3 Defining Door Locations
Door locations are defined as narrow passages in
free space, where protruding parts occur in occupied
zones. Intersection points defined in Sec. 3.1.4 indi-
cate narrow passages found on free space, whereas
endpoints defined in Sec. 3.2.3 define protruding
parts in occupied zones. By relating these two sources
of information, a final estimation of where doors are
can be made. For that reason, the first step is locat-
ing the closest endpoint to each intersection point on
free space. By joining the two resulting endpoints,
another line segment is defined. Fig. 8 shown an ex-
ample of the resulting line segments, where the green
line is defined by joining intersection points IP
1
and
IP
2
(free space information) and the pink line is de-
fined by joining the two closest endpoints EP
1
and
EP
2
, respectively (occupied space information).
Figure 8: Information linkage for defining door locations.
The green segment joins intersection points IP
1
and IP
2
,
obtained from free space, and the pink segment joints end-
points EP
1
and EP
2
, obtained from occupied space. IP
C
and EP
C
are the central points of the segments, respec-
tively. Yellow bidirectional arrows indicate distance be-
tween paired points.
Once information from free and occupied spaces
is related, distances between each intersection point -
endpoint couple as well as distances between the two
central points of each line segment are analyzed (yel-
low arrows from Fig. 8). In order to do so, a threshold
is proposed to compare distances. The main advan-
tage of the proposed threshold is that it varies accord-
Segmenting Maps by Analyzing Free and Occupied Regions with Voronoi Diagrams
399

ing to the map in which the segmentation procedure
is being applied, contrary to the majority of segmen-
tation works in which thresholds are generalized for
all kinds of scenarios. By varying its value according
to the structure of the occupancy grid map, it is bet-
ter adjusted to data that is being processed, so door
locations are better estimated. The proposed thresh-
old value is an estimation of walls thickness. In this
case, the distance transform is applied on occupied
spaces to assign the distance to the closest free cell for
each point on Voronoi graphs obtained from occupied
space. Then, the mean value of these points multi-
plied by two (since skeletons are found in the middle
of occupied zones) is selected, which indicates how
wide occupied zones are. For each grouped data, the
following conditions need to be accomplished in or-
der to be accounted as a door location:
• d
e
(IP
1
, EP
1
) ≤ thres
• d
e
(IP
2
, EP
2
) ≤ thres
• d
e
(IP
1
, EP
1
) ≤
thres
2
where d
e
is the euclidean distance. Additionally, none
of the line segments should intersect with any Voronoi
graph from occupied space. If these conditions are
met, a door location is finally defined by the line seg-
ment joining the two intersection points.
4 EXPERIMENTAL RESULTS
In this section, the proposed method is compared
against other map segmentation procedures. More
specifically, three methods are compared against our
proposal. The first two are morphological operations
and the traditional use of Voronoi diagrams as pre-
sented in (Bormann et al., 2016). The third method is
based on Watershed (Fabrizi and Saffiotti, 2000) ap-
plied on the distance transform of an occupancy grid.
The selected dataset for the experiments is obtained
from (Bormann et al., 2016), where both furnished
and unfurnished scenarios with varying sizes can be
found, as well as ground-truth segmentations. A to-
tal of 18 furnished and 18 unfurnished scenarios are
selected from the complete number of available maps.
Evaluation metrics are also computed according to the
methods proposed in (Bormann et al., 2016): execu-
tion times, precision and recall. As explained in the
original work, precision is high if estimated rooms fit
inside ground-truth rooms, which means that it is an
indicator of undersegmentation. The opposite applies
for recall, which is high when ground-truth rooms fit
inside estimated rooms, being an indicator of overseg-
mentation. Both values need to be high for a good per-
formance of the methods. Moreover, they need to be
balanced in order to ensure a robust operation in dif-
ferent situations. Computations have been performed
on an AMD Ryzen 7 4700u CPU.
Results for execution times, precision and recall
on unfurnished scenarios are provided in Table 1 and
some representative segmented maps are shown in
Fig. 9. Morphological operations turn out to be
the worst method, providing the lowest precision and
recall values. With respect to execution times, tra-
ditional Voronoi graphs need a significantly higher
amount of time to be executed, which produces the
method to be unsuitable for online applications. The
proposed method however significantly reduces com-
putation times by analyzing Voronoi graphs from both
free and occupied spaces. Only Watershed is faster
than the proposed method. Additionally, it has a
higher precision value and only a slightly lower re-
call. For a better comparison of both methods, they
are tested on furnished scenarios.
Metrics for furnished scenarios using Watershed
and the proposed method are collected in Table 2.
Visual results are also provided in Fig. 10, where
it can be clearly seen how our method outperforms
Watershed. Due to to presence of furniture, Water-
shed highly oversegments scenarios, creating multi-
ple rooms where there is a single one. This does not
happen in our method, which is significantly less af-
fected by the presence of clutter. Numerical results
support these observations. Precision and recall on
our method maintain similar results for both furnished
and unfurnished scenarios. However, in the case of
Watershed, recall descends to a 44.1%, which means
that scenarios are highly oversegmented. Precision
and recall turn out to be highly unbalanced, producing
an erratic segmentation performance.
Table 2: Metrics for furnished scenarios.
Watershed Ours
Runtime [s] 0.21 4.72
Precision 91.6 ± 11.4 83.9 ± 16.8
Recall 44.1 ± 9.5 70.2 ± 6.8
Table 1: Metrics for unfurnished scenarios.
Morphological Voronoi Watershed Ours
Runtime [s] 5.55 109.43 0.33 2.06
Precision 75.1% ± 17.7% 83.9% ± 14.1% 94.0% ± 9.4% 89.3% ± 11.9%
Recall 80.3% ± 9.4% 90.5% ± 8.9% 81.1% ± 9.0% 82.1% ± 8.8%
ICINCO 2022 - 19th International Conference on Informatics in Control, Automation and Robotics
400
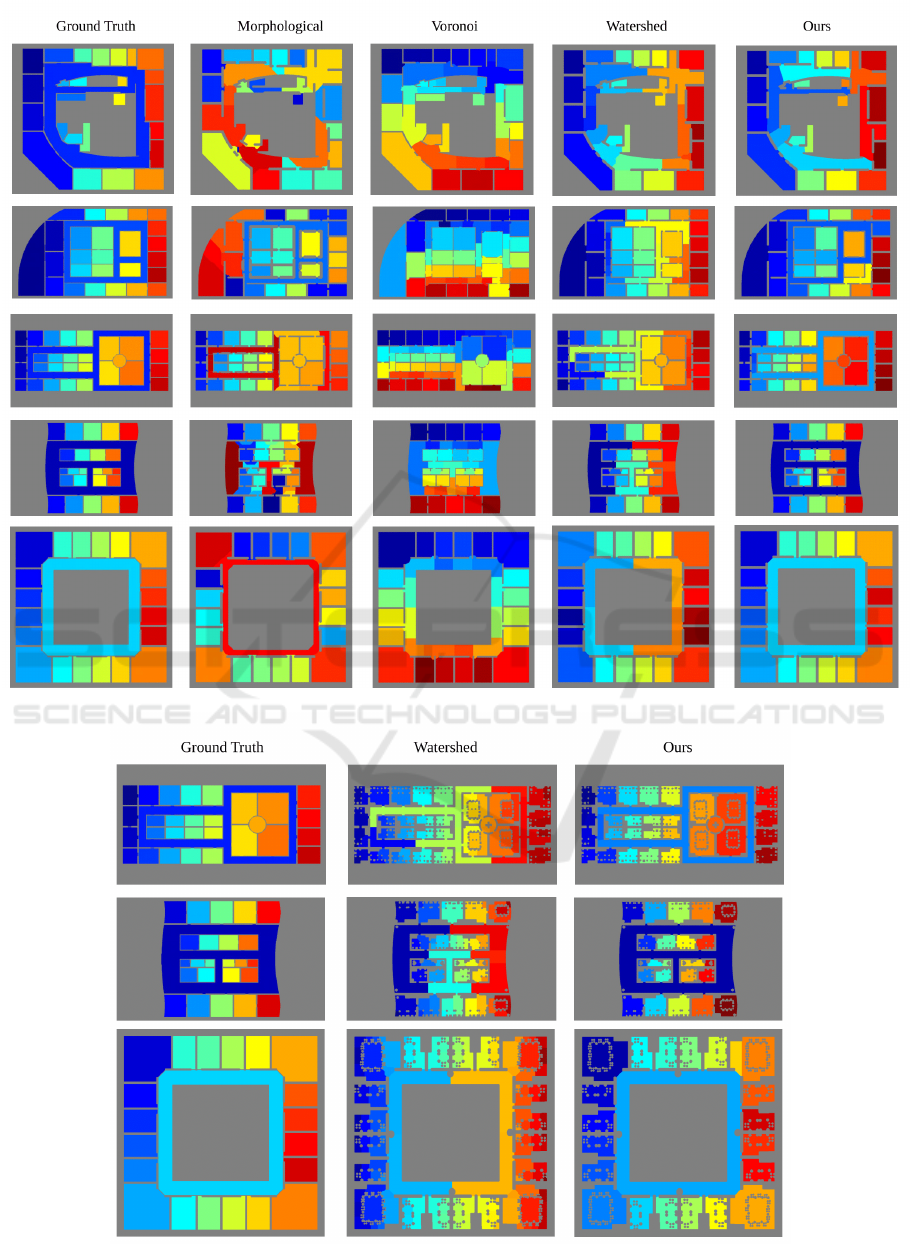
Figure 9: Examples of segmentation results for five unfurnished scenarios from (Bormann et al., 2016).
Figure 10: Examples of segmentation results for three furnished scenarios from (Bormann et al., 2016).
Segmenting Maps by Analyzing Free and Occupied Regions with Voronoi Diagrams
401

5 CONCLUSIONS AND FUTURE
WORK
In this work, Voronoi diagrams have been used as
the main tool for segmenting indoor scenarios into
rooms. By extracting them from both free and occu-
pied spaces, segmentation results have outperformed
state of the art techniques, with high invariability in
furnished environments. With respect to other meth-
ods, no additional steps have been required to unify
areas after segmenting. Additionally, a method has
been proposed to extract a threshold dependent on the
scenario in which it is being applied, adjusting to the
specific needs of each map.
In future work, it is intended to use the proposed
method for locating doors. By knowing where doors
are, the main challenge is modifying robots behaviour
to facilitate door trespassing.
ACKNOWLEDGEMENTS
This work was supported by the funding from HERO-
ITEA: Heterogeneous Intelligent Multi-Robot Team
for Assistance of Elderly People (RTI2018-095599-
B-C21), funded by Spanish Ministerio de Economia
y Competitividad, and the RoboCity2030 DIH-CM
project (S2018/NMT-4331, RoboCity2030 Madrid
Robotics Digital Innovation Hub).
REFERENCES
Beeson, P., Jong, N. K., and Kuipers, B. (2005). Towards
autonomous topological place detection using the ex-
tended voronoi graph. In Proceedings of the 2005
IEEE ICRA, pages 4373–4379. IEEE.
Bormann, R., Jordan, F., Li, W., Hampp, J., and H
¨
agele,
M. (2016). Room segmentation: Survey, implementa-
tion, and analysis. In 2016 IEEE international confer-
ence on robotics and automation (ICRA), pages 1019–
1026. IEEE.
Buschka, P. and Saffiotti, A. (2002). A virtual sensor for
room detection. In IEEE/RSJ international conference
on intelligent robots and systems, volume 1, pages
637–642. IEEE.
Fabrizi, E. and Saffiotti, A. (2000). Extracting topology-
based maps from gridmaps. In Proceedings 2000
ICRA. Millennium Conference. IEEE International
Conference on Robotics and Automation. Symposia
Proceedings (Cat. No. 00CH37065), volume 3, pages
2972–2978. IEEE.
Fermin-Leon, L., Neira, J., and Castellanos, J. A. (2017).
Incremental contour-based topological segmentation
for robot exploration. In 2017 IEEE ICRA, pages
2554–2561. IEEE.
Friedman, S., Pasula, H., and Fox, D. (2007). Voronoi ran-
dom fields: Extracting topological structure of indoor
environments via place labeling. In IJCAI, volume 7,
pages 2109–2114.
Goeddel, R. and Olson, E. (2016). Learning semantic place
labels from occupancy grids using cnns. In 2016
IEEE/RSJ IROS, pages 3999–4004. IEEE.
Hiller, M., Qiu, C., Particke, F., Hofmann, C., and Thi-
elecke, J. (2019). Learning topometric semantic maps
from occupancy grids. In 2019 IEEE/RSJ Interna-
tional Conference on Intelligent Robots and Systems
(IROS), pages 4190–4197. IEEE.
Hou, J., Yuan, Y., and Schwertfeger, S. (2019). Area graph:
Generation of topological maps using the voronoi di-
agram. In 2019 19th International Conference on Ad-
vanced Robotics (ICAR), pages 509–515. IEEE.
Joo, K., Lee, T.-K., Baek, S., and Oh, S.-Y. (2010). Gener-
ating topological map from occupancy grid-map using
virtual door detection. In IEEE Congress on Evolu-
tionary Computation, pages 1–6. IEEE.
Kleiner, A., Baravalle, R., Kolling, A., Pilotti, P., and
Munich, M. (2017). A solution to room-by-room
coverage for autonomous cleaning robots. In 2017
IEEE/RSJ International Conference on Intelligent
Robots and Systems (IROS), pages 5346–5352. IEEE.
Liu, B., Zuo, L., Zhang, C.-H., and Liu, Y. (2018). An
approach to graph-based grid map segmentation for
robot global localization. In 2018 IEEE International
Conference on Mechatronics and Automation (ICMA),
pages 1812–1817. IEEE.
MathWorks (2022). Morphological operations on binary
images - matlab bwmorph.
Mozos, O. M., Triebel, R., Jensfelt, P., Rottmann, A., and
Burgard, W. (2007). Supervised semantic labeling of
places using information extracted from sensor data.
Robotics and Autonomous Systems, 55(5):391–402.
Myung, H., Jeon, H.-m., Jeong, W.-Y., and Bang, S.-W.
(2009). Virtual door-based coverage path planning for
mobile robot. In FIRA RoboWorld Congress, pages
197–207. Springer.
Ryu, H. (2020). Hierarchical path-planning for mobile
robots using a skeletonization-informed rapidly ex-
ploring random tree. Applied Sciences, 10(21):7846.
Saha, P. K., Borgefors, G., and di Baja, G. S. (2016). A
survey on skeletonization algorithms and their appli-
cations. Pattern recognition letters, 76:3–12.
Thrun, S. (1998). Learning metric-topological maps for in-
door mobile robot navigation. Artificial Intelligence,
99(1):21–71.
Wurm, K. M., Stachniss, C., and Burgard, W. (2008). Coor-
dinated multi-robot exploration using a segmentation
of the environment. In 2008 IEEE/RSJ International
Conference on Intelligent Robots and Systems, pages
1160–1165. IEEE.
Zuo, X., Yang, F., Liang, Y., Gang, Z., Su, F., Zhu, H., and
Li, L. (2020). An improved autonomous exploration
framework for indoor mobile robotics using reduced
approximated generalized voronoi graphs. ISPRS An-
nals of the Photogrammetry, Remote Sensing and Spa-
tial Information Sciences, 1:351–359.
ICINCO 2022 - 19th International Conference on Informatics in Control, Automation and Robotics
402
