
Investigation of Microbial Diversity in Sludge Treatment Reed Bed
Junwen Ma
1,2 a
, Yubo Cui
1,3,* b
, Chengdong Ma
4c
, Wanjun Zhang
3d
, Zhongwei Zhang
3e
and Ke Zhao
5f
1
Key Laboratory of Biotechnology and Bioresources Utilization, Ministry of Education, Dalian Minzu University, Dalian
116600, China
2
School of Environment Science & Technology, Dalian University of Technology, Dalian, 116024, China
3
College of Environment and Resources, Dalian Minzu University, Dalian, 116600, China
4
Department of Marine Ecological Environment Information, National Marine Environmental Monitoring Center, Dalian,
116023, China
5
Key Laboratory of Songliao Aquatic Environment, Ministry of Education, Jilin Jianzhu University, Changchun, 130118,
China
Keywords: Sludge Treatment Reed Beds, Microbial Diversity.
Abstract: This paper fully characterized the diversity of the bacterial flora in sludge treatment reed beds (STRBs) by
sampling samples from the STRBs in stages and overall studying the changes in the bacterial flora in the
natural stabilization period, with sludge samples as the main focus, divided into bottom and surface sludge
discussions, and combined with reed samples and natural substrate samples to give auxiliary analysis. We
found that species changes of the dominant bacterial community in sludge mainly changed with different
periods of ecological stabilization, and the diversity as well as the homogeneity of the bacterial community
was increasing after the stabilization period, indicating that the root activity in plant growth can influence
the activity of nearby bacterial communities.
1 INTRODUCTION
1
At present, China's sewage treatment process is
becoming more and more mature, but the amount of
residual sludge generated by the sewage treatment
process is huge, so the disposal of residual sludge
should not be underestimated
(Wu, et al., 2000).
Specifically, the amount of residual sludge produced
today is up to more than 35 million tons, and its
water content is all around 80%. The main treatment
measures for residual sludge are composting,
incineration, landfill, drying and digestion, but still
80% of the sludge cannot be properly treated.
Therefore, the secondary pollution problem is still
prominent. Secondary pollution problems mainly
exist in terms of high sludge treatment costs, poor
a
https://orcid.org/0000-0001-5716-9446
b
https://orcid.org/0000-0001-8950-5889
c
https://orcid.org/0000-0002-2933-1220
d
https://orcid.org/0000-0002-3342-3734
e
https://orcid.org/0000-0001-5413-554X
f
https://orcid.org/0000-0002-7481-0503
product marketing and the existence of pollution
transfer (Cui, et al., 2018). From a technical and
economic point of view, incineration and
composting for agricultural use are reliable
technologies for the treatment and disposal of huge
amounts of sludge, but the high investment and
operating costs hinder the widespread application of
incineration technology, and the high cost of
composting technology also requires consideration
of agricultural safety issues, which are the
challenges that must be faced in promoting the
technology. Therefore, sludge treatment or
stabilization requires consideration not only of
internal factors of operating technology, but also of
external factors such as economic costs and
environmental operation. The sludge treatment reed
bed (STRB) is a combination of traditional sludge
drying beds and artificial wetland technology, which
not only effectively dewater the remaining sludge,
but also additionally produce a mineralized
substance that can be used as a land improvement
and agricultural fertilizer
(Uggetti, et al., 2010,
Nielsen, et al., 2016, Hardej, et al., 2002). The
Ma, J., Cui, Y., Ma, C., Zhang, W., Zhang, Z. and Zhao, K.
Investigation of Microbial Diversity in Sludge Treatment Reed Bed.
DOI: 10.5220/0011180300003443
In Proceedings of the 4th International Conference on Biomedical Engineering and Bioinformatics (ICBEB 2022), pages 59-63
ISBN: 978-989-758-595-1
Copyright
c
2022 by SCITEPRESS – Science and Technology Publications, Lda. All rights reserved
59

diversity of sludge flora in STRBs is important for
evaluating the effectiveness of STRBs in treating
residual sludge. Previously, there is still a gap in the
research on the diversity of bacterial flora in STRBs
during the stabilization period. With the continuous
advancement of technological innovations in
molecular biology, the use of denaturing gradient gel
electrophoresis (DGGE) to study microbial changes
in microecological environments has been widely
used, but a complete cycle study of microbial flora
diversity during the ecological stabilization of
residual sludge has not been carried out.
In conclusion, it is necessary and urgent to
investigate the changes of microbial flora in STRBs
during the stabilization period using DGGE.
2 MATERIALS AND METHODS
2.1 Sampling
The STRB system is divided equally into three units,
all of which are 3.0 m x 1.0 m x 1.3 m. Unit 1 is a
conventional STRB with an aeration structure (two
aeration risers); Unit 2 is a STRB with an aeration
structure (two aeration risers) and reeds are grown;
Unit 3 is a normal STRB with only reeds but no
aeration structure. The time period selected for the
study was eight months, from April to November in
the resting period, according to seasonal variations.
The reed bed is mainly composed of packing
layer and mud storage layer. The packing layer is
filled with 20 cm of slag, 20 cm of gravel, and 25
cm of British sand filter material in sequence from
bottom to top, of which 5 cm of coarse sand and the
rest are fine sand; the mud storage layer is set to 65
cm, In order to provide enough space for sludge
accumulation in the later stage. Aeration risers are
installed along 1/3 and 2/3 of the length of the drain
pipe and extend to the space above the mud storage.
2.2 Methods
In this experiment, DGGE was performed using Bio-
Rad's denaturing gradient gel system, and the basic
operating conditions for this experiment were
determined after repeated adjustments and tests. The
concentration of polyacrylamide gel denaturant used
in this study was 8%, and the gradient of denaturing
gel was 30-60% in 1× TAE buffer, and
electrophoresis was carried out at 18 mA for 18-20 h.
3 RESULTS AND DISCUSSION
3.1 Cluster Analysis and Diversity
Index of Bacteria
3.1.1 Analysis of May and November
Samples from Strbs
According to the results of cluster analysis, Figure 1
shows that lane 4 (5-2S) and lane 5 (5-3B) have the
lowest similarity with the rest of the samples,
indicating that the dominant bacteria in the bottom
sludge of unit 2, which is planted with reeds and
aerated, and the surface sludge of unit 3, which is
planted with reeds and not aerated, have similarity
and belong to two groups with the rest of the
samples during the budding stage of reed growth in
the natural stabilization period. In the natural
stabilization period of STRBs, the surface sludge
and bottom sludge of each unit did not belong to the
same taxon in the same sampling period. This can
also be seen by the greater differentiation between
11# (11-3B) and 12# (11-3S). In one unit, the
similarity between 1# (5-1B), 2# (5-1S), 7# (11-1B),
and 8# (11-1S) was not high. According to the
related study from the germination stage of reed, soil
respiration rate increased with the increase of
temperature, and soil temperature and near surface
temperature reached the highest value in July-
August, and soil respiration rate peaked
correspondingly in the vigorous growth period; after
entering the wilting stage, soil respiration in both
reed wetlands gradually decreased with the decrease
of soil temperature and near surface temperature,
due to the The lowest value of soil respiration rate
was reached in the overwintering period due to the
limitation of low temperature. Unit I, as a STRB, the
role of flora was mainly related to soil respiration
rate, indicating that the dominant flora of each
sample in Unit I were not in the same range. In unit
II, the dominant bacterial groups between 3# (5-1B)
and 10# (11-1S) belonged to the same taxon,
indicating that the sludge potential bacterial groups
in unit II planted with reeds did not change much
and had some stability.
ICBEB 2022 - The International Conference on Biomedical Engineering and Bioinformatics
60
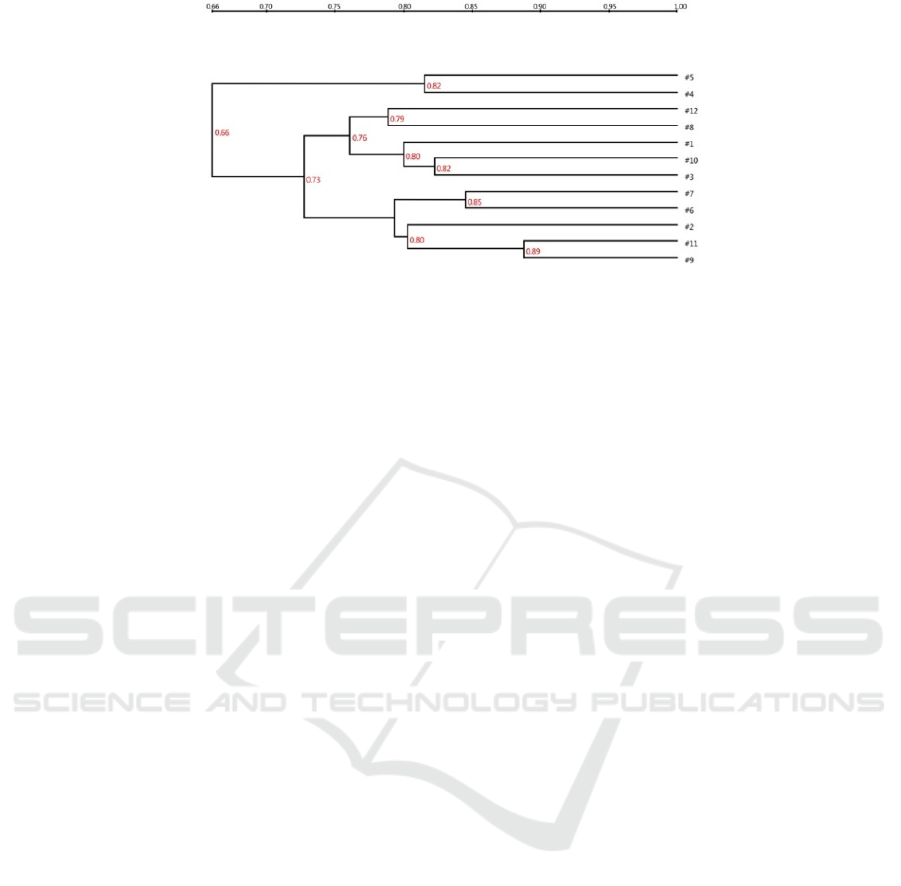
Figure 1: The dendrogram of the DGGE fingerprint of the V4-V5 gene of 16S rDNA of the bacteria from twelve sample. 1-
6: The samples in May; 7-12: The samples in November
The diversity values of the same sludge sample
in May and November were compared
longitudinally, and it was found that the difference
between the two units in the bottom sludge sample
was the smallest, and the H value increased from
1.44 (3#5-2D) to 1.61 (9#11 -2D); bed number 3
rose from 1.27 (5#5-3D) to 1.86 (11#11-3D), with
the largest fluctuation; while unit 1 dropped
significantly from 1.93 (1#5-1D) to 1.41 ( 7#11-1D),
in the process of research and application, the
diversity index represents the degree of species
diversity of each sample bacteria, and is a
comprehensive index of richness and uniformity.
Mud was closest to the degree of species diversity at
the beginning and end of the study cycle. The
surface sludge was analyzed, and it was found that
the fluctuation between the first unit and the third
unit was not large, and the second unit had a certain
fluctuation relatively. The H value increased from
1.40 (4#5-2B) to 1.72 (10#11-2D), The results
showed that in the comparison of the surface sludge
diversity index, the two units had the largest
difference in species diversity at the beginning and
end of the study period. It can be seen from Figure
3.6 that the fluctuation of the evenness index EH
value also characterizes the above trend. There is
little difference in the richness of the sample
colonies, the highest is 13 (11#11-3D), and the
lowest is 9 (5#5-3D).
On the whole, the diversity index in May and
November did not fluctuate much, and the sludge
had a certain degree of stability.
3.1.2 Analysis of July and September
samples from STRBs
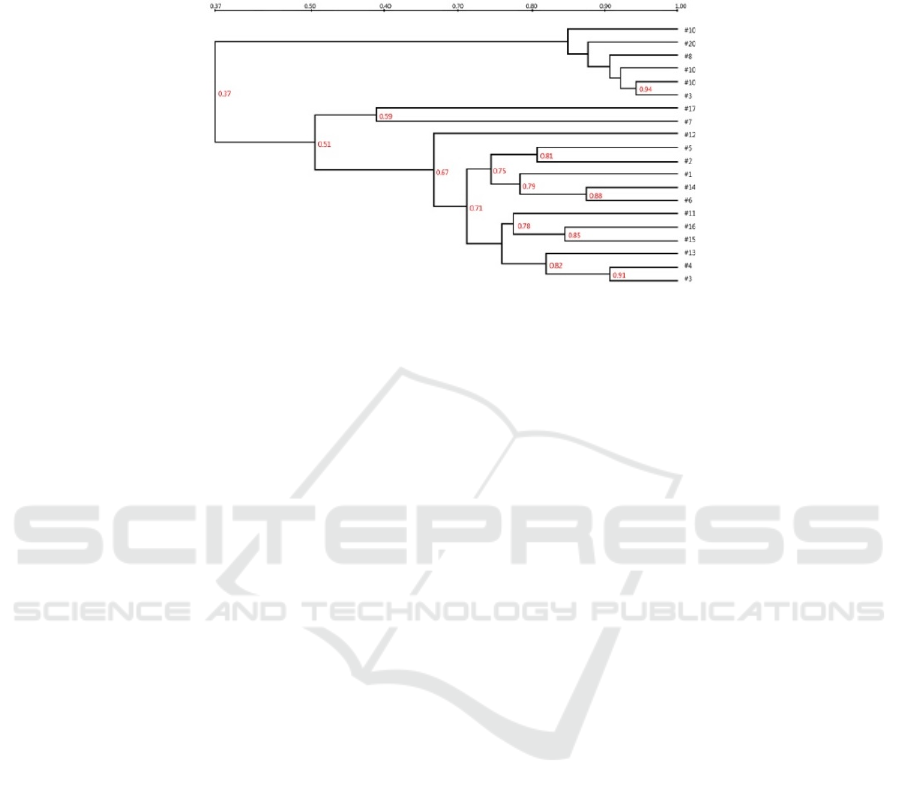
According to the results of cluster analysis, Figure 2
shows that the reed samples (8#, 9#, 10#, 18#, 19#,
20#) and the sludge samples (from 1# to 7# and
from 11# to 17#) are clearly divided into two major
clusters with a similarity of 0.37. Comparing the
reed samples, it can be seen that the similarity
between the 9# (7-L2) and 10# (7-L3) samples is as
high as 0.94, indicating that these two samples of
reeds showed great consistency in July because they
were both growing in the sludge. In contrast, the
comparison of 19# (9-L2) and 20# (9-L3) revealed
that the reeds began to show some variability in
growth in September. the similarity between the reed
samples in July (8#, 9#, 10#) and September (18#,
19#, 20#) was arranged apart, indicating that the
reed endophytes' changed in July and September.
There are some obvious fluctuation patterns in
the sludge samples, within one unit, the samples 1#
(7-1B) and 2# (7-1S) in July do not belong to one
taxon and the similarity value between the two taxa
is 0.75, and the corresponding samples 11# (9-1B)
and 12# (7-1S) in September also do not belong to
one taxon and the similarity value becomes smaller
to 0.67, indicating that in the sludge with only
contemporaneous structure The difference in the
sludge surface and bottom layers of the sludge in the
dryer bed and the fluctuation of the dominant
bacterial group. A cross-sectional comparison of the
samples from the three units shows that the sludge
samples 5# (7-3B) and 6# (7-3S) from July were not
matched to the same taxon, but the samples 15# (9-
3B) and 16# (9-3S) from September had high
similarity values (0.85) and belonged to the same
taxon; a longitudinal comparison revealed that 5# (7-
3B) and 15# (9-3S) belonged to two taxa (0.71) and
6# (7-3B) and 16# (9-3S), indicating that the three
units (reedbeds without aeration structures) changed
significantly after the growth period. Among the
three units, the lanes of 3# (7-2B), 4# (7-2S) and 13#
(9-2B) were sequentially adjacent to each other in
the analysis chart with high similarity; 14# (9-2S)
represented a sludge sample at the peak of reed
Investigation of Microbial Diversity in Sludge Treatment Reed Bed
61
growth with some variability from the above
samples (similarity value 0.71). The natural
substrate samples 7# and 17# belong to one taxon,
but the similarity is low (0.59), indicating that the
natural substrate samples also changed in July and
September.
Figure 2: The dendrogram of the DGGE fingerprint of the V4-V5 gene of 16S rDNA of the bacteria from twenty sample.
1-10: The samples in July; 11-20: The samples in September.
Compared with the diversity index in July and
September, it was found that the fluctuation of the
diversity index of the sludge sample was
significantly larger than that of the reed sample, and
the diversity index of the natural sediment sample
was closer to the reed sample, which was relatively
stable. The diversity index of the reed samples was
similar in two months. Compared with the
uniformity index, it was found that the reed samples
in the second unit had the most stable changes
before and after (9#, 19#).
In the control of sludge samples, the one-unit
bottom sludge diversity index without reed plants
fluctuated the least, and the H value changed from
1.40 (1#7-1D) to 1.44 (11#9-1D). The bottom sludge
diversity index of the three units planted with reeds
fluctuated the most, and the H value changed from
2.03 (5#7-3D) to 1.20 (15#9-3D). In the comparison
of the surface sludge, the diversity index of pool 1
dropped significantly, and the diversity index of
pool 2 fluctuated less. In general, the diversity index
of samples in September was lower than that of
samples in July.
The trend graph of the evenness index EH value
also characterizes the above trend. There is a certain
difference in the abundance of sludge sample
colonies, the highest is 14 (5#7-3D), the lowest is 6
(16#9-3B), and the richness of natural sediment is 5
(7#7-T and 17#9-T); the richness of the reed
samples differed little, both in July and in
September.
3.2 Bacterial Species and Affinity
Analysis
3.2.1 Species and Affinity Analysis of May
and November Samples
The research showed that it can be concluded that
each band represents Bacteria (bacteria), bands 2, 5
and 6 do not specify the specific dominant bacterial
genus, and after comparison, it is known to belong to
the environmental sample species.
Band 8 belongs to Bacteroidetes (Bacteroidetes),
which is widely found in nature, including soil,
sediment and seawater, as well as animal skin and
viscera, and according to the results, this species is
the dominant species in the samples of each unit in
May, while the dominant characteristics in the
samples of November are concentrated in the bottom
sludge.
The rest of the bands in the map represent the
dominant genus of bacteria belong to Proteobacteria
(Phylum Amoebae), bands 3, 4, 7, 11, 12, 13 and 14
are from Gammaproteobacteria (γ-Amoebacteria),
bands 4, 13 and 14 are bacteria Rhodanobacter, band
3 is bacteria Dyella, bands 8 and 12 are only
compared to Xanthomonadaceae (Order
Xanthomonadaceae).
Bands 9 and 10 both belong to
Betaproteobacteria (β-Amastigotes), band 9
represents Burkholderiales (Burkholderiales) -
Comamonadaceae (Trichomonadaceae) -
Simplicispira; band 10 represents Hydrogenophilales
(Hydrogenophilales) - Hydrogenophilaceae
(Hydrogenophilaceae) - Thiobacillus (Thiobacillus
ICBEB 2022 - The International Conference on Biomedical Engineering and Bioinformatics
62

spp.), a dominant bacterium that grows mainly in
environments with pH values between 3 and 4 and
produces sulfuric acid to improve fertilization
efficiency.
3.2.2 Species and Affinity Analysis of July
and September Samples
The comparison results showed that band 4 was
Uncultured Acidobacteriales, which belongs to
Acidobacteria, a newly discovered bacterium and
less studied.
Band 6 was Uncultured Sphingobacteria, i.e.
Sphingobacteria (Phylum Sphingobacteria), which
are more frequent in the dominant group analysis
and have been shown to remove ammonia nitrogen
from water. This band only appeared in the sludge
samples of the second unit in July and in the bottom
sludge of the first unit in the same period, indicating
that the sludge of the second unit in July had a
certain bacterial richness.
Band 7 is Uncultured Bacteroidetes, which is
Bacteroidetes (phylum Bacteroidetes), a specialized
anaerobic bacterium that generally exists widely in
manure wastewater and thickened sludge. The
presence of this band in lanes 2# (7-1S) and 5# (7-
3B) indicates that the sludge in units 1 and 3 showed
an anaerobic environment in July, and presumably
the sludge in unit 2 had a higher oxygen content.
Band 10 was Gloeobacter, which showed
predominance in all samples. It is a Cyanobacteria
(phylum Cyanobacteria), a group of bacteria that
produces oxygen. It belongs to Gloeobacter (genus
Gloeobacter) in the Gloeobacteraceae (family
Mucoraceae).
Band 16 is Uncultured Alcanivorax, also
belonging to Gammaproteobacteria (γ-Amastigotes)
in Proteobacteria (Phylum Proteobacteria), but
Alcanivorax (Alcanivorax spp.) in Oceanospirillales
(Order Oceanospirillales). The profile showed the
occurrence of this class of bacteria in the second unit
of sludge as well as in natural sludge in July.
4 CONCLUSIONS
In this paper, we found significant differences in the
DGGE profiles of bacterial populations in different
periods and sampling locations by sampling samples
in STRBs. The changes in the dominant bacterial
species in sludge mainly changed with different
periods of ecological stabilization, and the diversity
as well as the homogeneity of the dominant bacterial
flora generally increased after the stabilization
period of action, indicating that the root activity in
plant growth can stimulate the activity of nearby
bacterial flora to some extent.
Sequence comparison revealed that during the
stabilization period of STRBs, the dominant bacteria
were Bacteroidetes and Proteobacteria at lower
temperatures, and Thiobacillus (Thiobacillus spp.),
which can produce sulfuric acid to improve
fertilization efficiency, was always present. The
dominant species were widely distributed at higher
temperatures, including Proteobacteria (Phylum
Anamorphobacteria), Acidobacteria (Phylum
Acidobacteria), Sphingobacteria (Phylum
Sphingobacteria), Bacteroidetes (Phylum
Anamorphobacteria), and Cyanobacteria (Phylum
Cyanobacteria). Among them, Acidobacteriales
(Acidobacteria), which is abundant in soil, appeared
in all samples of sludge and natural substrate.
Gloeobacter which can produce oxygen was shown
in all samples at high temperature. The specialized
anaerobic bacteria, Bacteroidetes (phylum
Sphingobacter), was not shown in the rest of the
samples, except in the samples of 1S and 3B in May
and July.
ACKNOWLEDGEMENTS
The research was financed by the Natural Science
Foundation of Liaoning, China (2020-MZLH-02)
and Science and Technology Innovation Foundation
of Dalian, China (2018J12SN080).
REFERENCES
Cui, Y. B., Wu, X. H., Liu, Z. S., Liu, J.Z., Lin, Y.Z.
(2018). Ecological stabilization of thickened
wastewater sludge from CAST process. Water Sci.
Technol. 58, 1911-1916.
Hardej, M & Ozimek, T. (2002). The effect of sewage
sludge flooding on growth and morphometric
parameters of Phragmites australis (Cav.). Trin. Ex
Steudel. Ecol. Eng. 18, 343–350.
Nielsen, S & Larsen, J. (2016). Operational strategy,
economic and environmental performance of sludge
treatment reed bed systems - based on 28 years of
experience. Water Sci. Technol. 74 (8), 1793-1799.
Uggetti, E., Ferrer, I., Llorens, E., García, J. (2010).
Sludge treatment wetlands: a review on the state of the
art. Bioresour. Technol. 101, 2905-2912.
Wu, L., Ma, L. Q., Maetinez, G. A. (2000). Comparison of
methods for evaluating stability and maturity of
biosolids compost. J. Environ. Qual. 29, 424-429.
Investigation of Microbial Diversity in Sludge Treatment Reed Bed
63
