
Measurement and Coupling Coordination Analysis of Scientific and
Technological Innovation and Common Prosperity
Binrui Song
*
, Jie Xu, Tengjiao Yang and Lin Luo
College of Statistics and Mathematics, Zhejiang Gongshang University, Hangzhou, Zhejiang Province, 310018, China
Keywords: Scientific and Technological Innovation, Common Prosperity, Level Measurement, Coupling Coordination
Degree Model, Obstacle Degree Model.
Abstract: This paper measures China's scientific and technological innovation level and common prosperity level
through the “vertical and horizontal method”, analyzes the coupling and coordination relationship between
scientific and technological innovation and common prosperity in different provinces by using the coupling
coordination degree model and obstacle degree model, identifies its time evolution law and spatial distribution
characteristics, and diagnoses its key obstacle factors. The results showed that: First, the level of scientific
and technological innovation and common prosperity of 30 provinces in Chinese mainland(except Tibet)
showed an upward trend in 2000~2019.Second, the level of coupling and coordination between scientific and
technological innovation and common prosperity has gradually improved, but the specific conditions of
different provinces are significantly different; Third, the main obstacles to scientific and technological
innovation during the investigation period are the proportion of added value of high-tech industry, sales
revenue of new products and R&D investment intensity; The main obstacles to common prosperity include
per capita expenditure on basic public services, per capita education funds, per capita GDP, per capita number
of beds in medical institutions, participation rate of basic old-age insurance for urban and rural residents, and
ownership of public transport vehicles per 10000 people.
1 INTRODUCTION
The idea of common prosperity goes back a long way.
Marx and Engels founded the scientific socialism and
transformed common prosperity from a utopian
concept into science. As the essential requirement of
socialism with Chinese characteristics, common
prosperity stands for both the goal and the final result
(Fan, Xie 2018). Since the proposal of common
prosperity was put forward in 1953, China's
economic aggregate has doubled a hundred times,
and breakthroughs have been made in the three key
battles of poverty alleviation. The general idea of
common prosperity was put forward at the 10th
meeting of the central financial and Economic
Commission in August 2021. Since then, the topic of
common prosperity has attracted more attention and
wider discussion in the society. To accelerate the
construction of common prosperity, we must follow
the economic development policy guided by
scientific and technological innovation. Throughout
the existing literature, most of them only measure
China's existing scientific and technological
innovation level or common prosperity level, and
there is little research on the relationship between
scientific and technological innovation and common
prosperity. This paper constructs the coupling
coordination evaluation index system of scientific
and technological innovation and
common prosperity,
measures the level of scientific and technological
innovation from two aspects of innovation input and
innovation output, and measures the level of common
prosperity from two aspects of overall prosperity and
achievement sharing. The coupling coordination
degree model and obstacle degree model are adopted,
Taking 30 provinces in China (except Tibet) as the
research object, this paper carries out the research on
the coupling and coordination relationship between
provincial scientific and technological innovation and
common prosperity, so as to seek the characteristics
and laws of their coordinated development, and
provide ideas and reference for China to achieve
common prosperity and other countries to improve
the living standards of the whole people.
400
Song, B., Xu, J., Yang, T. and Luo, L.
Measurement and Coupling Coordination Analysis of Scientific and Technological Innovation and Common Prosperity.
DOI: 10.5220/0011181900003440
In Proceedings of the International Conference on Big Data Economy and Digital Management (BDEDM 2022), pages 400-406
ISBN: 978-989-758-593-7
Copyright
c
2022 by SCITEPRESS – Science and Technology Publications, Lda. All rights reserved
2 MATERIALS AND METHODS
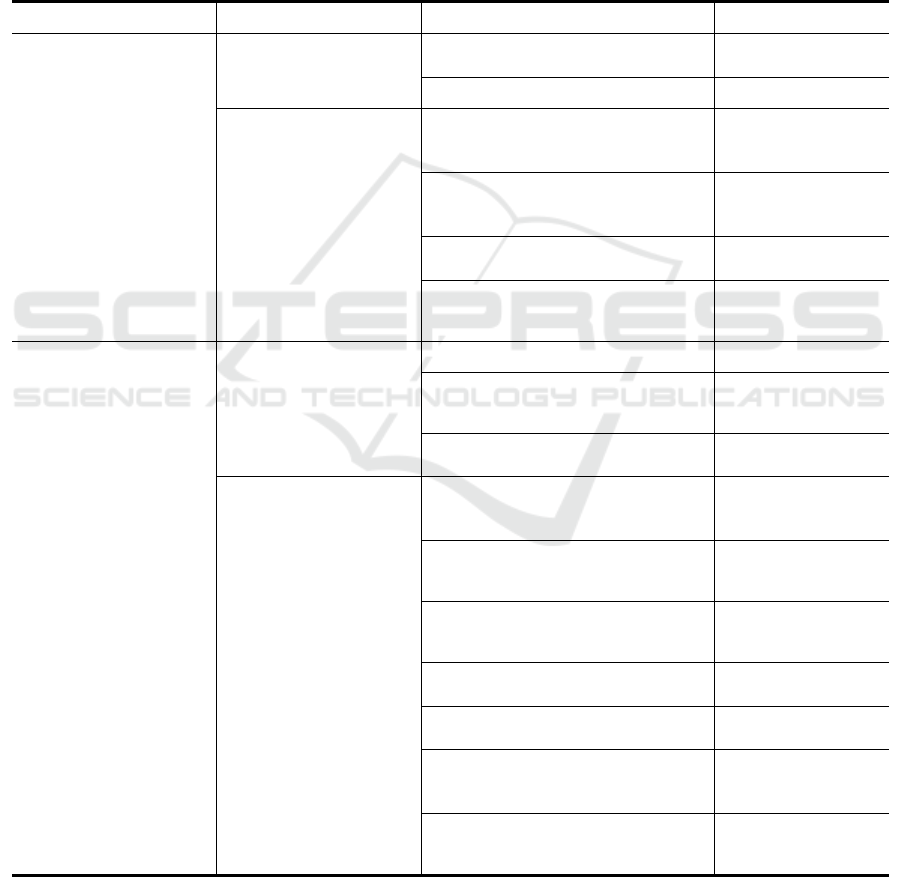
2.1 Index System
Based on the interaction between scientific and
technological innovation and common prosperity,
drawing on the existing measurement indicators of
scientific and technological innovation and common
prosperity(Liu, et al, 2021,Hu, Zhou, 2022), and
according to the principles of scientificity,
comprehensiveness and operability, this paper
establishes an evaluation index system for the
coupling and coordination of scientific and
technological innovation and common prosperity, as
shown in Table 1.Among them, the former includes
two primary indicators of innovation input and
innovation output and six corresponding secondary
indicators; The latter includes two primary indicators:
overall wealth and achievement sharing, as well as 10
corresponding secondary indicators.
Table 1: Evaluation index system of coupling and coordination between scientific and technological innovation and common
prosperity.
The first laye
r
The second laye
r
Attribute
Scientific and technological
innovation
Innovation input
R&D expenditure intensity Positive
R&D personnel per 10000 people Positive
Innovation output
Number of invention patents authorized
per 10000 people
Positive
Number of scientific and technological
papers per 10000 R&D personnel
Positive
Proportion of new product sales revenue Positive
Proportion of added value of high-tech
industry
Positive
Common prosperity
Overall affluence
Per capita GDP Positive
Total retail sales of social consumer goods
per capita
Positive
Per capita savings deposits of residents Positive
Degree of achievement
sharing
Ratio of urban and rural per capita
disposable income
Moderate
Ratio of urban and rural per capita
consumption
Moderate
Per capita expenditure on basic public
services
Positive
Public transport vehicles per 10000 people Positive
Per capita education expenditure Positive
Number of beds in medical institutions per
capita
Positive
Participation rate of basic endowment
insurance
Positive
Measurement and Coupling Coordination Analysis of Scientific and Technological Innovation and Common Prosperity
401

2.2 Research Methods and Data
Sources
2.2.1 Research Methods
a) Vertical and horizontal method
The evaluation of the coupling and coordination
relationship between scientific and technological
innovation and common prosperity is inseparable
from the measurement of their development level. In
this paper, the “vertical and horizontal method” is
used to determine the weight of each index on the
basis of index standardization. Suppose there are n
evaluated objects 𝑆
,𝑆
,⋯,𝑆
, p evaluation
indexes 𝑀
,𝑀
,⋯𝑀
, q periods 𝑡
,𝑡
,⋯𝑡
, and
𝑥
(
𝑡
)
represents the original value of the j index of
the ith Province in the 𝑡
year. In this paper, the zero
mean standardization method is selected to process
the index data dimensionless, and 𝑥
∗
(
𝑡
)
is the
processed value.For time 𝑡
(
𝑘=1,2,⋯,𝑞
)
, the
comprehensive evaluation function is: 𝑦
(
𝑡
)
=
∑
𝑤
𝑥
∗
(
𝑡
)
, where 𝑤
(𝑗=1,2,⋯𝑝) is the
index weight coefficient.The difference between the
evaluated objects can be expressed by the sum of
squares of the total deviation of 𝑦
(𝑡
): 𝜎
=
∑∑
(𝑦
(
𝑡
)
−𝑦)
.Since the original data has
been processed with zero mean, 𝜎
=
∑∑
(𝑦
(
𝑡
)
−𝑦)
=
∑
[
𝑤
𝐻
𝑤
=
𝑤
∑
𝐻
𝑤
=𝑤
𝐻𝑤, where 𝑤 is the weight
coefficient vector, 𝐻=
∑
𝐻
is the 𝑚∗𝑚
order symmetric matrix, and 𝐴
=
𝑥
(𝑡
)⋯𝑥
(𝑡
)
⋮⋱⋮
𝑥
(𝑡
)⋯𝑥
(𝑡
)
,𝑘=1,2,⋯,𝑞. If 𝑤
𝑤=
1 is limited and the maximum variance is required,
the nonlinear programming problem of equation (1)
must be solved to obtain 𝑤:
𝑚𝑎𝑥𝑤
𝐻𝑤
𝑠.𝑡.
𝑤
𝑤=1
𝑤>0
(1)
b) Coupling coordination model
The coupling coordination degree model can
effectively clarify the synergy and overall efficacy of
the interactive development of the coupling system,
so as to make up for the deficiency of the coupling
degree model in the analysis of the interaction
between systems. Therefore, the research uses the
coupling coordination degree model to measure the
coupling and coordinated development of scientific
and technological innovation ( U
) and common
prosperity (U
). The model is as follows:
C=
×
(2)
T=αU
+βU
(3)
D=
√
C×T
(4)
Where C is the coupling degree, which reflects
the coupling relationship between variables;T is the
comprehensive evaluation index, which reflects the
overall development level of the variable.αand β are
undetermined coefficients, α + β = 1. In this paper,
α = β = 0.5. D is the coupling and co
scheduling, 0≤D≤1. Referring to the existing
research, it can be divided into five types: D∈
[0,0.2) is the imbalance state, D∈[0.2,0.4) is the
antagonism state, D∈[0.4,0.6) is the running in
state, D∈[0.6,0.8) is the coupling state, and D∈
[0.6,0.8) is the coordination state (Lu and Wang
2019).
c) Obstacle model
The obstacle degree model introduces three
indicators: factor contribution degree, index
deviation degree and obstacle degree, which can
quantitatively analyze the impact of innovation input,
innovation output, overall prosperity and
achievement sharing degree of scientific and
technological innovation on their coupling
coordination degree. Based on the research of Li
Mengcheng and others (Li, et al, 2020), the specific
formula is as follows:
𝐼
=1−𝑌
(5)
ℎ
=𝐹
𝐼
∑
𝐹
𝐼
⁄
× 100% (6)
𝐻
=
∑
ℎ
(7)
Where 𝑌
is the standard value of the index;𝐼
is the index deviation degree, that is, the gap between
a single index and the goal of scientific and
technological innovation (or common prosperity);𝐹
is the factor contribution, that is, the weight of a
single index to the goal of scientific and technological
innovation (or common prosperity);ℎ
and 𝐻
are the
obstacles of index level indicators and factor level
indicators to scientific and technological innovation
(or common prosperity).
2.2.2 Data Sources
This paper takes the panel data of 30 inland provinces
in China (except Tibet) from 2000 to 2019 as the
sample. The data sources include China Statistical
Yearbook, China Science and technology statistical
yearbook, EPS data platform and provincial statistical
yearbooks. Due to the long investigation period and a
small number of missing values, the unified treatment
method in this paper is as follows: for the missing
values of individual annual indicators in a province,
the average value of the two years before and after the
missing value or the value of the years before and
BDEDM 2022 - The International Conference on Big Data Economy and Digital Management
402

after the missing value are used to fill in; For the
missing indicators of individual years in all
provinces, the interpolation method is used to fill in.
3 RESULTS AND DISCUSSION
3.1 Evaluation of Scientific and
Technological Innovation and
Common Prosperity
Figure 1 shows the development level of scientific
and technological innovation and common prosperity
of 30 provinces from 2000 to 2019.The curve with the
lightest color in the figure represents the
corresponding index of each province in 2000, and
the corresponding curve color gradually deepens with
the increase of years.
Figure 1: Scientific and technological innovation and
common prosperity.
It can be seen from Figure 1 (a) that the scientific
and technological innovation level of each province
increased year by year during the investigation
period, and the innovation ability among regions was
extremely uneven. The top 3 provinces in the level of
scientific and technological innovation in 2019 are
Beijing (0.703), Shanghai (0.501) and Guangdong
(0.469). As the most economically developed
provinces in China, these three places have sufficient
innovation resources such as R&D personnel and
R&D funds; Scientific papers, international patents
and other innovative achievements are relatively rich;
The momentum of innovation in finance,
information, science and technology is strong. In
addition, from 2000 to 2019, the level of scientific
and technological innovation in Guangdong,
Zhejiang and Jiangsu increased greatly, which has
relatively high development potential in the new era
led by innovation. As can be seen from Figure 1 (b),
the common prosperity level of China's provinces
increased year by year from 2000 to 2019.Among
them, the level of common prosperity in Beijing,
Shanghai, Zhejiang, Jiangsu and Tianjin is relatively
high, and the development degree of common
prosperity in central and western provinces such as
Chongqing, Shaanxi, Sichuan, Hunan and Hubei has
increased significantly during the investigation
period. It shows that the eastern coastal areas of China
have better realized the concept of "development
achievements shared by the people". Due to the
support of national policies, the progress of
infrastructure construction in the central and western
inland areas has been accelerated, and the people's
living standards have been greatly improved.
3.2 Analysis on the Coupling and
Coordination between Scientific
and Technological Innovation and
Common Prosperity
Based on the analysis of the development level of
scientific and technological innovation and common
prosperity, the coupling coordination degree model is
used to calculate the coupling coordination
dispatching, and analyze the coupling coordination
relationship between the two provinces from 2000 to
2019. The specific results are shown in Table 2.
According to the above judgment criteria, at the
beginning of the investigation period, the coupling
coordination degree between scientific and
technological innovation and common prosperity in
most provinces belongs to antagonistic type. Over
time, the running in provinces gradually increase. By
2019, Beijing has become the only coordinated
Province in China.
In terms of spatial distribution, the coupling and
coordination level of 30 provinces basically shows a
distribution pattern of "high coastal and low inland",
the driving effect of coastal areas is gradually
spreading to inland areas, and the spatial gap between
regions is gradually narrowing; In terms of coupling
types, the coupling coordination levels of 30
provinces during the investigation period include
"maladjustment type", "antagonism type", "running
in type", "coupling type" and "coordination type".
The intermediate state of coupling coordination is
mainly "antagonism type" and "running in type", and
the overall "football type" mode of "few high-low
provinces and more intermediate provinces" is
presented. High quality coupling coordination has not
yet appeared in a large area.
From the perspective of time distribution, in the
past two decades, the number of provinces with
unbalanced and antagonistic coupling and
coordination between scientific and technological
0
0,2
0,4
0,6
0,8
BJ
TJ
HE
SX
NM
LN
JL
HL
SH
JS
ZJ
AH
FJ
JX
SD
HA
HB
HN
GD
GX
HI
CQ
SC
GZ
YN
SN
GS
QH
NX
XJ
(a) scientific and
technological innovation
0
0,2
0,4
0,6
0,8
1
BJ
TJ
HE
SX
NM
LN
JL
HL
SH
JS
ZJ
AH
FJ
JX
SD
HA
HB
HN
GD
GX
HI
CQ
SC
GZ
YN
SN
GS
QH
NX
XJ
(b)common prosperity
Measurement and Coupling Coordination Analysis of Scientific and Technological Innovation and Common Prosperity
403
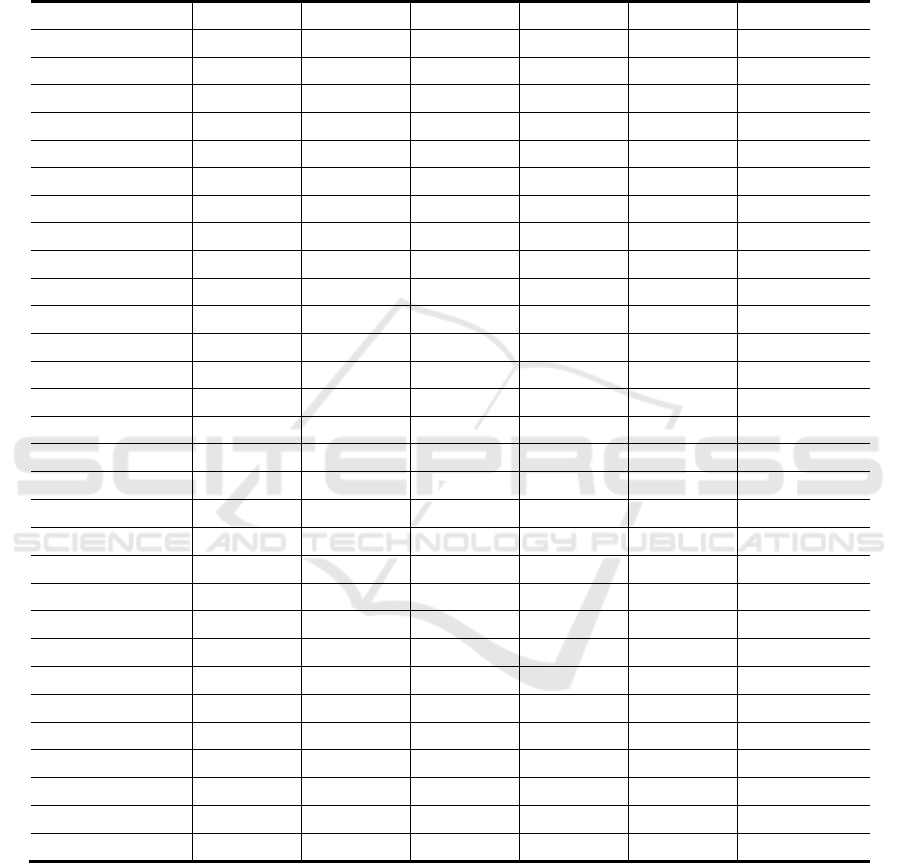
innovation and common prosperity has been
decreasing, while the number of provinces with
running in and coupling coordination has been
increasing gradually, while the number of
coordinated provinces has been very small since
2015, only Beijing. It can be seen that the coupling
and coordination level of China's provincial scientific
and technological innovation and common prosperity
is increasing year by year, but there is still much room
for improvement.
Table 2: The degree of coupling and coordination between scientific and technological innovation and common prosperity.
Province 2000 2005 2010 2015 2019 average
BJ 0.623 0.703 0.730 0.811 0.888 0.742
TJ 0.482 0.589 0.617 0.702 0.691 0.622
HE 0.243 0.272 0.368 0.427 0.486 0.353
SX 0.240 0.286 0.362 0.436 0.498 0.359
NM 0.192 0.278 0.362 0.419 0.455 0.342
LN 0.344 0.416 0.503 0.542 0.586 0.478
JL 0.308 0.373 0.473 0.526 0.572 0.446
HL 0.266 0.342 0.433 0.490 0.554 0.411
SH 0.549 0.653 0.660 0.718 0.778 0.669
JS 0.352 0.429 0.557 0.649 0.697 0.531
ZJ 0.345 0.420 0.530 0.622 0.699 0.512
AH 0.241 0.293 0.391 0.487 0.566 0.386
FJ 0.343 0.395 0.452 0.510 0.575 0.445
JX 0.231 0.279 0.377 0.460 0.552 0.370
SD 0.280 0.343 0.475 0.547 0.566 0.442
HA 0.220 0.262 0.358 0.459 0.515 0.354
HB 0.317 0.340 0.447 0.536 0.601 0.437
HN 0.260 0.323 0.441 0.521 0.583 0.416
GD 0.352 0.433 0.546 0.622 0.691 0.525
GX 0.224 0.267 0.367 0.416 0.457 0.339
HI 0.209 0.221 0.349 0.420 0.458 0.346
CQ 0.296 0.368 0.479 0.570 0.622 0.454
SC 0.280 0.328 0.427 0.511 0.568 0.418
GZ 0.241 0.239 0.348 0.389 0.462 0.324
YN 0.224 0.245 0.327 0.391 0.452 0.324
SN 0.333 0.373 0.479 0.543 0.613 0.460
GS 0.236 0.288 0.375 0.456 0.520 0.365
QH 0.241 0.284 0.341 0.398 0.474 0.344
NX 0.228 0.268 0.350 0.429 0.489 0.344
XJ 0.197 0.236 0.346 0.423 0.465 0.324
3.3 Obstacle Factor Diagnosis of
Coupling Coordination
Table 3 shows the top three obstacle factors of
scientific and technological innovation level from
2000 to 2019. It can be seen that the proportion of
added value of high-tech industry, R&D investment
intensity and R&D personnel per 10000 people
before 2015 are the top three influencing factors,
which are mainly concentrated in innovation input.
This is because China is in the initial stage of
innovation and development, the input in innovation
and R&D is seriously insufficient, and the innovation
environment needs to be improved. From 2015 to
2019, Proportion of added value of high-tech
industry, Proportion of new product sales revenue
and R&D expenditure intensity ranked among the top
BDEDM 2022 - The International Conference on Big Data Economy and Digital Management
404
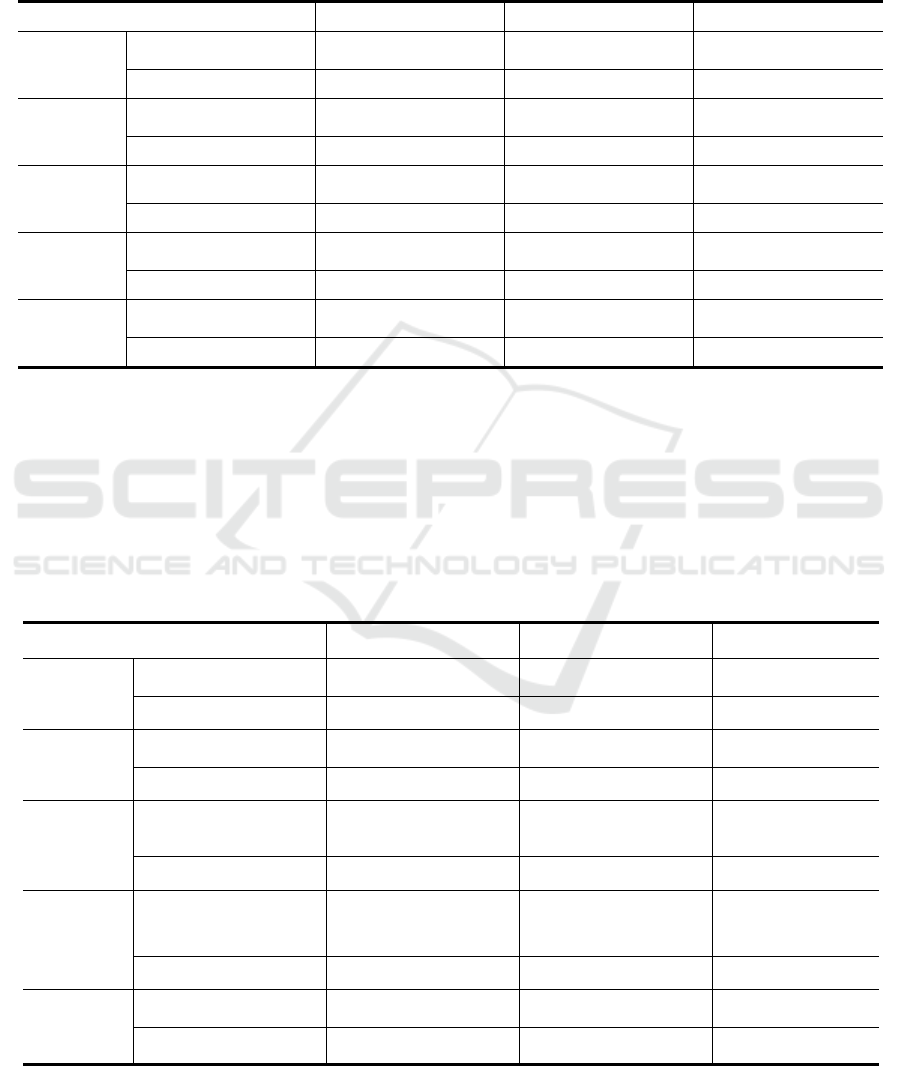
three, mainly focusing on innovation output,
indicating that China's innovation driven
development is in the transformation stage from
quantity catching up to quality surpassing. Improving
the transformation rate of innovation resources and
enhancing innovation benefits are the focus of future
development.
Table 3: Main obstacle factors and degree of scientific and technological innovation.
Ranking 1 2 3
2000
Obstacle factor
Proportion of added value
of high-tech industry
R&D expenditure
intensity
R&D personnel per
10000 people
Obstacle degree (%)
21.857 21.054 19.271
2005
Obstacle factor
Proportion of added value
of high-tech industry
R&D expenditure
intensity
R&D personnel per
10000 people
Obstacle degree (%)
21.959 20.904 19.656
2010
Obstacle factor
Proportion of added value
of high-tech industry
R&D expenditure
intensity
R&D personnel per
10000 people
Obstacle degree (%)
22.538 20.554 19.594
2015
Obstacle factor
Proportion of added value
of high-tech industry
Proportion of new
product sales revenue
R&D expenditure
intensity
Obstacle degree (%)
22.523 19.869 18.797
2019
Obstacle factor
Proportion of added value
of high-tech industry
Proportion of new
product sales revenue
R&D expenditure
intensity
Obstacle degree (%)
25.028 19.918 18.441
Table 4 shows the top three obstacle factors of
common prosperity from 2000 to 2019. It can be seen
that the main obstacle factors of common prosperity
during the investigation period are concentrated in the
degree of achievement sharing, including Per capita
expenditure on basic public services, Per capita
education expenditure, Per capita GDP, Number of
beds in medical institutions per capita, Participation
rate of basic endowment insurance, Public transport
vehicles per 10000 people. It shows that there is still
a certain gap in infrastructure construction, residents'
living standards and welfare benefits in different
regions of China. Improving the degree of sharing is
the focus of promoting common prosperity in China
in the future.
Table 4: Main obstacle factors and degree of common prosperity.
Ranking 1 2 3
2000
Obstacle factor
Per capita expenditure on
b
asic public services
Per capita education
expenditure
Per capita GDP
Obstacle degree (%)
14.544 13.807 12.993
2005
Obstacle factor
Per capita expenditure on
b
asic public services
Per capita education
expenditure
Per capita GDP
Obstacle degree (%)
14.003 13.533 12.949
2010
Obstacle factor
Per capita education
expenditure
Number of beds in
medical institutions per
capita
Per capita expenditure
on basic public
services
Obstacle degree (%)
13.486 12.854 12.744
2015
Obstacle factor Per capita GDP
Participation rate of basic
endowment insurance
Per capita expenditure
on basic public
services
Obstacle degree (%)
12.987 12.808 12.802
2019
Obstacle factor
Public transport vehicles
per 10000 people
Participation rate of basic
endowment insurance
Per capita GDP
Obstacle degree (%)
14.503 13.287 12.716
Measurement and Coupling Coordination Analysis of Scientific and Technological Innovation and Common Prosperity
405

4 CONCLUSIONS
This paper constructs the evaluation index system of
provincial scientific and technological innovation and
common prosperity, calculates the comprehensive
index and coupling co scheduling of the two systems
from 2000 to 2019, and reveals the main obstacle
factors affecting the development of the two systems.
The results show that China's scientific and
technological innovation level and common
prosperity level have continuously improved during
the investigation period, and there is a large gap
between different provinces. At the same time,
through the calculation and analysis of the coupling
and coordination model, it can be seen that the
coupling and coordination degree of scientific and
technological innovation and common prosperity in
various provinces is constantly improving. Among
them, Beijing has entered the state of coordinated
development since 2015.According to the main
obstacle factors of the two systems, the main obstacle
to the progress of scientific and technological
innovation lies in the low quality of innovation
output, and the main obstacle to the construction of
common prosperity lies in the low degree of
achievement sharing.
Scientific and technological innovation is not only
the creation power of social wealth, but also has an
impact on the distribution of wealth creation and
rational distribution of wealth. In the future, we
should give better play to the leading and supporting
role of scientific and technological progress in
building a modern industrial system, pay more
attention to quality and efficiency, advanced
industrial foundation, etc., promote the construction
of urban and rural infrastructure in different regions,
increase financial expenditure, and effectively
improve the living standards of residents.
ACKNOWLEDGEMENTS
This paper was jointly funded by the Graduate
Scientific Research and Innovation Fund of Zhejiang
Gongshang University and First Class Discipline of
Zhejiang-A (Zhejiang Gongshang University-
Statistics).
REFERENCES
Fan, C.L., Xie, C.F. (2018). Pro-poor growth and the
realization of common prosperity of socialism with
Chinese characteristics. China Political Economy. 1(2),
3-12.
Hu, A.G., Zhou, S.J. (2022). 2035 China: Achieving the
Vision of Common Prosperity. Journal of Beijing
University of Technology (Social Sciences Edition).
22(1), 1-22.
Li, M.C., Li, S.T., Wang, C.X., et al. (2020). Research on
comprehensive evaluation and obstacles of ecological
security of island-type tourism destination in China.
Marine Sciences. 44(5), 76-86.
Liu, P.L., Qian, T., Huang, X.H., Dong, X.B. (2021). The
Connotation, Realization Path and Measurement
Method of Common Prosperity for All. Management
World. 37(8), 117-129.
Lu, Y.Z., Wang, N. (2019). Study on coupling and
coordination between tourism industry and social
development. Resource development & Market. 35(6),
855-860.
BDEDM 2022 - The International Conference on Big Data Economy and Digital Management
406
