
Sensitivity Analysis using Regression Models: To Determine the
Impact of Meta-level Features on the Youtube Views
Vaishnavi Borwankar
1
, Catherine Chris
1
, Hitesh Kumar
1
and Sophia Rahaman
2
1
Department of Engineering and IT, Manipal Academy of Higher Education, Dubai, U.A.E.
2
School of Engineering and IT, Manipal Academy of Higher Education, Dubai, U.A.E.
sophia@manipaldubai.com
Keywords: Sensitivity Analysis, Ordinary Least Square Regression, Youtube Analysis, Meta-level Features, MAE, RAE.
Abstract: The popularity of social media has led to a shift in paradigm with YouTube emerging as a ubiquitous platform
for networking and content sharing. YouTube, with over a million content creators, has become the most
preferred destination for watching videos online. The meta-level features like the title, tags, number of views,
likes, dislikes, etc. are significant to determine the sensitivity of the videos. This study aims to determine how
these meta-level features can better be utilized to increase the popularity of the videos. The study specifically
analyzes how the number of likes, dislikes and comment count have an impact on the number of views. The
number of likes, dislikes and the comment count are the independent variables, while the view count is a
dependent variable. The dataset used for this research is the daily Trending YouTube Video Statistics for the
years 2017-2019 from Kaggle, that spans across the US region with over forty-thousand videos from sixty
plus channels released by YouTube for public use. In this paper, we use the Ordinary Least Square Regression
Algorithm and Stochastic Gradient Descent Algorithm to perform Sensitivity Analysis. The analysis is
performed on two categories: Media and Sports. The accuracy of both the models are compared by evaluating
the mean absolute error (MAE) and the relative absolute error (RAE) taken from the results of the experiment.
The results showed a significant impact of meta-level features on the popularity of the videos along with their
percentage dependency.
1 INTRODUCTION
The YouTube social media platform ranks as the
second most used application around the globe.
YouTube has emerged as a ubiquitous platform for
networking and content sharing. It has over 2 billion
users and counting as of 2021. Over millions of
videos are uploaded, viewed, liked, disliked,
commented on, and shared every minute. This study
is specific to two domains within the Entertainment
Category: Media and Sports. The user engagement
hits the chart for every entertainment-based video
with the top categories being Media and Sports. The
database collected from YouTube is mainly based on
the key matrices: view count, likes, dislikes and
comments. The popularity of the videos is greatly
affected by the meta-level features. The aim of the
study is to determine how the meta-level features are
utilized to analyze the sensitivity of the videos. This
study is performed on the dataset collected in the US
region in the years 2017-2019. Sensitivity analysis is
applied to the dataset to learn and analyze how the
key matrices are interdependent. As a result, this
study helps to conclude how the total reactions of the
audience in terms of likes and dislike have an impact
on the number of views.
To extract and discover patterns from the dataset
of Media and Sports, data mining was applied. Data
mining is the process of analyzing a large sets of data
to recognize trends and patterns using different
statistics and machine learning techniques.
Sensitivity analysis determines the rate of change in
the output of a model with respect to the changes in
the model inputs (Yao, 2003). Regression is one of
the most basic algorithms in data mining that has been
used on this dataset. These matrices are an important
source to extract implicit knowledge about users,
videos, categories and community knowledge
(Devika Harikumar, Dolly Kapoor, & Prof. Swapnil
Waghmare, 2019).
The aim of this paper is to determine the
sensitivity of the views of the YouTube videos with
270
Borwankar, V., Chris, C., Kumar, H. and Rahaman, S.
Sensitivity Analysis using Regression Models: To Determine the Impact of Meta-level Features on the Youtube Views.
DOI: 10.5220/0011207300003269
In Proceedings of the 11th International Conference on Data Science, Technology and Applications (DATA 2022), pages 270-275
ISBN: 978-989-758-583-8; ISSN: 2184-285X
Copyright
c
2022 by SCITEPRESS – Science and Technology Publications, Lda. All rights reserved
respect to the likes and dislikes. In particular, the
paper intends to show that by applying sensitivity
analysis to the dataset, it is possible to identify the
factors that play important roles to the popularity of
the video (Aprem & Anup, 2017). The following is
the outline of the paper. The following section is
about of discusses the Literature Review concerning
Sensitivity Analysis of YouTube videos. The third
section discusses the Methodology used to find the
results. The fourth section introduces the dataset and
its details. The fifth section gives detailed information
on the results and the analysis of the algorithms used.
The conclusion follows.
2 LITERATURE REVIEW
Data mining has been extensively examined in
YouTube, which is one of the most popular places for
user-generated content. Sensitivity and Sentiment
Analysis are two of the most popular peer-study
topics on YouTube. Despite its importance, trending
video analysis on YouTube has yet to be properly
examined. Many people have looked at the YouTube
recommendation system, but trending video analysis
still has a lot of room for improvement. Studies on the
popularity of videos have mainly focused on the
viewcount as a single metric (Zeni, Miorandi, & De
Pellegrini, 2016). But recently, other metrics have
rose to significant importance:
(a) According to studies, the YouTube
recommender uses the watchtime as a metric
for understanding how a video is popular
(Zeni, Miorandi, & De Pellegrini, 2016).
(b) The various meta-level attributes can be
used to build a conversion funnel to
characterize the impact of advertisement
campaigns. (Zeni, Miorandi, & De
Pellegrini, 2016; Abdulhadi Shoufan, 2019)
YouTube has become the most popular place to
watch videos online. Given the diversity of viewers
and content providers, it is difficult to determine the
popularity of the videos on the basis of the meta-level
attributes. Viral videos play an important role in
business marketing to reach target audience in a short
time-span (Gohar Feroz Khan & Sokha Vong, 2014).
Content creators can monetize their successful videos
through YouTube’s Partner program and enhance
their video popularity with the most sensitive meta-
level attributes like title, tag, thumbnail, etc. YouTube
uses a combination of measures to analyze and
provide a framework of understanding at different
levels.
Viewcount is an important popularity metric in
YouTube (Niyati Aggrawal, Anuja Arora, & Adarsh
Anand, 2018; Jussara M. Almeida, Flavio Figueiredo,
& Fabrício Benevenuto, 2011). Studies have
established that in the social dynamics setting, there
exists a causal relationship between the views and the
number of subscribers (William Hoiles, Anup Aprem,
& Vikram Krishnamurthy, 2017; Yan Duan &
Vikram Krishnamurthy, 2017). The Ordinary Least
Square Regression algorithm, which assesses the
relationship between one or more independent factors
and a dependent variable by minimizing the sum of
squares in the difference between the observed and
predicted values of the dependent variable defined as
a straight line, and the Stochastic Gradient Descent
Algorithm have been used.
3 METHODOLOGY
The main goal of this study is to determine how the
independent attributes affect the dependent attribute.
Likes and dislikes are the independent attributes that
have an impact on the dependent variable – view
count. To achieve this, two regression algorithms –
Ordinary Least Descent and Stochastic Gradient
Descent were used, and a model and a prediction
model is built (Quyu Kong, Marian-Andrei Rizoiu,
Siqi Wu, & Lexing Xie, 2018). The algorithms
determined the sensitivity of the view count against
the likes and dislikes and were then compared for
accuracy (Lau Tian Rui, Zehan Afizah Afif, & R. D.
Rohmat Saed, 2019).
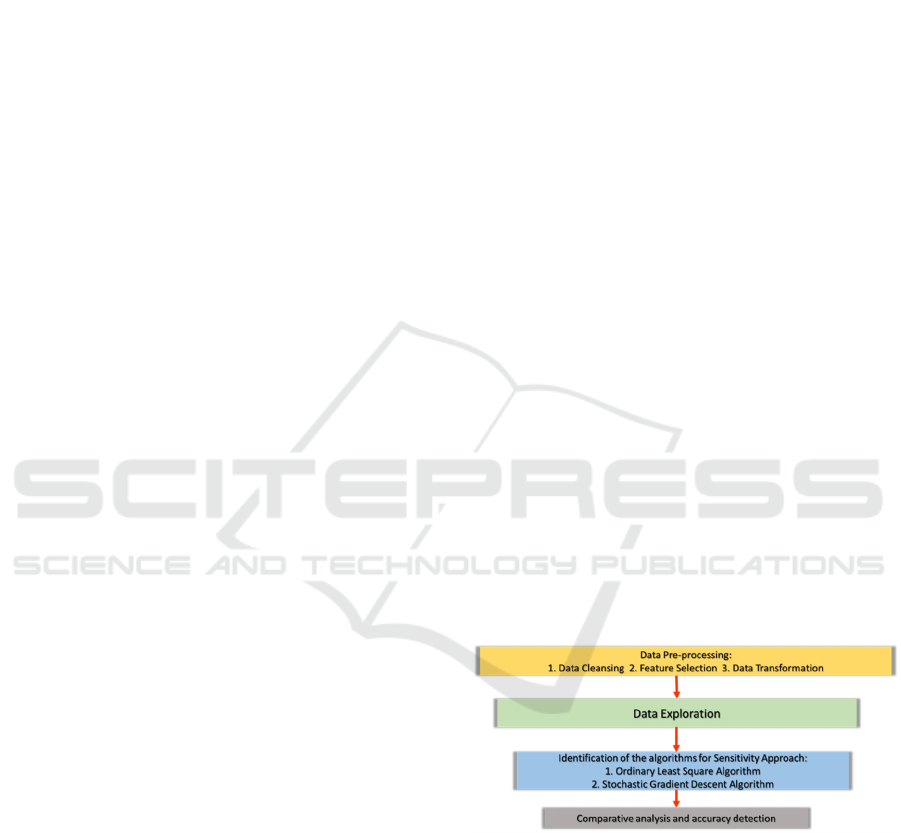
Figure 1: Representation of Methodology.
The data was pre-processed, and the raw data was
transformed into efficient and usable data. The first
step for pre-processing was data cleaning. In this step,
all the inconsistent and incomplete data was removed.
The dataset which consisted of various categories,
was cleaned of every category except for Sports and
Media. In the second step, feature selection was
performed. For this research, only 4 attributes were
required – Category id, views, likes and dislikes. In a
predictive model, feature selection is the process of
Sensitivity Analysis using Regression Models: To Determine the Impact of Meta-level Features on the Youtube Views
271
reducing the number of input variables to improve the
performance of the model.
The dataset is reduced to 4 attributes which are
used in building the model. In the third step, the data
is transformed by removing the noisy data. The
incomplete data is filled with null values and the data
is then made ready for performing data exploration.
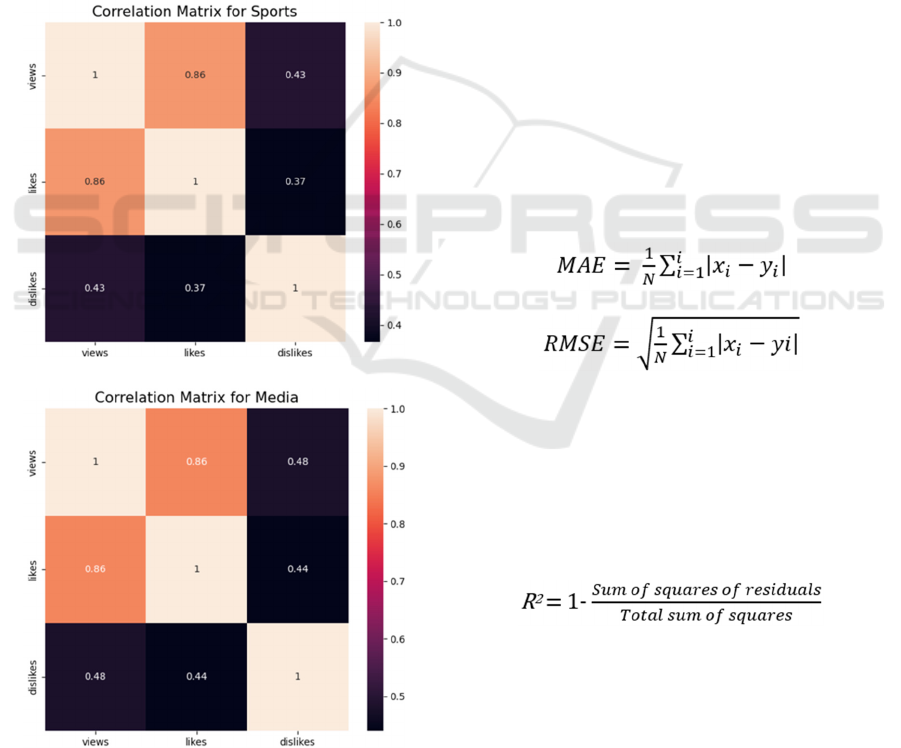
In Data Exploration, the data is visualized to get
insights into the patterns and trend of the likes and
dislikes vs the view count. Correlation matrix
determines the correlation coefficient between each
variable and the fit is then plotted as scatter plots. The
attributes of the data are understood and insights into
what each attribute contains are gained. Once the
patterns are relationships are established, the dataset
is ready for algorithms (Gábor Szabó & Bernardo
Huberman, 2008).
(a)
(b)
Figure 2: Correlation Matrix (a) for Sports (b) for Media.
As the aim of this experiment is to determine how
the independent variables affect the dependent
variables, regression algorithm fits well to draw
conclusions. For better accuracy, two regression
algorithms are used – Ordinary Least Square
Algorithm and Stochastic Gradient Descent
Algorithm (Lau Tian Rui, Zehan Afizah Afif, & R. D.
Rohmat Saed, 2019). In OLS algorithm, a hyperplane
is computed which reduces the sum of squared
differences between the true data and the hyperplane.
The SGD algorithm is used since the slope of the
function, or the gradient measure the degree of
change of a variable with respect to change in another
variable. In SGD, some samples are randomly
selected for every iteration and is less expensive to
optimize a learning algorithm.
Once both the algorithms are applied to the
dataset, they are compared for their accuracy. The
metrics used to test the accuracy are: Mean Absolute
Error, Root Mean Squared Error, and the Coefficient
of Determination (Lau Tian Rui, Zehan Afizah Afif,
& R. D. Rohmat Saed, 2019). The average difference
between the estimated and forecasted values is
calculated using the Mean Absolute Error. It is
calculated as:
RMSE is the standard deviation of the data points
from the regression line. It is calculated as:
(1)
(2)
Coefficient of Determination examines how
difference in one variable is explained by the
difference in another variable. In other words, it
determines whether a model fits the dataset. It is
calculated as:
The two algorithms are run separately for both the
categories – Sports and Media.
(3)
4 DISCUSSION
The Kaggle daily Trending YouTube Video Statistics
for the years 2017-2018 were utilized for this study
that spans across the US region with over forty-
thousand videos from sixty plus channels released by
DATA 2022 - 11th International Conference on Data Science, Technology and Applications
272
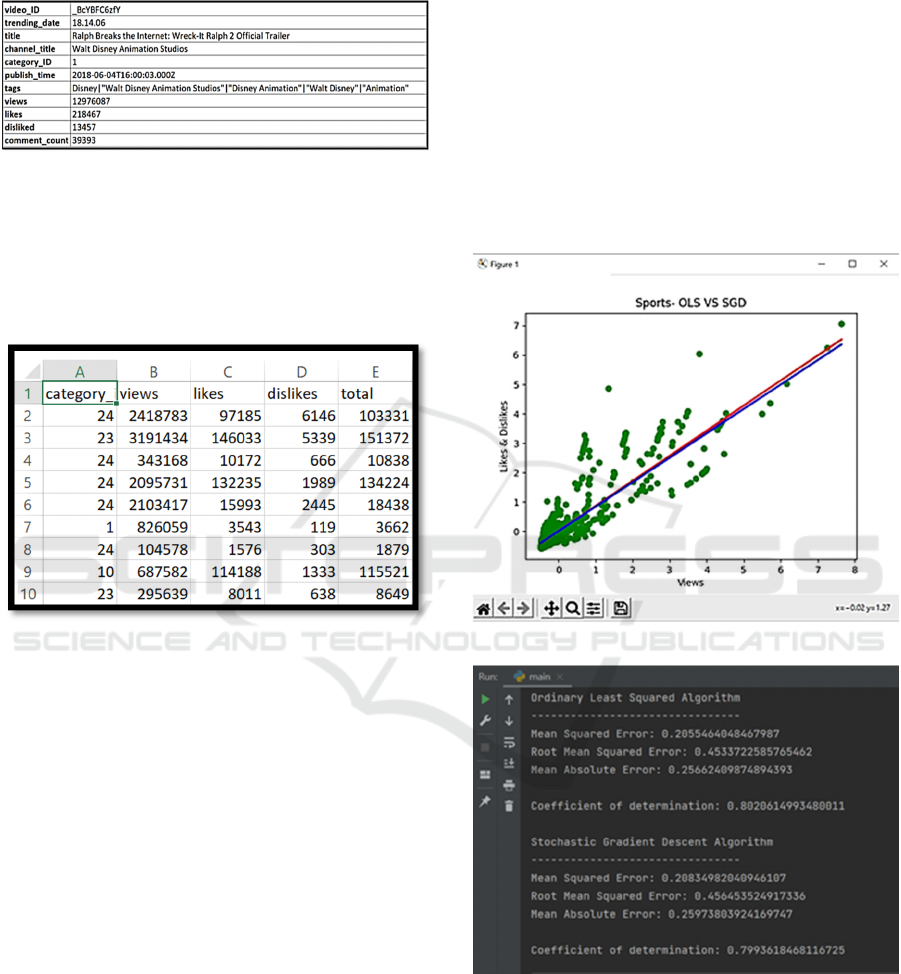
YouTube for public use. The original dataset
consisted of 40949 tuples and 11 attributes.
Figure 3: Original Dataset.
After pre-processing the number of rows
remained unchanged while the attributes were
reduced to four for analysis. Once the attribute
construction was performed, the number of attributes
increased to 5 for both the categories.
Figure 4: Dataset after pre-processing.
Once the dataset was ready, both the regression
models were applied to it. Ordinary Least Square
Algorithm works on the principle of minimizing the
sum of squares of the differences between the
observed dependent variable(views) and the
predicted independent variables (likes and dislikes).
Stochastic Gradient Descent Algorithm works on the
principle of using only one selection from the training
set. This makes SGD noisier than other gradient
descent algorithms but has a much shorter training
time.
5 RESULTS AND ANALYSIS
This study specifically analyses how the view count
is impacted by the number of likes and dislikes. The
likes, dislikes and comments count are the
independent variables, while the view count is a
dependent variable (Lau Tian Rui, Zehan Afizah Afif,
& R. D. Rohmat Saed, 2019). Initially, the dataset
consisted of 11 attributes, but pertaining to the aim of
the study, only 4 attributes were required for the
analysis. This was achieved through data cleaning
and pre-processing. Attribute construction was
performed by data reduction. Data reduction is the
technique applied to the dataset to reduce the
representation of the data. The data reduction
technique used is numerosity reduction using
regression.
After the data is pre-processed, the two
algorithms, Ordinary Least Square Regression and
Stochastic Gradient Descent Algorithm are applied to
it.
(a)
(b)
Figure 5: (a) A comparative graph of algorithms for Media
Category and (b) Findings of Data Analysis and
Interpretation.
Sensitivity Analysis using Regression Models: To Determine the Impact of Meta-level Features on the Youtube Views
273
(a)
(b)
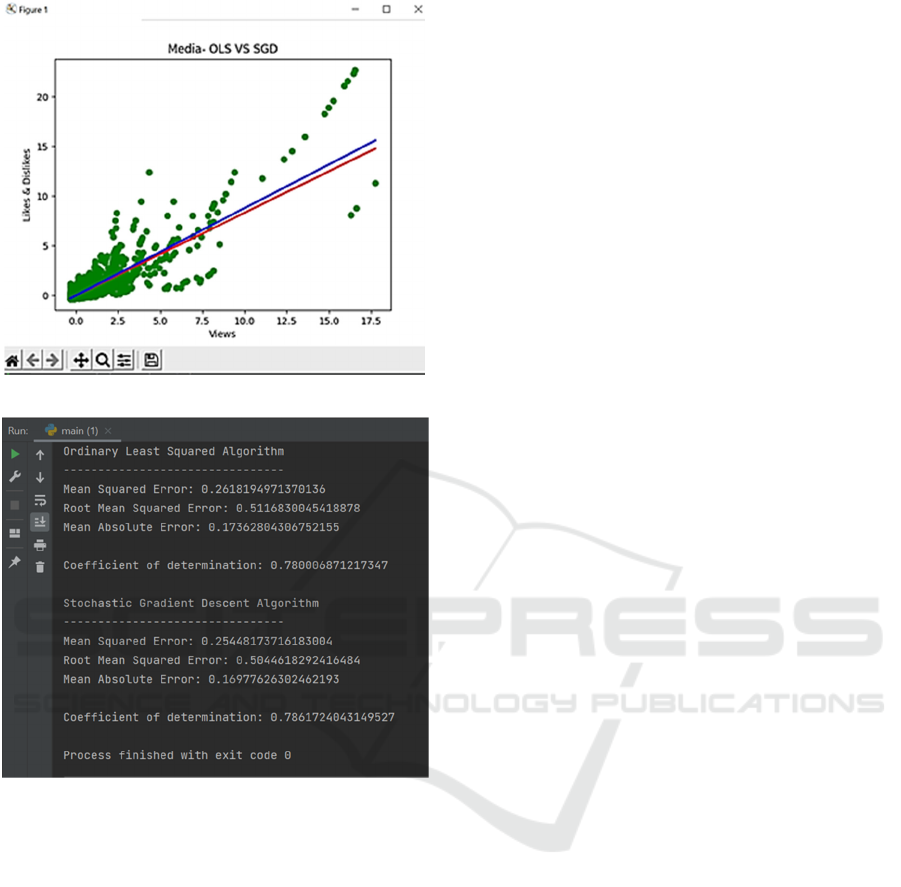
Figure 6: (a) A comparative graph of algorithms for Media
Category and (b) Findings of Data Analysis and
Interpretation.
We were able to conclude from the results that in
the Media Category, there is a variation of 78% in
views concerning the likes and dislikes using the
Ordinary Least Square Algorithm and 76.8% for
Stochastic Gradient Descent Algorithm. Similarly, in
the Sports Category, there is a variation of 80.2% in
views against the likes and dislikes using the Ordinary
Least Square Algorithm and 79.9% using the
Stochastic Gradient Descent Algorithm. SGD
algorithm proved to be more accurate as compared to
the OLS algorithm and this is tested and verified by
comparative analysis and accuracy detection. In
conclusion, the Stochastic Gradient Descent Algorithm
is more efficient to provide the accurate Sensitivity of
the Views for both the Media and Sports Category.
6 CONCLUSIONS
YouTube, a platform that receives millions of views,
likes and dislikes each day, provides a strong ground
for analysing the performance of videos and the effect
of meta-level features on each other. The study was
conducted on a dataset for the USA region for two
popular categories- Media and Sports for the years
2017-2018.
The analysis showed that in both the categories,
view count was highly sensitive to the number of likes
and dislikes on the video. This study presented a new
dimension to assessing YouTube content, however, it
has its limitations. The number of users viewing any
content online do not necessarily react to it in terms
of likes, dislikes, or comments. This creates
ambiguity regarding user reactions and hence
imposes a limit on the output of the model. The
analysis of any YouTube database can be further
explored in terms of viewer emotions by taking into
account the comments on the videos. This analysis
was conducted only from the perspective of user
reactions; however, other attributes can also impact
the view count. This study did not consider attributes
like watch-time, demographics, subscriber growth,
click-through rates and the keywords used, to name a
few. By including these factors, this study can be
enhanced and made more productive.
The results show that the OLS algorithm can
further be used to analyse the effect of other meta-
level attributes on the number of views. This can
further lead to developing prototypes for increasing
the user engagement. This foundational study was
carried out to gauge the reaction of the audience and
further analysis can be carried out in terms of age
bracket, therapy, and social impacts (William R.
Casola, et al., 2020; Mike Thelwall, 2018). This study
could also lead to more advanced study on how
YouTubers can increase their view count with
sponsored content (Fulya Acikgoz & Sebnem Burnaz,
2021; Natasha Matson & Elmira Djafarova, 2021)
and recommend content to users based on the metrics
(James Davidson, Benjamin Liebald, Junning Liu, &
Palash Nandy, 2010).
REFERENCES
Abdulhadi Shoufan. (2019). Estimating the cognitive value
of YouTube's educational videos: A learning analytics
approach (Vol. 92). Computers in Human Behavior.
Aprem, & Anup. (2017). Detection, estimation and control
in online social media. University of British Columbia.
DATA 2022 - 11th International Conference on Data Science, Technology and Applications
274

Devika Harikumar, Dolly Kapoor, & Prof. Swapnil
Waghmare. (2019). YouTube data sensitivity and
analysis using Hadoop framework (Vol. 6).
International Research Journal of Engineering and
Technology (IRJET).
Fulya Acikgoz, & Sebnem Burnaz. (2021). The influence
of “influencer marketing” on YouTube influencers.
International Journal of Internet Marketing and
Advertising, 15, 1-3.
Gábor Szabó, & Bernardo Huberman. (2008). Predicting
the Popularity of Online Content. Communications of
the ACM, 1-2.
Gohar Feroz Khan, & Sokha Vong. (2014). Virality over
YouTube: an empirical analysis (Vol. 24). Internet
Research.
James Davidson, Benjamin Liebald, Junning Liu, & Palash
Nandy. (2010). The YouTube video recommendation
system. ACM Conference on Recommender Systems,
RecSys 2010, (pp. 1-3). Barcelona, Spain.
Jussara M. Almeida, Flavio Figueiredo, & Fabrício
Benevenuto. (2011). The tube over time: characterizing
popularity growth of youtube videos. Fourth ACM
International Conference on Web Search and Data
Mining (pp. 1-3). Hong Kong: Association for
Computing Machinery.
Lau Tian Rui, Zehan Afizah Afif, & R. D. Rohmat Saed.
(2019). A regression approach for prediction of
Youtube views. Bulletin of Electrical Engineering and
Informatics, 8, 1-4.
Mike Thelwall. (2018). Social media analytics for YouTube
comments: potential and limitations. International
Journal of Social Research Methodology, 21, 1-2.
Natasha Matson, & Elmira Djafarova. (2021). Credibility
of digital influencers on YouTube and instagram.
International Journal of Internet Marketing and
Advertising, 15, 1-2.
Niyati Aggrawal, Anuja Arora, & Adarsh Anand. (2018).
Modeling and characterizing viewers of You Tube
videos. International Journal of System Assurance
Engineering and Management, 9, 1-2.
Quyu Kong, Marian-Andrei Rizoiu, Siqi Wu, & Lexing
Xie. (2018). Will This Video Go Viral? Explaining and
Predicting the Popularity of Youtube Videos. The Web
Conference 2018 (pp. 1-2). Lyon, France: International
World Wide Web Conferences Steering Committee.
William Hoiles, Anup Aprem, & Vikram Krishnamurthy.
(2017). Engagement and Popularity Dynamics of
YouTube Videos and Sensitivity to Meta-Data. IEEE
Transactions on Knowledge and Data Engineering, 29,
1-2.
William R. Casola, Jaclyn Rushing, Sara Futch, Vicoria
Vayer, Danielle F. Lawson, Michelle J. Cavalieri, . . .
M. Nils Peterson. (2020). How do YouTube videos
impact tolerance of wolves? Human Dimensions of
Wildlife , 1-2.
Yan Duan, & Vikram Krishnamurthy. (2017). Digging into
YouTube data: Dependence structure analysis using
vine copula. arXiv, 1-2.
Yao, J. T. (2003). Sensitivity analysis for data mining.
IEEE.
Zeni, M., Miorandi, D., & De Pellegrini, F. (2016).
Understanding the Di
ff
usion of YouTube Videos.
Trento: Springer, Cham.
Sensitivity Analysis using Regression Models: To Determine the Impact of Meta-level Features on the Youtube Views
275
