
Changes of Eukaryotes Microorganism Structures in Soil during
Continuous Cropping of Lettuce
Xinyu Wang
a
, Qingwen Li
b
, Jie Hong
c
, Zhidi Chen
d
, Yi Gao
e
, Xinxin Yi
f
and Xiuzhi Gao
*g
1
Beijing Laboratory of Food Quality and Safety, Beijing Key Laboratory of Agricultural Product Detection and Control of
Spoilage Organisms and Pesticide Residue, Beijing Engineering Laboratory of Probiotics Key Technology Development,
College of Food Science and Engineering, Beijing University of Agriculture, Beijing, 102206, China
zhidic416@126.com, gao15901499854@163.com, yixinxin2008@163.com
*
Corresponding author: gxz@bua.edu.cn
Keywords:
Eukaryotes Microorganism Structures, Continuous Cropping, Lettuce.
Abstract:
This study aimed to analyse eukaryotes in soil during the continuous cropping of lettuce. High-throughput
sequencing technology was used to analyze the eukaryotes present in soil samples before and after crop
planting, in order to provide data that will aid in alleviating the problems resulting from the continuous
cropping of lettuce. The results showed that Trichocladium, Chlorosarcinopsis, Hindakia, Zea, Diploscapter
and Tylenchorhynchus species were increased during continuous cropping. It indicates that the continuous
cropping of lettuce affected the eukaryotic microbial community.
1 INTRODUCTION
1
Soil microbes consist mainly of bacteria, fungi,
actinomycetes and some algae, all of which play
important roles in the ecological environment and
constitute the core of the soil ecosystem in terms of
maintaining soil quality and health (Vessey 2003).
Because of the rapid response to environmental
changes, microorganisms is regarded as an effective
biological indicator to assess soil conditions and land
management success (Chen 2012). Soil eukaryotes
play important roles in the maintenance of soil
nutrients and in biogeochemical cycles.
However, soil microbiology studies, at present,
mainly assess microbial biomass, the soil respiration
rate, and other quantitative aspects. Analysis of soil
microbial biomass may only reflect the influence of
some functionally specialized microorganisms (Tang
2007). The microbial respiration rate can be regarded
a
https://orcid.org/0000-0002-4304-4738
b
https://orcid.org/0000-0003-1882-8351
c
https://orcid.org/0000-0002-9672-9554
d
https://orcid.org/0000-0003-3894-0252
e
https://orcid.org/0000-0002-6981-4032
f
https://orcid.org/0000-0002-2139-1149
g
https://orcid.org/0000-0002-1122-4742
as an index of the total number of active soil
microorganisms. Neither of these parameters are able
to measure changes in the composition of the
microflora. To obtain complete knowledge of changes
in soil quality in terms of the microorganisms in soil at
the genus or species level, the determination of soil
microbial diversity and microbial structure should be
combined. The measurement of changes in microbial
activity and community structure over time has been
considered to be a better indicator of soil quality.
Lawton and other researchers have proposed that, in
addition to the richness of species, the presence of
species with certain functional properties and the
overall composition of the microbial community can
affect ecosystem function (Lawton 1994). During
research into the use of continuous planting and
rotation in the farming of eggplants, Li found that
continuous planting changed the structure and
diversity of the microbial community in soil (Li 2017).
484
Wang, X., Li, Q., Hong, J., Chen, Z., Gao, Y., Yi, X. and Gao, X.
Changes of Eukaryotes Microorganism Structures in Soil during Continuous Cropping of Lettuce.
DOI: 10.5220/0011217900003443
In Proceedings of the 4th International Conference on Biomedical Engineering and Bioinformatics (ICBEB 2022), pages 484-489
ISBN: 978-989-758-595-1
Copyright
c
2022 by SCITEPRESS – Science and Technology Publications, Lda. All rights reserved

The purpose of this study was to investigate the
impact of the continuous cropping of lettuce. The
eukaryotes community structure was examined using
high-throughput sequencing technology.
2 MATERIALS AND METHODS
2.1 Site Description
The test was carried out in a plastic greenhouse at a
test demonstration base in Beijing (116.14°E
longitude, 40.19°N latitude). Before the experiment,
mung beans were grown in the greenhouse for a long
time. The annual average temperature was 12.6℃,
and the annual precipitation was 680.6 mm.
2.2 Experimental Design
The adjacent land was protected by two ditches 1.2 m
wide and 6.5 m long. These experiments were
conducted between September 2016 and June 2017.
Due to the low temperature in winter, the
experimental field for continuous lettuce cultivation
was landfilled and no crops were planted during this
period. Other treatments were consistent throughout
the planting period. An area of 20 × 20 cm was
randomly selected, and the lettuce production in this
area was weighed by a weighing method. The field
soil samples were collected by the five-point method,
four samples were collected at the four corners, and
one sample was collected at the center of the field;
samples were collected at a sampling depth of 0-10
cm and 10-20 cm before and after crop planting. After
removing the residual leaves and roots, putted the soil
sample in a sterile sampling bag. Combined the five-
point samples and divided them into two parts: one
part was used for experiments, and the other part was
stored at -40 ℃ for subsequent experiments. Table 1
gives the description of each soil sample. The lettuce
continuous cropping group (N) naming format used
was N - planting year - cultivation number - 1 (before
planting) / 2 (after planting) - soil depth.
Table 1: Description of soil samples.
Sample Collection date Depth (cm) State of crop growth Cultivation time
N.16.1.1.10 2016.09.09 0-10 Before cultivation 1st
N.16.1.1.20 2016.09.09 10-20 Before cultivation 1st
N.16.1.2.10 2016.10.20 0-10 Harvest 1st
N.16.1.2.20 2016.10.20 10-20 Harvest 1st
N.17.2.1.10 2017.03.10 0-10 Before cultivation 2nd
N.17.2.1.20 2017.03.10 10-20 Before cultivation 2nd
N.17.2.2.10 2017.03.21 0-10 Mid-cultivation 2nd
N.17.2.2.20 2017.03.21 10-20 Mid-cultivation 2nd
N.17.2.3.10 2017.04.27 0-10 Harvest 2nd
N.17.2.3.20 2017.04.27 10-20 Harvest 2nd
N.17.3.1.10 2017.05.23 0-10 Before cultivation 3rd
N.17.3.1.20 2017.05.23 10-20 Before cultivation 3rd
N.17.3.2.10 2017.06.20 0-10 Harvest 3rd
N.17.3.2.20 2017.06.20 10-20 Harvest 3rd
2.3 DNA Extraction and PCR
Amplification
DNA was extracted from 1.0 g of soil sample using
the Mag-Bind® Universal Metagenomics Kit
according to the manufacturer’s instructions. The
quality of the extracted DNA was determined using
agarose gel electrophoresis (0.8%), and the DNA was
quantified using a UV spectrophotometer. The
extracted DNA was stored at -80℃ prior to analysis.
The V4-V5 region within the 18S rRNA gene was
amplified from each sample using general eukaryotic
primers TAReuk454F WD1 (5'-
CCAGCASCYGCGGTAATTCC-3') and TAReu
kREV3 (5'-ACTTTCGTTCTTGATYRA-3')
(Logares 2016) according to previously published
protocols. PCR amplification was conducted using
the Q5 high fidelity DNA polymerase (NEB, UK); the
number of amplification cycles was strictly controlled
to ensure that the least number of cycles were used as
Changes of Eukaryotes Microorganism Structures in Soil during Continuous Cropping of Lettuce
485

possible and the amplification conditions used for
each batch of samples were consistent. The high-
throughput sequencing of the 18S rRNA gene was
conducted using the Illumina MiSeq PE300 platform
at the Shanghai Majorbio Bio-pharm Biotechnology
Co., Ltd. (Shanghai, China). The read sequences were
deposited into the NCBI Sequence Read Archive
under accession numbers SRP155301 and
SRP154689.
2.4 Sequence Analysis
To integrate the original double-ended sequencing
data into our analysis, a sliding window method was
used to individually screen the double-end sequences
in FASTQ format. The FLASH software (v1.2.7;
http://ccb.jhu.edu/ software/FLASH/) was used to
pair the double-ended sequences via a primary quality
screen of the overlapping bases. The sequencing
results were analyzed using the QIME software
(v1.8.0; http://qiime.org/). Sequences that met the
following criteria were filtered out: (1) length < 150
bp; (2) contained fuzzy bases; (3) number of
mismatched bases in 5'-end primers > 1; (4) number
of consecutive identical bases > 8. Chimeric
sequences were verified and removed using
USEARCH (v5.2.236;
http://www.drive5.com/usearch/).
The QIIME and UCLUST softwares were used to
divide the operational taxonomic units (OTU) at 97%
similarity; the most abundant sequence in each OTU
was selected as the representative sequence of the
OTU. Then, according to the number of sequences
corresponding to each OTU in each sample, the
matrix file containing the OTU abundances in each
sample was constructed. For each OTU representative
sequence, the default parameters were used in the
QIIME software to obtain the taxonomic information
corresponding to each OTU by comparing the
representative sequence to the template sequence in
the Silva database (Release 115; http://www.arb-
silva.de).
3 RESULTS
3.1 Lettuce Yield
The yields of continuous cropping lettuce were 4.88
kg/m
2
, 5.54 kg/m
2
and
5.29 kg/m
2
respectively.
3.2 Soil Eukaryotes Diversity and
Community Structure during
Continuous Cropping
After the DNA sequences obtained from the soil
samples were trimmed and filtered for quality and
chimeric reads, pyrosequencing was conducted. These
experiments resulted in a total of 2 995 049 sequence
reads that were obtained from eukaryotes 18S rRNA
in 30 soil samples. The sequences that had a similarity
of greater than 97 % were classified as belonging to
the same OTU. The description of the indices that
were used, including ACE, Chao1, Shannon, Simpson,
goods-coverage and Simpson- evenness, are shown in
Table 2. During the first cultivation period, the Chao1
(78%), ACE (83%), Simpson (2%), and Shannon (2%)
indices for the 0-10 cm harvest soil samples were
increased compared with those for the samples
obtained before cultivation, and the same trend was
observed for the 10-20 cm soil samples, for which the
Chao1, ACE, Simpson and Shannon indices were
increased by 4%, 2%, 2% and 4%, respectively.
During the second cultivation period, the Chao1 (-1%)
and ACE (-2%) indices were decreased for the 0-10
cm soil samples, in contrast with the Simpson (1%),
and Shannon (1%) indices, which were increased. For
the 10-20 cm soil samples, all of the diversity indices,
including Chao1 (-34%), ACE (-32%), Simpson (-
23%), and Shannon (-40%), were decreased. The same
phenomenon was observed during the third cultivation
period; however, compared to the first period, all of
the diversity indices were increased. For the 0-10 cm
samples, the increases were as follows: Chao1
(113%), ACE (115%), Simpson (13%) and Shannon
(63%); for the 10-20 cm samples, the increases were:
Chao1 (14%), ACE (17%), Simpson (17%) and
Shannon (62%). The good-coverage index was
between 99.7%-100%, indicating that the sequencing
depth was sufficient to cover all of the species present
in the sample (Table 2).
In contrast, there were 414 shared OTUs (7.21%)
found in all of the soil samples, and there were 436
unique OTUs (45+37+48+92+214; 7.59%) (Fig.1),
accounting for 3.6%, 2.4%, 3.1%, 6.0%, and 16.6%
of the total number of OTUs in each sample,
respectively. The overall trend in the proportion of
unique OTUs in the soil samples was observed to be
one of gradual increase, which indicates that the
planting of lettuce affected the eukaryotic microbial
community. The proportion of unique OTUs
increased during the first cultivation period but
declined during the second and third cultivation
periods. During each cultivation period, the
ICBEB 2022 - The International Conference on Biomedical Engineering and Bioinformatics
486
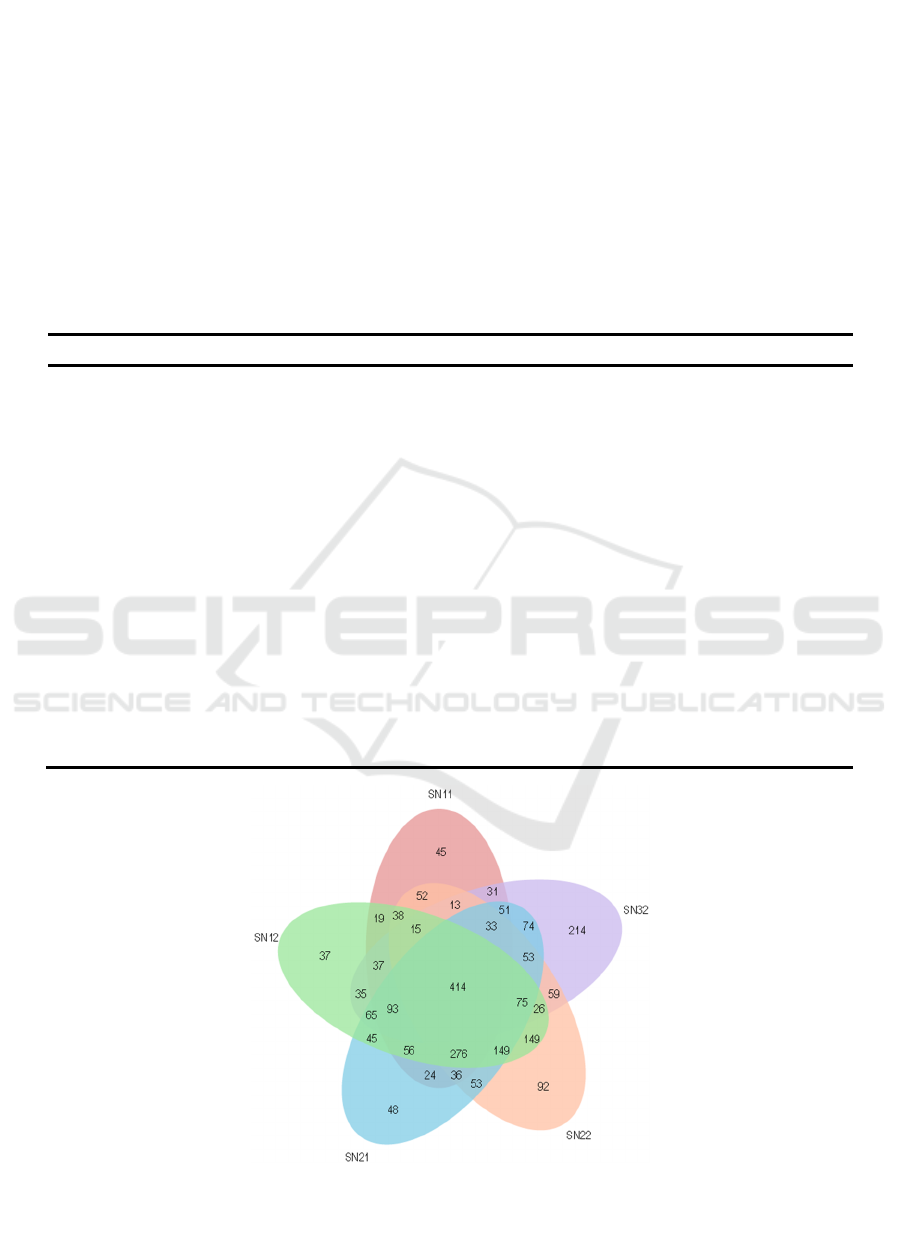
proportion of shared OTUs in the harvest and
cultivation soil samples decreased as the cultivation
frequency increased (Table 3).
At the genus level, there were significant
differences in the species present in soil at different
depths. In the 0-10 cm soil samples, Mortierella and
Lactuca species decreased over time during the three
periods of lettuce planting. In contrast,
Trichocladium, Chlorosarcinopsis, Diploscapter,
Hindakia, Tylenchorhynchus and Zea species
increased over the same period of time. In addition,
some eukaryotes were affected by the idle
period; Chlamydomonas, Copromyxa, Pterygota,
Desmochloris, Heterococcus and Rubus species
showed a rise-fall-rise trend, while Plasmodiophora
and Alogomyces species presented a fall-rise-fall
trend. In the 10-20 cm soil samples, Fusarium,
Trichophaeopsis, Pseudallescheria and Orbicula
species increased during continuous cropping, while
Mortierella, Eocercomonas, Pythium,
Chlorosarcinopsis, Tetracystis, Macrobiotus, and
Gallus species demonstrated a rise-fall-rise trend.
Additionally, Stachyamoeba species showed a fall-
rise-fall trend (Fig. 2).
Table 2. Eukaryotes diversity within the continuous cropping soil samples.
Samples
Chao1
ACE
Simpson
Shannon
Goods_coverage
Evenness
N.16.1.1.10 517.0000 517.0000 0.8408 4.4452 1.0000 0.4931
N.16.1.2.10 919.5301 945.0977 0.8612 4.5395 0.9977 0.4662
N.17.2.1.10 1202.7557 1220.3624 0.9064 5.6456 0.9974 0.5571
N.17.2.2.10 1103.1321 1115.4176 0.8984 5.4381 0.9975 0.5444
N.17.2.3.10 1188.3860 1199.2055 0.9190 5.6780 0.9976 0.5610
N.17.3.1.10 621.0000 621.3391 0.8673 4.4233 1.0000 0.4767
N.17.3.2.10 1320.7807 1337.8595 0.9766 7.2261 0.9978 0.7010
N.16.1.1.20 1031.8201 1043.0437 0.8846 5.5050 0.9982 0.5538
N.16.1.2.20 1068.5283 1063.3434 0.9066 5.7253 0.9983 0.5734
N.17.2.1.20 1207.3285 1204.0233 0.9023 5.7121 0.9978 0.5633
N.17.2.2.20 1239.6391 1229.8505 0.8946 5.6729 0.9976 0.5584
N.17.2.3.20 798.2095 823.3581 0.6946 3.4453 0.9979 0.3616
N.17.3.1.20 1070.6346 1035.2957 0.8375 4.5212 0.9972 0.4597
N.17.3.2.20 1220.2435 1213.2584 0.9769 7.3027 0.9981 0.7178
Figure 1: Venn diagram showing the shared eukaryotes OTUs (at a distance of 0.03) in the continuous cropping soil samples.
SN11, before the first planting; SN12, after the first planting; SN21, before the second planting; SN22, after the second
planting; SN32, after the third planting.
Changes of Eukaryotes Microorganism Structures in Soil during Continuous Cropping of Lettuce
487
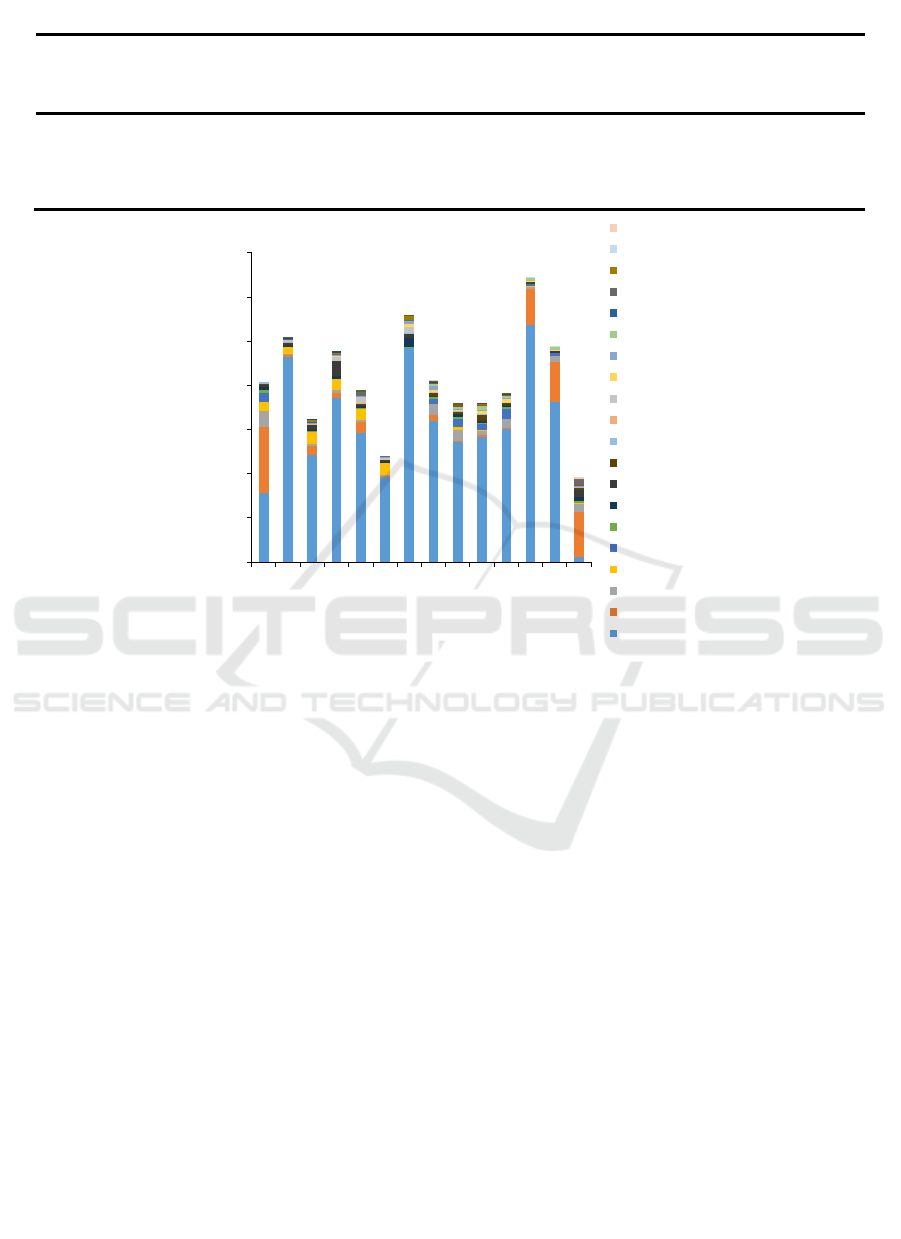
Table 3: The proportion of shared and unique OTUs in the harvest and cultivation soil samples from each cultivation period.
Unique OTUs in
cultivation soil samples (%)
Unique OTUs in
harvest soil samples (%)
Shared OTUs (%)
1st 15.7 32.0 52.3
2nd 22.9 22.3 54.8
3rd 39.6 28.1 32.3
Figure 2: Relative abundance of different eukaryotic genera in the continuous cropping soil samples.
4 DISCUSSION
The main purpose of this study was to analyze the
changes in eukaryotes communities in soil during the
continuous cropping of lettuce via the high-
throughput sequencing of microbes in soil samples.
Nematoda are the most dominant faunal group in
this experiment, which is highly diverse, ranked third
in terms of richness during these experiments. There
are approximately 100,000 - 1 million nematodes
worldwide, which account for 80% of the total
number of animals (Parkinson 2004). Nematoda are
divided into three types of species, namely, plant-
feeding nematodes, bacterial-feeding nematodes, and
fungal-feeding nematodes; some of these species
cause economic losses during plant cultivation
(Mcsorley 2016). During the continuous cropping
process, the abundance of Nematoda in the soil was
gradually increased as the planting times were
increased. Prismatolais and Ceratoplectus were two
bacterial nematode genera that appeared during the
third planting. Studies have shown that nematodes
that feed on bacteria have a great potential to function
as predators of soil bacteria (Xiao 2014). When
nematodes reach a certain abundance, their feeding
reduces the number and activity of bacteria, which
results in a reduction in nitrogen mineralization due
to the consumption of fixed and nutritive components
(Mao 2005). Compared with the early stages of
planting, the number of nematodes that feed on fungi
in the soil was increased; Aphelenchoides species
were increased in the 0-10 cm soil, samples, while the
percentage of Aphelenchus and Tylencholaimus
species were increased in the 10-20 cm soil samples.
This may be related to the increase in the amount of
eukaryotes in the soil that resulted from the increase
in planting times.
5 CONCLUSION
Using Illumina MiSeq to sequence eukaryotes 18S
rRNA, changes in eukaryotes community structures
occurring during the continuous cropping of lettuce
0.00%
10.00%
20.00%
30.00%
40.00%
50.00%
60.00%
70.00%
N
.
1
6
.
1
.
1
.
1
0
N
.
1
6
.
1
.
2
.
1
0
N
.
1
7
.
2
.
1
.
1
0
N
.
1
7
.
2
.
2
.
1
0
N
.
1
7
.
2
.
3
.
1
0
N
.
1
7
.
3
.
1
.
1
0
N
.
1
7
.
3
.
2
.
1
0
N
.
1
6
.
1
.
1
.
2
0
N
.
1
6
.
1
.
2
.
2
0
N
.
1
7
.
2
.
1
.
2
0
N
.
1
7
.
2
.
2
.
2
0
N
.
1
7
.
2
.
3
.
2
0
N
.
1
7
.
3
.
1
.
2
0
N
.
1
7
.
3
.
2
.
2
0
Relative abundance
Sample name
Pterocystis
Stachyamoeba
Heterococcus
Tylenchorhynchus
Desmochloris
Orbicula
Macrobiotus
Pseudallescheria
Hindakia
Diploscapter
Tetracystis
Alogomyces
Copromyxa
Pythium
Eocercomonas
Fusarium
Lactuca
Mortierella
Plasmodiophora
Trichocladium
ICBEB 2022 - The International Conference on Biomedical Engineering and Bioinformatics
488

were observed. The results showed that
Trichocladium, Chlorosarcin- opsis, Hindakia, Zea,
Diploscapter and Tylenchorhynchus species were
increased during continuous cropping.
ACKNOWLEDGEMENTS
This work was supported by the Beijing Leafy
Vegetables Innovation Team of Modern Agro-
industry Technology Research System (BAIC07-
2021) and fund for Academic Degree & Graduate
Education of Beijing University of Agriculture
(2021YJS029).
REFERENCES
Chen, M N, Li, X and Yang, Q L, et al. (2012) Soil
eukaryotic microorganism succession as affected by
continuous cropping of peanut--pathogenic and
beneficial fungi were selected. Plos One, 7(7): e40659.
Lawton, J H. (1994) What do species do in ecosystems.
Oikos. 71: 367-374.
Li, T, Liu, T and Zheng, C, et al. (2017) Changes in soil
bacterial community structure as a result of
incorporation of brassica plants compared with
continuous planting eggplant and chemical disinfection
in greenhouses.PloS ONE. 12: e0173923.
Logares, R, Audic, S and Santini, S, et al. (2016) Diversity
patterns and activity of uncultured marine heterotrophic
flagellates unveiled with pyrosequencing. ISME
J.,6(10): 1823-1833.
Mcsorley, R. (2016) Soil-inhabiting nematodes, phylum
nematoda. J Entomol Nematol.
Mao, X, Li, H and Long, M, et al. (2005) Effects of bacteria-
feeding nematode at its different density on bacterial
number, bacterial activity and soil nitrogen
mineralization. Chin. J. Appl. Ecol. 6: 1112-1116.
Parkinson, J, Mitreva, M and Whitton, C, et al. (2004) A
transcriptomic analysis of the phylum nematoda. Nat.
Genet. 36: 1259-1267.
Tang, Y S, Wei, C F and Yan, Y M, et al. (2007) Advances
in biomass indicators of soil quality. Soil. 39: 157-163.
Vessey, J K. (2003). Plant growth promoting rhizobacteria
as biofertilizers. Plant Soil. 255(2): 571-586.
Xiao, H F, Gen, L I and Da M, et al. (2014) Effect of
different bacterial-feeding nematode species on soil
bacterial numbers, activity, and community
composition. Pedosphere. 24: 116-124.
Changes of Eukaryotes Microorganism Structures in Soil during Continuous Cropping of Lettuce
489
