
Mechanism, Development and Comparison of Infrared and Raman
Spectra in the Pharmaceutical Diagnosis and Living Cell Detection
Mengying Cao
1,*,† a
and Haorong Xu
2,† b
1
School of Petrochemical Engineering, Liaoning Petrochemical University, Fushun, China
2
Hangzhou New Channel School, Hangzhou, China
†
These authors contributed equally
Keywords: Infrared Spectra, Raman Spectra, Pharmaceutical Diagnosis, Living Cell Detection, Mechanism.
Abstract: Nowadays, applications of new detection methods for pharmaceutical diagnosis and living cell detection
have attracted more and more attention. Among these detection methods, there is a large improvement in the
Raman spectroscopy, which leads to a wide range of applications in different fields. The infrared
spectroscopy is still act as a main and important techniques in the different areas. This research compares
the similarities and differences of these two technologies. At the same time, this research will concern about
the mechanism of Raman and infrared spectroscopy and their applications in some domains, especially in
the various disease and pharmaceutical fields. Applications of Raman spectroscopy for detection of living
cells is systematically analyzed, including detection mechanism and specific detection process. For
pharmaceutical diagnosis, the advantages and disadvantages of Raman spectroscopy are present in this
research. This research provides a new idea for the applications of Raman spectroscopy and infrared
spectroscopy in the field of disease detection.
1 INTRODUCTION
1
Raman spectroscopy is a vibrational spectroscopy
technique with “fingerprint” identification of
molecular composition and structure. It can
distinguish samples of various substances and also is
one of the main analytical techniques used in optical
metrology.
Raman spectroscopy is not interfered by aqueous
solvents. As a result, it can be used in biomedical
analysis better than traditional infrared spectroscopy.
Raman spectroscopy is a promising diagnostic tool
that can help uncover the molecular basis of diseases
and provide objective, quantifiable molecular
information for diagnosis and therapeutic evaluation.
Raman scattering occurs when the polarizability
changes during the interaction of light with
molecular vibration/rotation and molecular motion.
When light interacts with a molecule, it can be
excited to a transient virtual state, which
immediately returns to the vibrationally excited state
of the electron’s ground state. Due to this
a
https://orcid.org/0000-0002-2845-1677
b
https://orcid.org/0000-0001-6426-2358
interaction, a small amount of energy is transferred
or removed from the molecule, and the resulting
scattered light is red-shifted or blue-shifted, which
contains encoded vibrational molecular information.
This causes light to be scattered at the optical
frequency at which it moves on the incident light.
By monitoring the intensity distribution of inelastic
scattered light as a function of frequency, a unique
spectral fingerprint of tissue samples was obtained.
Because each sample has a unique composition,
spectral profiles generated by Raman active
functional groups of nucleic acids, proteins, lipids
and carbohydrates. Raman scattering in tissue
provides rich information about the vibrational
structure of proteins, gag, lipids and DNA.
The Raman spectrum is usually recorded in the
so-called fingerprint region, which contains
relatively weak but highly specific Raman peaks.
More recently, additional attention has been paid to
the use of the high wave-number region, which
contains less specific Raman bands but shows a
higher degree of signal intensity. An important
advantage of Raman spectroscopy is the low
intensity of the water wave segment, which makes
the analysis of biomaterials very difficult in infrared
540
Cao, M. and Xu, H.
Mechanism, Development and Comparison of Infrared and Raman Spectra in the Pharmaceutical Diagnosis and Living Cell Detection.
DOI: 10.5220/0011230700003443
In Proceedings of the 4th International Conference on Biomedical Engineering and Bioinformatics (ICBEB 2022), pages 540-546
ISBN: 978-989-758-595-1
Copyright
c
2022 by SCITEPRESS – Science and Technology Publications, Lda. All rights reserved

spectroscopy. However, Raman spectroscopy and
infrared spectroscopy are complementary, Raman
cannot replace infrared. It can complement each
other to provide more comprehensive and accurate
information about molecular vibration state and
molecular structure. But in some routine detection,
using Raman instead of infrared or using Raman as a
supplement to infrared, can improve the work
efficiency and detection speed. Many active
components in medicinal materials have different
pharmacological effects due to their different
functional groups and configurations. Raman
spectroscopy has certain advantages in structural
analysis and isomer identification of drug active
components due to its high selectivity and no need
for separation in mixture analysis.
Raman spectroscopy has powerful analytical
capability and can provide quantitative information
about chemical composition in biological samples. It
uses inelastic scattering of light to provide the
spectral characteristics of the internal structure and
conformation of the cell, thus reflecting the material
changes of the sample. In the process of tissue and
cytopathic disease, the structure, content and
conformation of each component in the cell will
change to varying degrees. It follows that it may
have a new role in the diagnosis of disease.
Raman spectroscopy can detect substance
changes in samples. And similarly, it can reflect
substance changes in the body caused by early
cancer. Cancer has been threatening people’s life
and health. In the context of an increasingly high
incidence of cancer worldwide, early diagnosis of
cancer is particularly important. There are numerous
lives behind the huge numbers in cancer reports.
Early detection, diagnosis and treatment will lead to
a greater chance of survival for patients. The Raman
spectrum of the tissue can be measured using a
microscope or custom optical fiber. In simple terms,
a single mode fiber is used to couple the laser to a
microscope and illuminate the sample with a
microscope objective. Confocal imaging based on
Raman spectrum can be achieved by using optical
fiber to collect backscattered light. A single optical
fiber acts as a pinhole to couple the light to a high-
throughput spectrometer, which is then dispersed to
a charge-coupled device (CCD) camera.
At present, the diagnosis of cancer mainly
depends on X-ray, CT examination, B ultrasound,
MRI examination and tumor marker detection. And
biopsy is still the best indicator of cancer
confirmation. Conventional imaging results can only
provide the basis for diagnosis, but they are not
sensitive and economical, and will bring great pain
to patients. By contrast, Raman spectroscopy has
high chemical specificity and can obtain abundant
molecular information without staining or labeling
the specimen. Raman spectroscopy, as a non-
invasive means of detection, can directly detect
biological samples, which is not only more sensitive,
but also relieves the pain and economic burden of
cancer patients.
Raman, an Indian physicist, irradiated benzene
liquid with a mercury lamp in 1928 and discovered a
new radiation spectrum line: this is a new molecular
radiation, called Raman scattering. Raman won the
Nobel Prize in physics in 1930 for the discovery of
this new molecular radiation and many light
scattering research achievements. At the same time,
Landsberg and Mandelstad of the former Soviet
Union reported the discovery of a similar
phenomenon in quartz crystals, namely Raman
scattering caused by optical phonons, called merger
scattering.
Roquette and Cabens in France and Wood in the
US confirmed the results of Raman’s observational
study. Because the Raman effect is too weak, it is
difficult to observe and study the weak Raman
scattering signal, let alone measure and study the
higher order Raman scattering effect. And the
volume of the tested sample must be large enough,
colorless, no dust, no fluorescence and so on. By the
mid-1940s, the progress of infrared technology and
commercialization of Raman spectroscopy
applications declined.
After 1960, the appearance of ruby laser makes
the study of Raman scattering into a new period.
Because the laser has good monochromaticity,
strong directivity and high-power density, using it as
excitation light source greatly improves the
excitation efficiency. It is an ideal light source for
Raman spectroscopy. With the improvement of
detection technology and the reduction of the
requirements for tested samples, Raman
spectroscopy has been widely used in physics,
chemistry, medicine, industry and other fields.
In the mid-1970s, the appearance of laser Raman
probe brought the possibility of microanalysis. Since
the 1980s, Spex company of the United States and
Rrinshow company of the United Kingdom have
launched a confocal laser Raman spectrometer,
bitman probe, because of the use of notchfilter to
filter out the excitation light, so that stray light is
suppressed. It is not necessary to use double or even
triple monochromator, and only need to use a single
monochromator. The efficiency of the light source is
greatly improved, so that the power of the incident
Mechanism, Development and Comparison of Infrared and Raman Spectra in the Pharmaceutical Diagnosis and Living Cell Detection
541
light can be very low. And the sensitivity is greatly
improved.
2 CONVENTIONAL INFRARED
SPECTROSCOPY
Infrared spectrum is also called infrared absorption
spectrum. It is the characteristic absorption spectrum
curve generated by resonance absorption between
infrared photon and molecular vibration and rotation
quantized energy level.
2.1 Mechanism
In organic molecules, the atoms that form chemical
bonds or functional groups are in a state of constant
vibration at frequencies comparable to those of
infrared light. When organic molecules are irradiated
with infrared light, chemical bonds or functional
groups in the molecules can occur vibration
absorption. Different chemical bonds or functional
groups absorption frequency is different. It will be in
different positions in the infrared spectrum, so as to
obtain the information of what kind of chemical
bonds or functional groups in the molecule.
The infrared spectrum is usually divided into
three regions: near infrared region (0.75~2.5 μm),
middle infrared region (2.5~25 μm) and far infrared
region (25~1000 μm). Generally speaking, the near
infrared spectrum is produced by the double
frequency and combination frequency of molecules.
The mid-infrared spectrum belongs to the
fundamental frequency vibration spectrum of
molecules. Far infrared spectrum belongs to the
rotational spectrum of molecules and vibration
spectrum of some groups.
2.2 Development
In the 1960s, a linear relationship between the
content of substances and the absorption peaks of
several different wavelength points in the near
infrared region is demonstrated, which made this
technique widely used in the analysis of agricultural
products. In the middle and late 1960s, the classical
near infrared spectroscopy (NIR) was exposed to the
weakness of low sensitivity and poor anti-
interference. With the emergence of various new
analytical techniques, people ignored the application
of this technique in analytical testing.
The successful application of multiple correction
technology in spectral analysis in 1970s promoted the
promotion of near-infrared spectroscopy technology.
In the late 1980s, with the development of computer
technology, the digitization of analytical instruments
and stoichiometry have been fully developed. The
good results obtained by stoichiometry in solving
spectral information extraction and background
interference have led to the application of NIR
spectroscopy in various fields.
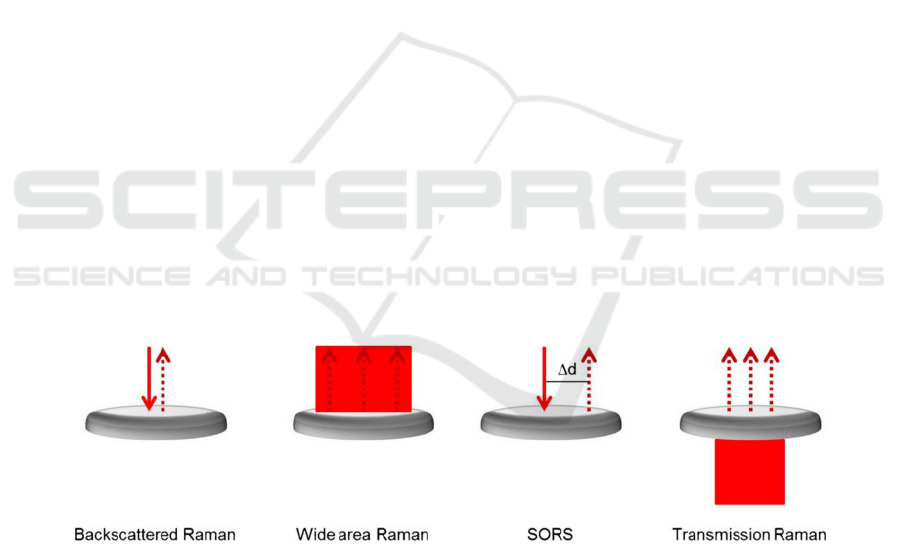
Figure 1: Schematic illustration Raman spectroscopy in measuring process.
In the 1990s, the application of NIR spectroscopy
in the industrial field expanded rapidly, and the
literature on the research and application of NIR
spectroscopy increased almost exponentially,
becoming one of the fastest developing and most
eye-catching analytical techniques. Because of its
good transmission characteristics in conventional
optical fibers, this technology is also applied in the
field of online analysis.
3 COMPARISON OF RAMAN
AND INFRARED SPECTRA
3.1 Similarities
For a given bond, the infrared absorption frequency
is equal to the Raman shift and represents the energy
of the first vibrational level. For a given compound,
ICBEB 2022 - The International Conference on Biomedical Engineering and Bioinformatics
542

the infrared absorption wave number and Raman
displacement of some peaks are exactly the same,
and both of them are in the infrared region, both of
which reflect the molecular structure information.
Raman spectroscopy, like infrared spectroscopy, is
also used to detect the vibration and rotational
energy levels of matter molecules.
The vibration which has symmetry relation with
the center of symmetry is invisible in infrared, but
visible in Raman. The vibration with no symmetry
relation to the center of symmetry is visible by
infrared, but not by Raman.
3.2 Differences
As shown in Figure 1, the incident light and
detection light of infrared spectrum are infrared
light, while the incident light of Raman spectrum is
mostly visible light, and the scattered light is also
visible light. Infrared spectroscopy measures
absorption of light, while Raman measures
scattering of light. When photons interact with
molecules, they do so through electric dipole
moment transitions.
Therefore, molecules that have no polarity or
symmetry, have essentially no infrared absorption
effect, because there is no electric dipole moment.
Raman spectrum is not absorption spectrum, but
after the incident photon resonates with the
molecular vibrational and rotational quantized
energy level, the photon emits at another frequency.
The energy difference between the incoming and
outgoing photons is equal to the vibrational and
rotational transition energy levels of the molecules
involved in the interaction.
Unlike infrared absorption spectroscopy, Raman
spectroscopy is a photon-molecular interaction of
higher order, which is much weaker than infrared
absorption spectroscopy. However, because the
mechanism of its generation is the electric
quadrupole moment or magnetic dipole moment
transition, it does not require the molecule itself to
have polarity, so it is particularly suitable for the
detection of those symmetric molecules without
polarity.
Infrared spectroscopy measures the absorption of
light, expressed by wave number or wavelength,
while Raman spectroscopy measures the scattering
of light, and the horizontal axis is Raman
displacement. Infrared spectroscopy mainly reflects
the functional groups of molecules while Raman
spectroscopy mainly reflects the framework of
molecules and is mainly used to analyze biological
macromolecules.
4 LIVING CELLS DETECTION
4.1 Mecahnism
Raman spectroscopy has powerful analytical
capability and can provide quantitative information
about chemical composition in biological samples. It
uses inelastic scattering of light to provide the
spectral characteristics of the internal structure and
conformation of the cell, thus reflecting the material
changes of the sample. When photons of
monochromatic beam interact with molecules,
elastic collision and inelastic collision can occur, as
shown in Figure 3.
In the inelastic scattering process, energy
exchange occurs between photon and molecule, and
photon loses part of energy due to scattering by
molecule, resulting in the change of photon
frequency. But the difference between the frequency
of the scattered light and the frequency of the
incident light does not change because the frequency
of the incident light changes. Among them, the
change in the frequency of light is collectively called
the Raman shift. Raman scattering light can carry
information of substance because it is affected by its
structure.
According to the Boltzmann distribution law,
due to thermal equilibrium, the number of molecules
in the second highest energy level is always smaller
than the number of molecules in the lower energy
level, so the intensity of stokes Raman scattering
light is always greater than the intensity of anti-
Stokes Raman scattering light.
The Raman displacement of material is
independent of the incident light frequency, but
related to the vibration and rotational energy level
structure of the molecule, which are inherent
characteristics of the molecule. Therefore, any
substance with Raman activity has its own specific
Raman shift. If it wants to identify a substance, it
just measures it and find out its characteristic Raman
spectrum.
4.2 Detection of Living Cells
When the sample is irradiated by a certain frequency
of laser beam, it will emit Raman scattering of light,
which provides a lot of molecular information.
Through the interpretation of Raman spectrum, the
molecular type, spatial structure, chemical bond and
other information can be obtained. Microscopic
Raman spectroscopy technology can provide Raman
spectra of complete living cells, from which the
structure and changes of several major biological
Mechanism, Development and Comparison of Infrared and Raman Spectra in the Pharmaceutical Diagnosis and Living Cell Detection
543
macromolecules in complete living cells, such as
proteins, DNA, lipids and carbohydrates. The
traditional measurement of Raman spectrum is
divided into point scanning and line scanning.
Figure 2: The Raman shift under different experimental conditions.
Point-to-point scanning imaging involves
focusing a laser into a point, moving the sample
under the laser with an automatic sample stand, and
sequentially collecting Raman spectra through an
array of points across the designated area of interest
on the sample. Linear focusing scanning imaging is
similar to point-to-point scanning imaging. The
difference is to shine a laser on a line rather than a
point on the sample. This method can collect spectra
simultaneously from multiple locations on the
sample, and can use more laser power, but reduces
the exposure time and does not damage the sample.
Proteins are the main components of cells and
the material basis of many cell functions, such as
cell catalytic reaction, material transport, immune
function, genetics and metabolism. Raman
spectroscopy can not only provide the structural
characteristics of amino acids, but also be used for
quantitative analysis of secondary structure of
proteins. As shown Figure 2, an obvious Raman
shift can be observed when some chemical reactions
occur.
Lipids are an important part of cell membranes.
Raman spectroscopy can be used to study the
composition of cell membrane, the location of lipids
in various states and their interactions with various
ions. Elucidating the composition and spatial
structure of lipid membranes in living cells can be
applied in many fields such as membrane
pathophysiology and membrane pathophysiology.
The following is a microscopic Raman analysis
for the lipidomes of individual organelles. There are
hundreds of thousands of chemically different lipids.
Although they usually show only minor differences
in chemical structure, they tend to block chemically
selective probes from labeling specific lipids.
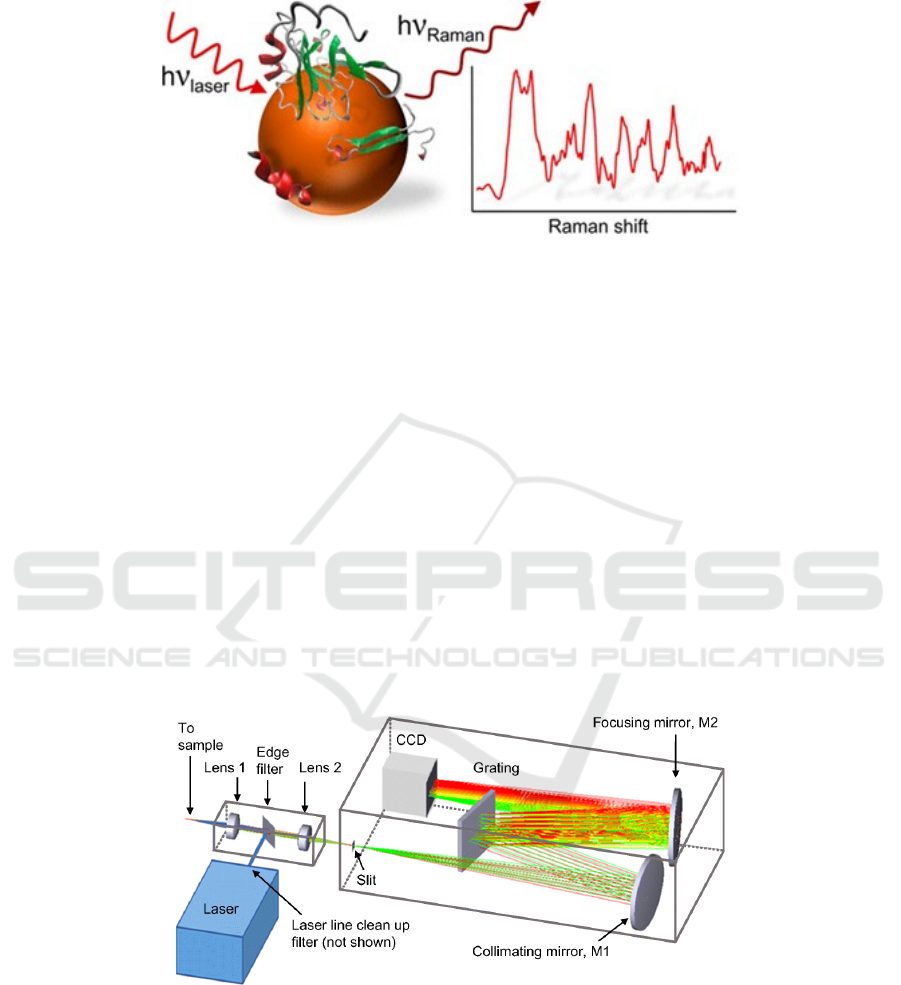
Figure 3: The used Raman spectrometer in laboratory.
4.3 Use of Raman Spectra
Raman spectrometers have evolved from ordinary
academic laboratory instruments to powerful
commercial solution-based systems. Update
instruments are easy to use because they do not
require the user to constantly adjust or have complex
optical knowledge, and interact with the Raman
spectrum library.
At present, there are two main methods to
analyze Raman data: univariate and multivariate.
The first approach uses the area, intensity, or center
of gravity characteristics of the Raman spectrum to
understand sample chemistry. Figure 4 shows the
ICBEB 2022 - The International Conference on Biomedical Engineering and Bioinformatics
544
basic composition of Raman spectrometer. Although
univariate data analysis can be used directly, it
requires that the components have sufficient Raman
bands to distinguish and be unique. Overlapping
bands in biological and pharmaceutical area make
multivariate data analysis techniques necessary.
High resolution system that enables rapid
measurement and is suitable for in vivo clinical
applications, and it is often used in detecting living
tissue such as tumor.
Figure 4: The typical Raman spectrometer.
5 RAMN SPECTRA IN
PHARMACEUTICAL
DIAGNOSIS
The wide origin, variety and complexity of Chinese
medicinal materials bring many difficulties to the
inspection and management of Chinese medicinal
materials. In recent years, rapid and nondestructive
identification of Chinese medicinal materials by
Raman spectroscopy has attracted more attention. By
using Raman spectroscopy, 12 different habitats and
different planting modes and different collecting time
of traditional Chinese medicine radix scutellariae are
analyzed. The results show that the characteristic
peak frequency and intensity of Raman spectroscopy
to identify different ways of planting of radix
scutellariae samples than traditional method. This is
more direct, fast, and do not destroy samples, more
accurate science. Many active components in
Chinese medicinal materials have different
pharmacological effects due to their different
functional groups and configurations. Raman
spectroscopy has been widely used in the structural
analysis and isomer identification of traditional
Chinese medicine (TCM) due to its strong selectivity
and the absence of separation in mixture analysis.
With the appearance of portable Raman
spectrometer, drug regulatory departments have
considered it as an important tool for drug
counterfeiting. According to the existing literature,
Raman spectroscopy is quick and can significantly
improve the efficiency of drug market regulation.
Raman spectrum can give fingerprint information
about compound structure, and can distinguish some
pharmaceutical excipients by Raman band, which has
certain advantages over infrared spectrum in some
aspects. It can be used for quality control of
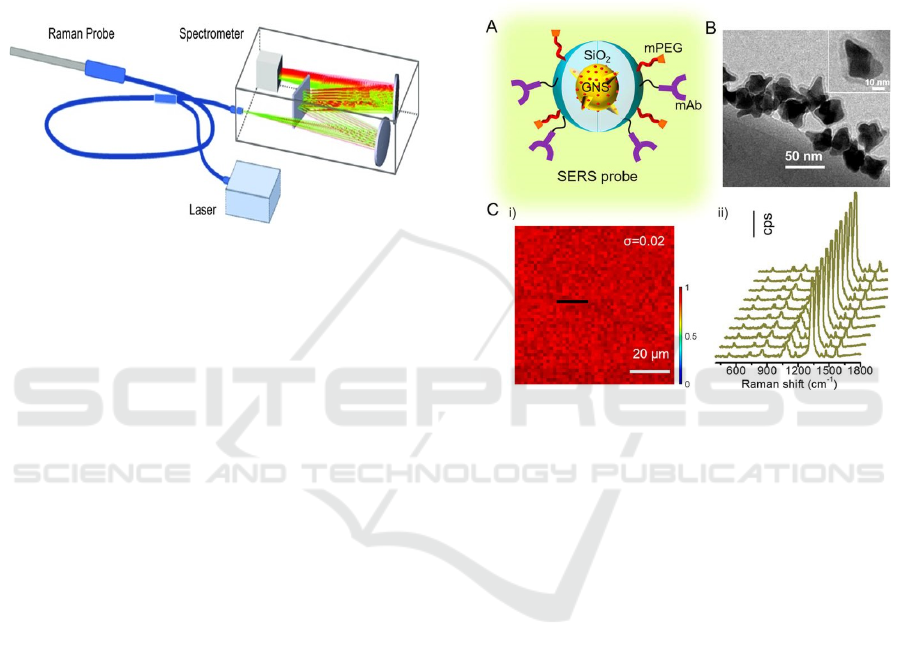
pharmaceutical excipients. The characterization and
structure of these probes is shown in the Figure 5.
Figure 5: Structure and characterization of SERS probes
6 CONCLUSIONS
This paper shows the comparison between infrared
and Raman spectra. And application of Raman
spectroscopy for the pharmaceutical diagnosis and
living cell detection is also analyzed. Raman
spectroscopy has broad prospects in cell sorting and
nondestructive detection of cancer detection.
However, Raman spectroscopy usually has weak
signal. If the general fluorescence signal is stronger
than Raman signal, the fluorescence summit is
superimposed on Raman peak, and its interference to
signal judgment is relatively large. Fortunately,
methods to remove strong fluorescence background
to solve the influence of fluorescence background on
the extraction of Raman spectral components have
been developed.
REFERENCES
Aneta Saletnik, Bogdan Saletnik and Czesław Puchalski
(2021), Overview of Popular Techniques of Raman
Mechanism, Development and Comparison of Infrared and Raman Spectra in the Pharmaceutical Diagnosis and Living Cell Detection
545

Spectroscopy and Their Potential in the Study of Plant
Tissues, Molecules, vol. 26, pp. 1537.
Adrian Lita, Andrey N. Kuzmin, Artem Pliss, Alexander
Baev, Alexander Rzhevskii, Mark R. Gilbert, Mioara
Larion and Paras N. Prasad (2019), Toward Single-
Organelle Lipidomics in Live Cells, Anal. Chem., vol.
91, pp. 11380-11387.
Anna Chiara De Luca, Kishan Dholakia and Michael
Mazilu (2015), Modulated Raman Spectroscopy for
Enhanced Cancer Diagnosis at the Cellular Level,
Sensors (Basel), vol. 15, pp. 13680-13704.
Deng S, Liu L, Liu Z, Shen Z, Li G, He Y (2012), Line-
scanning Raman imaging spectroscopy for detection
of fingerprints, Appl. Opt., vol. 51, pp.3701-6.
Gergo Peter Szekeres, Maria Montes-Bayón, Jörg
Bettmer, and Janina Kneipp (2020), Fragmentation of
Proteins in the Corona of Gold Nanoparticles as
Observed in Live Cell Surface-Enhanced Raman
Scattering, Anal. Chem., vol. 92, pp. 8553-8560.
Gregory W. Auner, corresponding author, S. Kiran Koya,
Changhe Huang, Brandy Broadbent, Micaela Trexler,
Zachary Auner, Angela Elias, Katlyn Curtin Mehne,
and Michelle A. Brusatori (2018), Applications of
Raman spectroscopy in cancer diagnosis,” Cancer
Metastasis Rev., vol. 37, pp. 691-717.
Jeremy D Driskell, Oliva M Primera-Pedrozo, Richard A
Dluhy, Yiping Zhao, Ralph A Tripp (2009),
Quantitative surface-enhanced Raman spectroscopy
based analysis of microRNA mixtures, Appl.
Spectrosc, vol. 63, pp. 1107-14.
Karen A. Esmonde-White, Maryann Cuellar, Carsten
Uerpmann, Bruno Lenain and Ian R. Lewis (2016),
Raman spectroscopy as a process analytical
technology for pharmaceutical manufacturing and
bioprocessing, Anal. Bioanal. Chem., vol. 409, pp.
637-649.
Ming Li, Santosh Kumar Paidi, Eric Sakowski, Sarah
Preheim, and Ishan Barman (2019), Ultrasensitive
Detection of Hepatotoxic Microcystin Production from
Cyanobacteria Using Surface-Enhanced Raman
Scattering (SERS) Immunosensor, ACS Sens., vol. 4,
pp. 1203-1210.
Paul T. Winnard, Jr, Chi Zhang, Farhad Vesuna, Jeon
Woong Kang, Jonah Garry, Ramachandra Rao Dasari,
Ishan Barmanand Venu Raman (2017), Organ-specific
isogenic metastatic breast cancer cell lines exhibit
distinct Raman spectral signatures and metabolomes,
Oncotarget, vol. 8, pp. 20266-20287.
ICBEB 2022 - The International Conference on Biomedical Engineering and Bioinformatics
546
