
Multitudinous Data Platform for Community Big Data
S. Junrat, J. Nopparat, M. Manopiroonporn, W. Suntiamorntut and S. Charoenpanyasak
Department of Computer Engineering, Prince of Songkla University, Songkhla, Thailand
Keywords: Big Data, Diversity Data, Data Platform, Data Collection, Data Analytics
Abstract: A city's data is diversified. Many types of data are available, including time series data from various sensors,
event data from human input (text, number, date, location, photos, and so on). Those data need a platform that
can collect data of a city comprehensively and support querying to analyze data conveniently. We designed
and developed a platform that support to automatically construct a variety of data structures by designing a
collection of questions that can be used to collect various categories of data sets in each city flexibly.
It can
be applied to solve problems and develop a city pertinently.
1 INTRODUCTION
Each area of a country such as a city, a sub-district, a
district, or a province. There are a variety of
environments and local knowledge that may be
different or similar to some areas. Many elements
influence it, including geography, climate, water
resources, way of life, culture, traditions, people’s
expertise, indigenous knowledge, and so on.
Designing a method to collect all of those different
types of data and analyze them in various dimensions
together is challenging while different forms of each
city’s data are becoming increasingly massive. There
is a greater variety of contexts of interest as well (Ku
& Gil-Garcia, 2018).
Data can be many types such as text, number,
date, location, and images (Dinh et al., 2020). Data
can be collected and created via appropriate forms to
serve various requirements pertinently in each area
and stored each data type appropriately for later
retrieval and analysis according to the time of interest
(Halevy et al., 2016). Therefore, we designed a
platform to collect a wide variety of data. The
platform can create multiple question sets as required
of each area. Explorers in each area can input to
collect local information into the platform. City
administrator, government, researcher, engineer, data
scientist can access useful information to solve
problems in each area such as disaster and risk
management (Munawar et al., 2020), reflect the needs
and expectations of its people in London via The Talk
London Platform (Vodák et al., 2021).
The platform that we designed and developed can
store data flexibly and cover diversity of data.
Information that is properly stored can be used to
analyze data to manage and plan the development of
areas and countries.
2 DATA PLATFORM
ARCHITECTURE
A platform that can gather a wide range of local data
from many cities in a flexible and comprehensive. It
must be developed begin with data structure
designing to collect many data categories that is
relevant to each area. The platform helps to validate
and verify the accuracy of data before store to
databases. It makes those data can be utilized in all
parts. Therefore, we designed data platform
architecture as shown in Figure 1.
Figure 1: Data Platform Architecture.
From Figure 1, data structures are managed
through the Management Console which are
communicated via Management API. It will be
verified through the Authentication part before
328
Junrat, S., Nopparat, J., Manopiroonporn, M., Suntiamorntut, W. and Charoenpanyasak, S.
Multitudinous Data Platform for Community Big Data.
DOI: 10.5220/0011269400003269
In Proceedings of the 11th International Conference on Data Science, Technology and Applications (DATA 2022), pages 328-336
ISBN: 978-989-758-583-8; ISSN: 2184-285X
Copyright
c
2022 by SCITEPRESS – Science and Technology Publications, Lda. All rights reserved
accessing the authorized data. Then, the structure of
each category is retrieved that can be managed
through the Data Collection Schema, which is where
the structure of each data group is stored. There will
be an exchange of information between the Data
Document Storage (collect raw data), the BLOB
Storage (collect files) (Saif & Wazir, 2018), and the
Search & Analytics Engine (collect data schema for
searching especially). Then, the platform will send
data that permitted users can access to display on the
Management Console.
Recording data obtained from surveying the area
via User App, which receives and sends data via the
Application API and is verified through the
Authentication. Before accessing the information in
the platform. If logging in successfully then the
platform will retrieve the data from the Data
Collection Schema, which is the part that stores the
structure of each data category. The platform will
then send the user-accessible data back to the User
App.
Searching for the required data to display on the
dashboard is done through the Analytics API, which
is interconnected with the Search & Analytics Engine
(create data structure and collect data for search usage
especially) and Data Collection Schema. When all the
required data have been queried then send those data
back to the Dashboard.
3 THE MAIN WORKING
PROCESS OF THE PLATFORM
We have sequenced the steps of the important work
processes. Each process has been made into a
sequence diagram to visualize the workflow more
easily. The process to be described here consists of
category schema creation, data submission, data
deletion, data modification, and data searching and
retrieval.
3.1 Category Schema Creation
The structure of the data in each category is
essentially defined or set by the experts in each field
of knowledge. To obtain an appropriate structure for
surveying and recording data in each area; where
experts can create data categories through the
category management system (Management
Console), which we have designed and implemented
steps to create data categories (Category Schema
Creation) as follows:
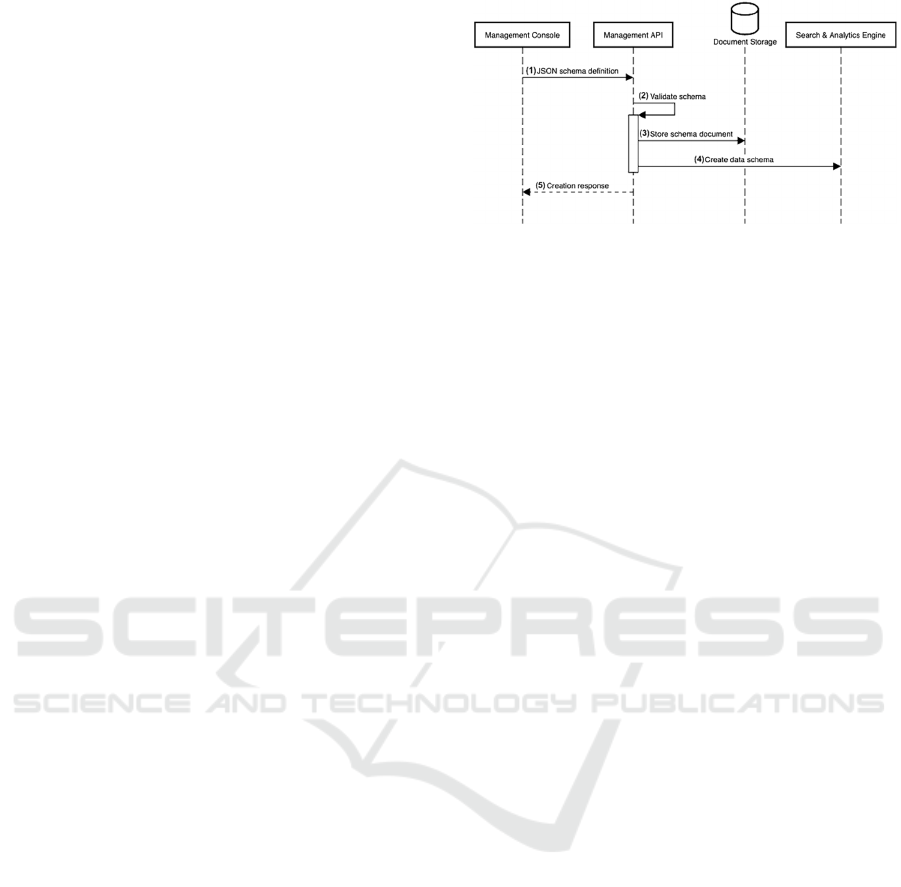
Figure 2: Category Schema Creation.
The structure of data in each category is determined
by the experts in each field of knowledge. In order to
obtain an appropriate structure for surveying and
recording data in each area; where experts can create
data categories through the category management
system (Management Console), which the research
team has designed and Develop steps to create data
categories (Category Schema Creation) as shown in
Figure 2, which has the following steps:
(1) User who is administrator or data structure
creator start to create data structure via
Management Console. The data structure is
created in JSON format (JSON Schema
Definition) (Bourhis et al., 2020). Then the
data structure is sent to Management API.
JSON Schema Definition will be explained
further in
the section.
(2) When Management API has received the data
structure, the next step is validated data
schema.
(3) If the data schema correctly, then store it to the
Document Storage.
(4) Then create data schema for searching
particularly and send it to Search & Analytics
Engine.
(5) The next step, send the result to Management
Console to confirm when save the data
schemas successfully.
3.2 Data Submission
Once the data category has been created, user can add
information of interested categories through the User
App. The process of data submission is shown in
Figure 3.
Multitudinous Data Platform for Community Big Data
329
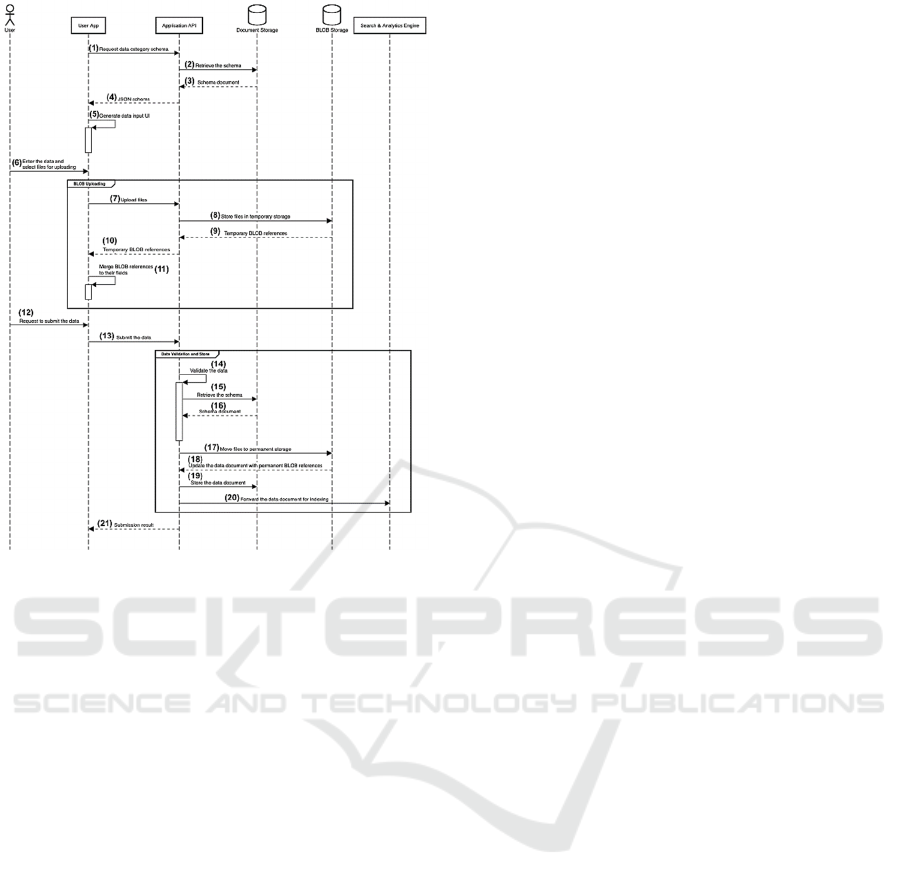
Figure 3: Data Submission.
From Figure 3 shown a diagram of the procedure for
data submission with the following steps:
(1) User who is recorder
the surveyed data request
desired data category schema via User App.
Then the request is sent to Application API.
(2) Then Application API get the data category
schema from Document Storage.
(3) When Document Storage found the data
category schema, then send the schema
document back to Application API.
(4) Then Application API send the schema
document in JSON format (JSON schema)
back to User App.
(5) The next step, User App generate data input
UI (data form for filling
out) from the JSON
schema obtained.
(6) User starts to input data and upload files
.
(7) If user uploaded files, then User App send the
files to Application API.
(8) The next step, Application API send the files
to temporary storage which inside BLOB
Storage part.
(9) Then BLOB Storage send temporary BLOB
references to Application API.
(10) The next step, Application API send
temporary BLOB references back to User
App.
(11) Then User App store the BLOB references
temporality.
(12) When the files is uploaded already and user fill
the data form completely, then user send
request to submit the data via User App.
(13) Then User App send the data to Application
API.
(14) The next step, Application API validate data.
(15) If the data correctly, then Application API
retrieve the data schema from Document
Storage.
(16) The next step, Document Storage send the
schema document to Application API.
(17) Then Application API move the files to
permanent storage.
(18) The next step, BLOB Storage update the data
document with permanent BLOB references
to Application API.
(19) Then Application API store the data document
to Document Storage.
(20) The next step, Application API forward the
data document for indexing to Search &
Analytics Engine.
(21) When save the data completely, then
Application API send the result back to User
App.
3.3 Data Deletion
Once the information in the category of interest has
been added to the User App successfully. If filling out
mistake and want to delete that data. The User App
has a process to delete (Data Deletion) as shown in
Figure 4.
DATA 2022 - 11th International Conference on Data Science, Technology and Applications
330
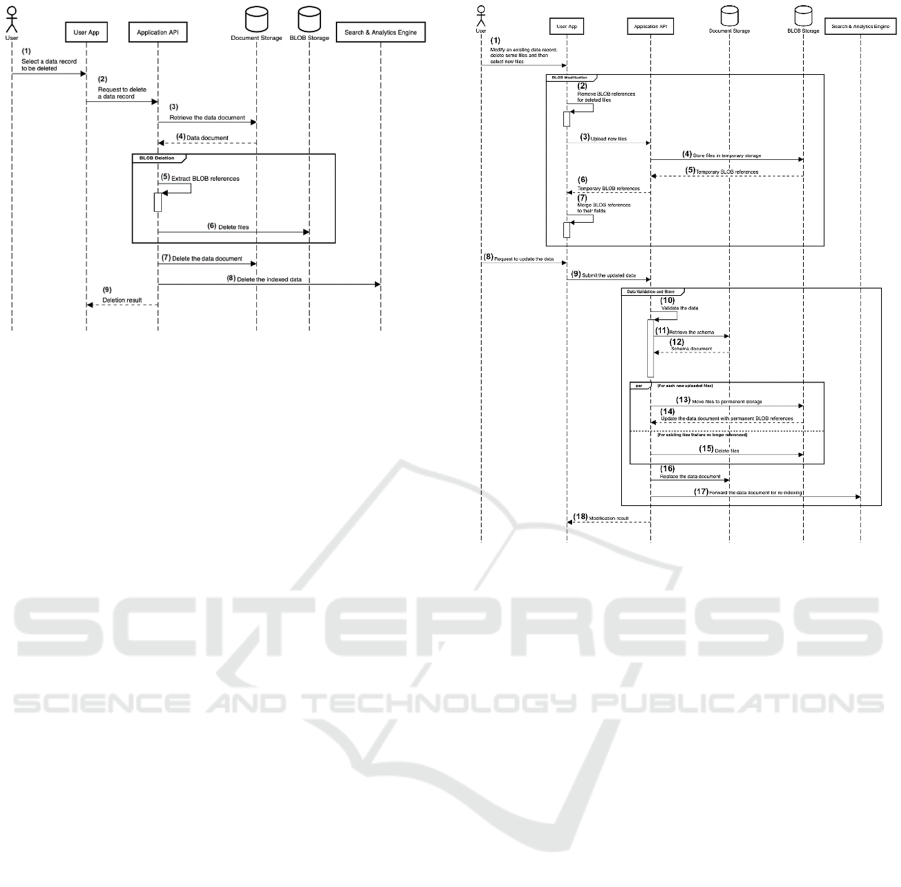
Figure 4: Data Deletion.
From Figure 4 shown a diagram of the procedure for
data deletion with the following steps:
(1) User can select a data record to be deleted via
User App.
(2) Then User App send the request to delete a
data record to Application API.
(3) In the next step, Application API retrieve the
data document from Document Storage.
(4) Then Document Storage send data document
back to Application API.
(5) After that, Application API extract BLOB
references.
(6) Then Application API delete files from BLOB
storage.
(7) The next step, Application API delete the data
document from document storage.
(8) Then Application API delete the indexed data
from Search & Analytics Engine.
(9) After that, Application API send the result
back to User App.
3.4 Data Modification
Once the information in the category of interest has
been added to the User App successfully. If you want
to modify some data, the User App has a process of
modifying the desired data list (Data Modification),
as shown in Figure 5.
Figure 5: Data Modification.
From Figure 5 shown a diagram of the data
modification with the following steps:
(1) User modify an existing data record including
delete some files and select new files via User
App.
(2) Then User App remove BLOB references for
deleted files.
(3) After that, User App upload new files to
Application API.
(4) Then Application API store files in temporary
storage that is a part of BLOB Storage.
(5) In the next step, BLOB Storage send
temporary BLOB references back to
Application API.
(6) Then Application API send the temporary
BLOB references to User App.
(7) After that, User App keep BLOB references
temporality.
(8) When the files are uploaded and fill out the
data completely, user send update the data via
User App.
Multitudinous Data Platform for Community Big Data
331
(9) Then User App send update request to
Application API.
(10) In the next step, Application API validate the
data.
(11) When Application API validate completely,
then retrieve the schema from Document
Storage.
(12) Then Document Storage send the schema
document back to Application API.
(13) After that, Application API move files to
permanent storage in BLOB Storage.
(14) Then BLOB Storage send the data document
with permanent BLOB references back to
Application API.
(15) In the next step, Application API delete files
in BLOB Storage.
(16) Then Application API replace the data
document in Document Storage.
(17) After that, Application API forward the data
document for re-indexing in Search &
Analytics Engine.
(18) When update a data record completely,
Application API send the modification result
back to User App.
3.5 Data Searching and Retrieval
When data is stored in each category already. To
browse history or search for the desired information.
We have designed a data searching and retrieval
process to query the results that meet the needs of the
users. The below process is shown in Figure 6.
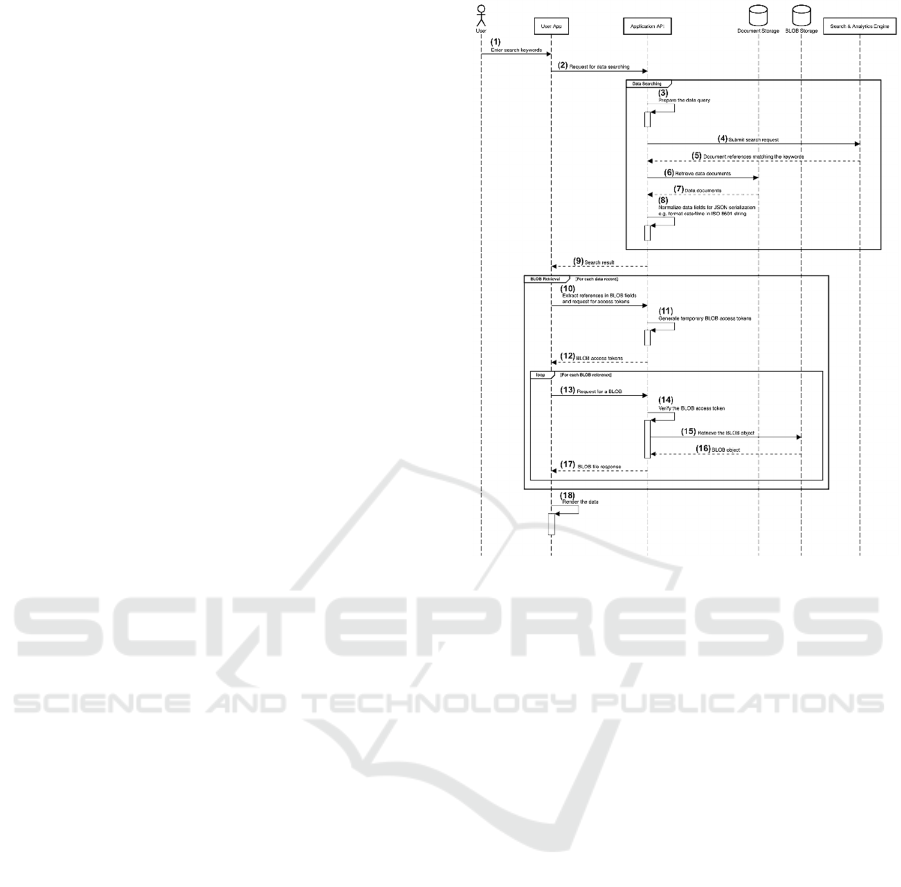
From Figure 6 shown a diagram of the data
searching and retrieval with the following steps:
(1) User enters search keywords via User App.
(2) Then User App send the request to Application
API.
(3) After that, Application API prepare the data
query.
(4) Then Application API submit search request
to Search & Analytics Engine.
(5) In the next step, Search & Analytics Engine
send document references that matching the
keywords to Application API.
(6) Then Application API retrieve data documents
from Document Storage.
Figure 6: Data Searching and Retrieval.
(7) After that, Document Storage send data
documents back to Application API.
(8) Then Application API normalize data fields
for JSON serialization e.g., format date/time
in ISO 8601 string.
(9) Then Application API send the search result to
User App.
(10) In the next step, User App extract references
in BLOB fields and send request for BLOB
access tokens to Application API.
(11) Then Application API generate temporary
BLOB access tokens.
(12) After that, Application API send BLOB access
tokens back to User App.
(13) Then User App request for a BLOB to
Application API.
(14) After that, Application API verify the BLOB
access tokens
(15) Then Application API retrieve the BLOB
object from BLOB Storage.
(16) In the next step, the BLOB object is sent from
BLOB Storage to Application API.
DATA 2022 - 11th International Conference on Data Science, Technology and Applications
332

(17) Then Application API send a BLOB file
response to User App
(18) Then User App render the data.
4 JSON SCHEMA DEFINITION
Data schema that is consistently optimized, as well as
the ability to grow up in the future. It is critical and
necessary. Because of the requirement to
accommodate the increasing diversity of data that will
be introduced in the future. To make the management,
insertion, and alteration of this wide range of data
easier. As a result, we created a data storage structure
that includes the components depicted in Figure 7.
Figure 7: JSON Schema Definition.
From Figure 7 shown data schema in JSON schema
definition. There are main components in consist of
CategorySchema, DataSection, DataItem, and
DataFieldSpec which we are going to explain detail in the
next step.
4.1 CategorySchema
The CategorySchema is used for category creation for
store new data category which has five fields below.
category is used to store category id.
version is used for specifying data category
version.
createdAt is used for specifying created
datetime of data category.
updatedAt is used for specifying updated
datetime of data category.
sections are used to collect list of DataSection.
4.2 DataSection
The DataSection has four fields below.
title is used to store name of data section.
description is used to store explanation
concisely.
metadata is used to collect addition
information.
items are used to collect list of DataItem.
4.3 DataItem
The DataItem has five fields below.
id is used
title is used to store name of data item.
description is used to store explanation
concisely.
metadata is used to collect addition
information.
data is used to store DataFieldSpec.
4.4 DataFieldSpec
The DataFieldSpec is used to store type of data. In
addition, it is also used to validate data that currently
is designed to support eleven types. Types of data as
follows.
Text field is used to store text data.
Number field is used to store numeric data.
Data field is used to store date.
Time field is used to store time.
Date and time field is used to store date and
time.
Geo point field is used to store latitude and
longitude.
Address field is used to store address.
Drop down field is used to store one selected
data in the form of drop-down input.
Radio field is used to store one selected data in
the form of radio button.
Check boxes field is used to select one or more
from list of data.
File field is used to store files such as image,
pdf, and so on.
5 DEVELOPMENT TOOLS
From Figure 1 shown the data platform architecture
which each component has a function as described in
2 data platform architecture section. The main
Multitudinous Data Platform for Community Big Data
333
components are the tools used in the development as
follows.
5.1 Application API and Management
API
In this part, we used serverless cloud architecture in
order not to leave the server open all the time and can
run when User App or Management Console requests
it. Therefore, we have opted for Google Cloud
Functions (Malawski et al., 2020) that is a service can
charges on a per-user request basis and automatically
supports resource scaling. In addition to the Google
Cloud Functions, you can choose to use a similar
service from Amazon Web Services (Saif & Wazir,
2018) by using a service called AWS Lambda
(Malawski et al., 2020) or similar services from other
providers.
5.2 Data Collection and Data
Document Storage
In this part, we have designed for data storing in
document based (NoSQL) (Diogo et al., 2019) format
because we want to store data flexibility and want to
use the features of serverless (Yu et al., 2020). It is no
need to rent a server. Hence, we chose Google
Firebase Firestore (Crisgar et al., 2021) which meets
the requirements and charges according to usage and
can supports concurrent connection up to million
requests concurrently.
5.3 BLOB Storage
In this part, we have designed to store files flexibility
and can expand the storage space automatically. It
should be charged based on storage and actual data
requests. We want to use the serverless features.
Hence, we chose the Google Cloud Storage
(Malawski et al., 2020) that meet the requirements.
Besides Google Cloud Storage, you can choose a
similar service from Amazon Web Services called
AWS S3 (Jonas et al., 2019).
5.4 Search and Analytics Engine
In this part, we have designed to store data in a format
that suitable for data searching specifically. It must
support horizontal expansion and full-text search
which the features can help to fine the desired data
quickly and efficiently. Therefore, we chose
Elasticsearch (Zamfir et al., 2019) that meet the
requirements.
5.5 Implementation Results
We apply visualization tools such as Kibana (Shah et
al., 2022), Grafana (Chakraborty & Kundan, 2021),
and Power BI (Bhargava et al., 2018) to clearly
display useful facts from each city's data.
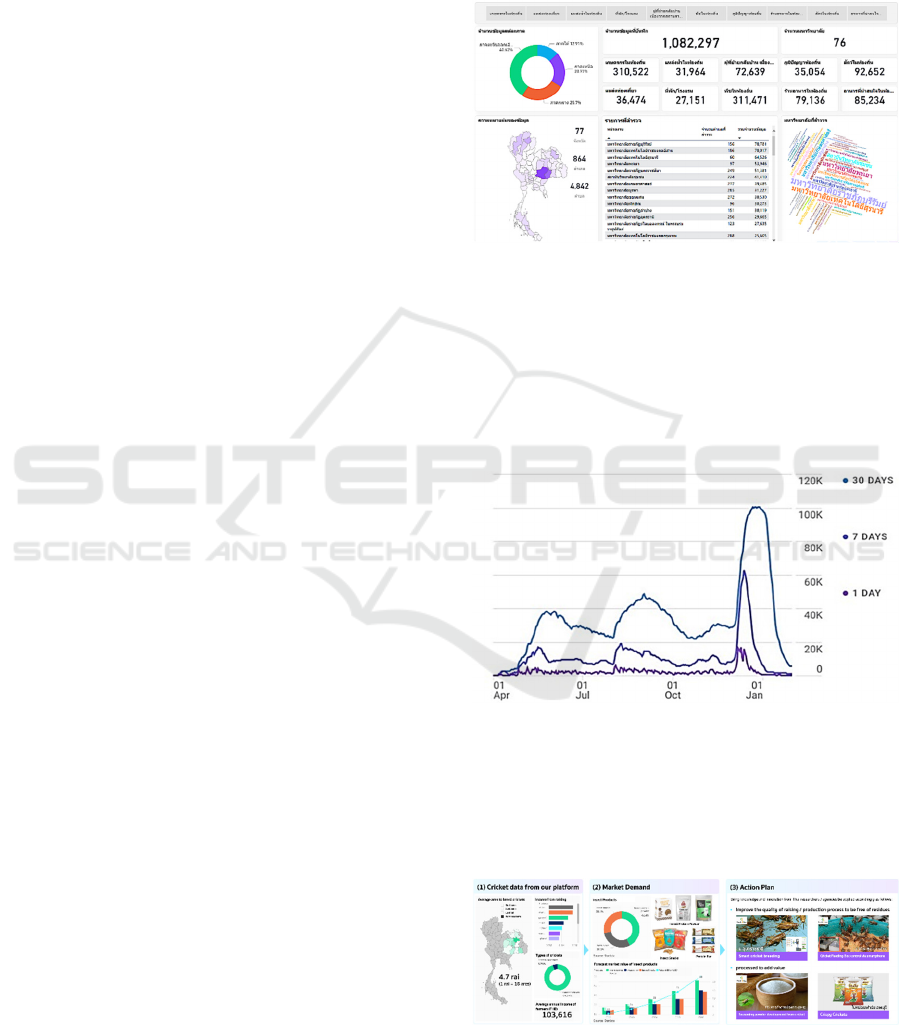
Figure 8: Visualization.
From Figure 8 shown number of each data category
that all explorers have collected more than one
million records from various locations in Thailand.
City administrators can access these data and analyze
more in depth to see the issues that each community
is experiencing. Included are strengths or identities
that should be emphasized or encouraged.
Figure 9: User activity over time.
From Figure 9 shown the number of users who record
survey data from around the assigned area
over the nine
months period. Maximum users more than 100K per month.
The platform can handle and scale when facing a
lot of concurrent users
Figure 10: Data Analysis and Utilization.
DATA 2022 - 11th International Conference on Data Science, Technology and Applications
334

From Figure 10 is divided into three parts:
(1) First part is cricket data from our platform
which is collected by each city explorer.
According to the data, the northeastern region
has a large number of cricket raisings in
Thailand. Nong Khai, Sakon Nakhon, and
Udon Thani are the top three provinces for
cricket farming. Cricket farming covers
approximately 4.7 rai (1 rai = 16 acres).
Cricket farmers make an annual average of
103, 616 bath.
(2) Second part is market demand data from other
sources for analysis together to make the
information visible from a variety of
perspectives. From the proportion of insect
products in U.S. for the year 2019-2023 found
that approximately 28.4% were made into
snacks, 29.2% were made into protein bars,
and 42.4% were made into protein powders.
Forecast market value in the U.S. has
consistently increased. The value of insect
products is expected to reach 34 million
dollars in 2022, and even more in 2023 which
be cost roughly 50 million dollars (Edible
Insects, n.d.). According to the information,
market demand value can help city leaders to
analyze the direction of supporting and
promoting cricket cultivation and processing
in order to meet worldwide demand.
(3) Third part is
action plan. According to the
surveyed data combined with market demand
data from different sources.
When analyzed
together, these produce guidelines for
development and promotion by bringing
knowledge, innovation, and research of
Thailand (Tech2biz, n.d.)
from both
government and private agencies to promote
modern and standardized cricket farming. To
reach a diverse group of customers, it aids in
the generation of income for farmers and
communities, which results in better economic
development of the country in the present and
the future.
6 CONCLUSIONS
A variety of data of each area should be collected
using the platform to validate the information's
accuracy which support data expansion, processing
and analyze information for decision-making. As a
result, city administrators, researchers, data scientists,
and entrepreneurs can gain access to community data
and use it to address problems or build communities
that represent each city's distinct personality. The
platform can continuously provide data. It has the
ability to build a high-quality society that is both
present and forward-looking.
ACKNOWLEDGEMENT
This paper is funded by PSU FF funding, 2021 under
the project title ‘Quality data platform and Tambol-
ERP’. The authors would like to thank you for these
supports.
REFERENCES
Bhargava, M. G., Kiran, K. T. P. S., & Rao, D. R. (2018).
Analysis and Design of Visualization of Educational
Institution database using Power BI Tool. Global
Journal of Computer Science and Technology.
https://computerresearch.org/index.php/computer/artic
le/view/1776
Bourhis, P., Reutter, J. L., & Vrgoč, D. (2020). JSON: Data
model and query languages. Information Systems, 89,
101478. https://doi.org/10.1016/j.is.2019.101478
Chakraborty, M., & Kundan, A. P. (2021). Grafana. In M.
Chakraborty & A. P. Kundan (Eds.), Monitoring Cloud-
Native Applications: Lead Agile Operations
Confidently Using Open Source Software (pp. 187–
240). Apress. https://doi.org/10.1007/978-1-4842-
6888-9_6
Crisgar, P. V., Wijaya, P. R., Pakpahan, M. D. F.,
Syamsuddin, E. Y., & Hasanuddin, M. O. (2021). GPS-
Based Vehicle Tracking and Theft Detection Systems
using Google Cloud IoT Core amp; Firebase. 2021
International Symposium on Electronics and Smart
Devices (ISESD), 1–6. https://doi.org/10.1109/
ISESD53023.2021.9501928
Dinh, L. T. N., Karmakar, G., & Kamruzzaman, J. (2020).
A survey on context awareness in big data analytics for
business applications. Knowledge and Information
Systems, 62(9), 3387–3415. https://doi.org/10.10
07/s10115-020-01462-3
Diogo, M., Cabral, B., & Bernardino, J. (2019).
Consistency Models of NoSQL Databases. Future
Internet, 11(2), 43. https://doi.org/10.3390/fi11020043
Edible insects: Market value by category in the U.S. 2015-
2023. (n.d.). Statista. Retrieved May 10, 2022, from
https://www.statista.com/statistics/883474/edible-
insects-market-value-by-category/
Halevy, A., Korn, F., Noy, N. F., Olston, C., Polyzotis, N.,
Roy, S., & Whang, S. E. (2016). Goods: Organizing
Google’s Datasets. Proceedings of the 2016
International Conference on Management of Data,
795–806. https://doi.org/10.1145/2882903.2903730
Multitudinous Data Platform for Community Big Data
335

Jonas, E., Schleier-Smith, J., Sreekanti, V., Tsai, C.-C.,
Khandelwal, A., Pu, Q., Shankar, V., Carreira, J.,
Krauth, K., Yadwadkar, N., Gonzalez, J. E., Popa, R.
A., Stoica, I., & Patterson, D. A. (2019). Cloud
Programming Simplified: A Berkeley View on
Serverless Computing. ArXiv:1902.03383 [Cs].
http://arxiv.org/abs/1902.03383
Ku, M., & Gil-Garcia, J. R. (2018). Ready for data
analytics?: Data collection and creation in local
governments. Proceedings of the 19th Annual
International Conference on Digital Government
Research: Governance in the Data Age, 1–10.
https://doi.org/10.1145/3209281.3209381
Malawski, M., Gajek, A., Zima, A., Balis, B., & Figiela, K.
(2020). Serverless execution of scientific workflows:
Experiments with HyperFlow, AWS Lambda and
Google Cloud Functions. Future Generation Computer
Systems, 110, 502–514. https://doi.org/10.1016/
j.future.2017.10.029
Munawar, H. S., Qayyum, S., Ullah, F., & Sepasgozar, S.
(2020). Big Data and Its Applications in Smart Real
Estate and the Disaster Management Life Cycle: A
Systematic Analysis. Big Data and Cognitive
Computing, 4(2), 4. https://doi.org/10.33
90/bdcc4020004
Saif, S., & Wazir, S. (2018). Performance Analysis of Big
Data and Cloud Computing Techniques: A Survey.
Procedia Computer Science, 132, 118–127.
https://doi.org/10.1016/j.procs.2018.05.172
Shah, N., Willick, D., & Mago, V. (2022). A framework for
social media data analytics using Elasticsearch and
Kibana. Wireless Networks, 28(3), 1179–1187.
https://doi.org/10.1007/s11276-018-01896-2
Tech2biz. (n.d.). Retrieved May 11, 2022, from
https://www.tech2biz.net/
Vodák, J., Šulyová, D., & Kubina, M. (2021). Advanced
Technologies and Their Use in Smart City
Management. Sustainability, 13(10), 5746.
https://doi.org/10.3390/su13105746
Yu, T., Liu, Q., Du, D., Xia, Y., Zang, B., Lu, Z., Yang, P.,
Qin, C., & Chen, H. (2020). Characterizing serverless
platforms with serverlessbench. Proceedings of the
11th ACM Symposium on Cloud Computing, 30–44.
https://doi.org/10.1145/3419111.3421280
Zamfir, V.-A., Carabas, M., Carabas, C., & Tapus, N.
(2019). Systems Monitoring and Big Data Analysis
Using the Elasticsearch System. 2019 22nd
International Conference on Control Systems and
Computer Science (CSCS), 188–193.
https://doi.org/10.1109/CSCS.2019.00039
DATA 2022 - 11th International Conference on Data Science, Technology and Applications
336
