
Performance Enhancement of Formula One Drivers with the Use of
Group Driven Learning
A. A. Moghaddar
1 a
, F. A. Bukhsh
1b
and G. W. J. Bruinsma
2c
1
Faculty of Electrical Engineering, Mathematics and Computer Science, University of Twente, Enschede, The Netherlands
2
Faculty of Behavioural, Management, and Social Sciences, University of Twente, Enschede, The Netherlands
Keywords: Process Mining, Machine Learning, Linear Regression, Formula One, Driver Performance, Racing,
Simulator, Group Driven Learning.
Abstract: Within motorsports less experienced drivers lack pace and performance compared to their peers. Training
these drivers requires time, which, due to the regulations and resources, teams often do not have. Less
experienced drivers are expected to perform at the same level as experienced drivers. This paper has the aim
of analyzing the abilities and performances of both drivers within a Formula One team to redesign the driver
training method. The focus is to provide drivers with real-time insights and feedback on their performance
during a simulator training session. By using a combination of the principles of process mining and statistical
analysis, data markers are created on the track. Based on the differences in telemetry, visual feedback is
provided to the driver. Throughout the research, this manner of training has proven to be promising. Drivers
showed an increase in their overall performance and an increase in car control and confidence. Despite these
promising results more experiments need to be done to guarantee a consistent outcome and to prove the
effectiveness of this training program. To continue developments, further research can be conducted on the
topic of visualization and communication.
1 INTRODUCTION
The current paper poses a novel method for drivers to
improve their performance using a team-based
learning approach that is applied within a race
simulation environment. According to de Winter, van
Leeuwen, and Happee (2012), driving simulators
offer various advantages, compared to the
implementation of the training within the real
environment. As de Winter et al. (2012) mentioned,
the first, and most important advantage of using
simulators is the possibility of encountering
dangerous driving conditions without being
physically at risk. This offers the learning driver to
explore the positive or negative consequences of
actions without leaving the driver vulnerable to
potential harm (Slob, 2008). Secondly, the
controllability of conditions, the reproducibility of
scenarios, and the standardization of ground rules are
built upon tests for the next line of advantages of
using driving and motion simulators. Combining
a
https://orcid.org/0000-0001-5621-4583
b
https://orcid.org/0000-0001-5978-2754
c
https://orcid.org/0000-0001-9365-9821
these parameters in a dynamic scenario provides
opportunities for controlling potential real-life
scenarios that may happen during a race (Wassink et
al. 2006). Adjusting the parameters of the virtual
scenario can, according to Wassink et al (2006),
enhance the reaction of the learning driver by
standardizing procedures, aiming at minimizing the
impact of the change within the environment. These
changes can differ per configuration. In research
conducted by Slob (2008), the effects and differences
in the various configurations are discussed
concerning their degree of freedom (DoF), the visual
element, and the feedback element.
Within this background research, the conclusion
defined a set of criteria that need to be taken into
consideration when building the simulator. Within
chapter 3, these differences and effects of each
configuration are discussed. Thirdly, de Winter et al.
(2012) described the accuracy and ease of data
collection as another advantage, contributing to the
reliability of the provided feedback, and offering
260
Moghaddar, A., Bukhsh, F. and Bruinsma, G.
Performance Enhancement of Formula One Drivers with the Use of Group Driven Learning.
DOI: 10.5220/0011274400003274
In Proceedings of the 12th International Conference on Simulation and Modeling Methodologies, Technologies and Applications (SIMULTECH 2022), pages 260-270
ISBN: 978-989-758-578-4; ISSN: 2184-2841
Copyright
c
2022 by SCITEPRESS – Science and Technology Publications, Lda. All rights reserved

better opportunities for providing better feedback and
instructions. Based on all the aforementioned
advantages, Slob (2008) mentioned one other
advantage, describing the potential reduction of costs
compared to the alternative (real) training solution.
1.1 Feedback
Within the context of driver training receiving proper
and relevant feedback on performance contributes to
the abilities and overall performance of the driver.
The customization of feedback according to the needs
of the driver amplifies the strengths of this specific
driver within certain situations. According to Feng
and Donmez (2013), driver characteristics are good
predictors of the type and severity of exhibited risky
driving behavior when constructing systems to give
proper corrective feedback. Not only are the driver
characteristics important when constructing
personalized feedback, but taking into account the
acceptance and the preferred type of feedback plays
an important role. The visualization and presentation
of the corresponding feedback determine whether or
not the driver is going to open up to accept and
embrace the feedback (Anseel, & Lievens, 2009).
While it is recommended to use acoustic
feedback only to provide basic feedback to prevent
distracted driving, visual feedback can be used in
many forms to simplify the data as much as possible
while remaining the message clear and
understandable. According to two independent
studies on the detailed effect of visual feedback
conducted by Adams, Gopher, and Lintern (1977) and
Hoppe, Sadakata, and Desain (2006), visual feedback
contributes to the general development of motor
learning, leading to a better understanding of the
situation and hence increasing the likelihood of
interpreting the circumstance faster as well as with
more reliability. When kept simple and
understandable, providing visual feedback on a
driver’s performance can effectively improve the
driver’s learning curve. A better understanding of the
situation can be ensured due to interactivity and hence
the judgment in handling situations is refined for the
better.
1.2 Feedback as a Base for Social
Learning
Social learning is the general term of training based
upon data from various drivers while aiming to keep
the contents of the training personalized for the
current driver. Within this research, social learning
and team-based learning are applied to remove
redundancies, to improve the quality of the overall set
of data, wherein quality standards are defined by the
amount of “high” classified data sets as defined in
section 4.2, and to inform both drivers about the
habits of the other driver to show them an alternative
route through the processes.
1.3 Research Questions
The research questions addressed in this paper
therefore are:
• how can we harvest and preprocess data from
a race simulation environment to retrieve
individual performance metrics.
• how can we assess individual and team
performance
• How can we provide visual feedback to the
driver for performance improvement
purposes?
2 METHODOLOGY
Exploiting the training of athletes within this level of
expertise requires accurate data and reliable
background information. Without a proper
background of what the athlete requires, the training
might miss the major point of improvement and hence
lead to poor, unexpected results. This paper is
inspired by the CRISP-DM research methodology as
introduced and defined by Azevedo and Santos
(2008). CRISP-DM is a development approach used
as a framework for data-related research. Within this
section, the different possibilities for mimicking the
environment, data harvesting, data analysis, and
visualization are explored to create the backbone of
this project and therefore the backbone of the training.
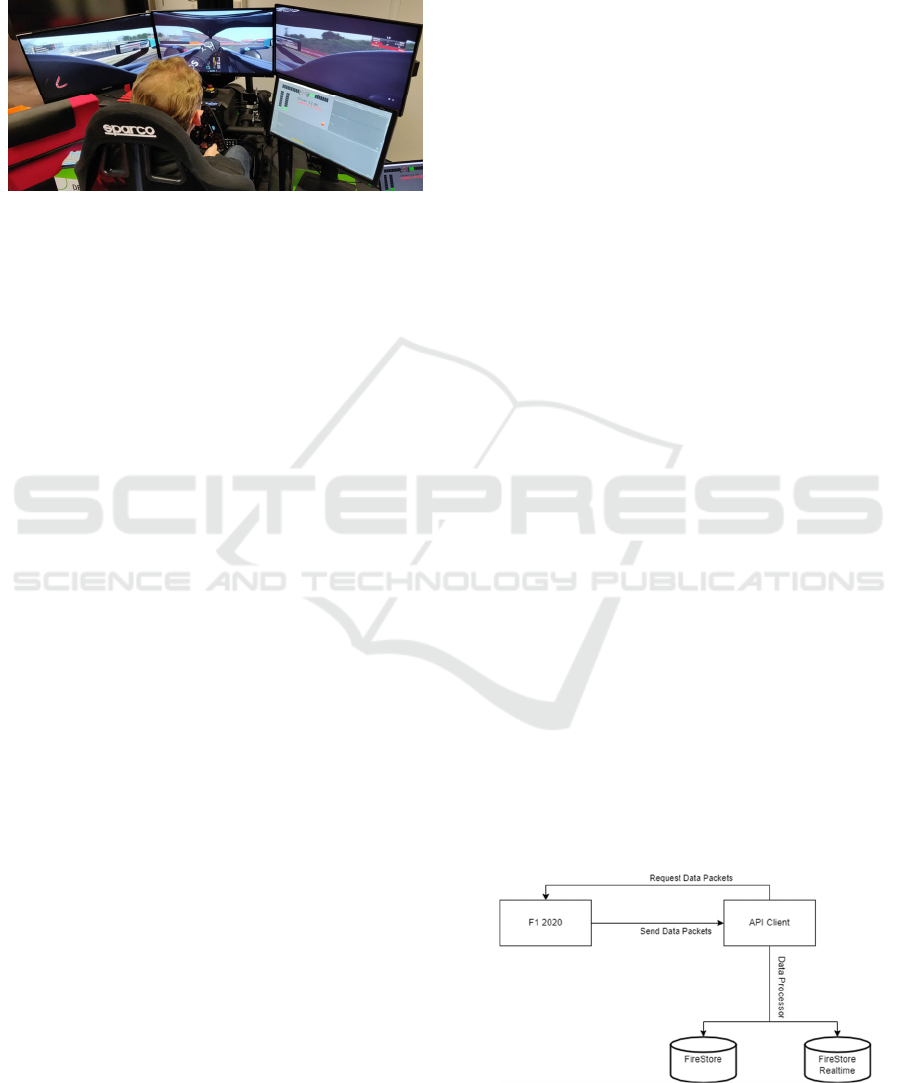
2.1 Simulator Configuration
The experiments require an environment that
attempts to mimic the real environment of the drivers
within a race. For this purpose, a racing simulator is
built to recreate the direct environment. The simulator
configuration consists of a combination of the
following hardware elements:
• Wheel Base: Podium Wheel Base DD2 -
Direct Driven
• Steering Wheel: Clubsport Steering Wheel
Formula V2.5 X + Quick Release
• Pedal set: Clubsport Pedals V3 Inverted
• Damper: Clubsport Pedals V3 Hydraulic
Damper Kit + Brake Performance kit
• Cockpit: RennSport Cockpit V2
• Seat: Sparco Pro 2000 QRT Seat for
RennSport Cockpit
• Visual: Triple Monitor setup
Performance Enhancement of Formula One Drivers with the Use of Group Driven Learning
261
The software environment used for the simulation
is the F1 2020 game developed by Codemasters. The
game is publicly available on Steam and offers
various configurations for data transmission over
UDP.
Figure 1: The Simulator Setup.
2.2 Data Preparations
Following the CRISP-DM Methodology, the next
step is the collection and preparation of data. The
Codemasters F1 2020 game is supported by an API
that provides the possibilities for extracting game data
from a racing session. This list of data that can be
obtained is structured in a set of packets that each
correlate to one section of the total dataset available.
Within the F1 2020 game, it is possible to limit the
frequency of updates to 10Hz, 20Hz, 40Hz, and
60Hz. The data packets, however, do not come in
simultaneously and therefore data might be
overwritten. Hence the upload rate of the database
must be higher. For the matter of limiting the amount
of data and reducing the overall redundancy of the
data, the frequency of updates is set to 10[Hz] and a
threshold on the relevancy parameter of the data
packet is introduced. Whenever the relevance of the
data packet is below 50% and the data packet does not
contain crucial data, this packet is ignored in the UDP
queue, and hence is not sent to, nor received by, the
application. Therefore, the packets that are sent and
received are the following:
• Header Packet
• Session Packet
• Lap Data Packet
• Car Telemetry Packet
• Car Status Packet
In essence, the crucial factors that are required for the
implementation of this training method include the
orientation of the car (Car Status Data), the current
track distance (Lap Data), the current lap time (Lap
Data), the best lap/sector times [Session Data] and the
telemetry (Car Telemetry). These elements can be
traced back to the various packets mentioned above.
3 SYSTEM DESIGN
The CRISP-DM methodology includes three steps as
part of the processing of data: Data Understanding,
Data Preparation, and Modeling. The realization has
been divided into these same three realms. Each realm
corresponds to the research sub-questions defined in
chapter 1.
3.1 Harvesting & Preprocessing
The first step before it is possible to start the CRISP-
DM Data Understanding, is the collection and
preparation of data. To mimic a real-life situation, the
racing simulator, as described in 3.1, is used for
running the F1 2020 game. Within this game, the
option for sharing telemetry is turned on. The
harvesting of data has three steps. The first step is the
sending of data. As the API provides this
functionality, there is little control over the formatting
of the data sent. The F12020 game handles the correct
sending over a UDP connection to an available client
on the same network. For ensuring that the
connectivity is over the same network, a mobile
hotspot is set up on the client-side and the racing
simulator is connected to this mobile hotspot. The
second step is to retrieve the data on the client-side
and process this into readable data. This client-side is
specifically built and designed for this project and
therefore we do have control over the data and its
corresponding formatting. The third step is to filter
the relevant information and parse this to a database.
The scheme of how the ATS system and its
components interact is displayed in figure 2.
When data is retrieved from the API, the client
decodes the data stream and processes the data into
information objects. As denoted in section 2.2, the
different data packets arrive asynchronously. To merge
arriving packets into one data object, an object buffer
is created with a 7-millisecond lifespan. Throughout
the lifespan of this buffer, all retrieved data is
combined into the same object and redundant data is
overwritten. These objects are then formatted into a C#
directory to later be formatted into a JSON object.
Figure 2: The ATS configuration.
SIMULTECH 2022 - 12th International Conference on Simulation and Modeling Methodologies, Technologies and Applications
262

A connection is made between the client and the
Firebase database. Once the end of the lifespan of a
data buffer is reached, the JSON object gets parsed to
the Firebase FireStore database. Accordingly,
Firestore responds with an approval message or an
error. The error contains information and instructions
on how to proceed. The approval message validates
the arrival of data into the database.
The database is divided into three collections. The
first collection (“Collection 1”) contains all the
gathered Test data based on the collection
construction extracted from the packets as denoted in
section 2.2. On the contrary, the third collection
(“Collection 3”) contains all the gathered Training
data. The second collection (“Collection 2”) contains
real-time telemetry updates and therefore is updated
every 0.5 milliseconds based on the incoming stream
of data from the Racing Simulator.
Considering that the goal of this first realm is to
gather and process data from the game into a data
collection, the desired result is a database filled with
telemetry data, session data, and test data. Looking at
the implementation of this section, this goal has been
achieved, and by the end of the developments of this
section, a database was available to continue to the
next step within the overall
3.2 Understanding & Learning
The second step within the CRISP-DM methodology
is the understanding of the obtained data. In essence,
the goal of the system is to provide the driver with
information about what to do best at specific parts and
segments of the track. It is important that the driver
must intuitively learn to act in a certain way, for
which the boundaries must be defined by this
algorithm. Therefore, when constructing the model
for understanding the gathered data, a breakdown of
tasks is required. For the implementation of the
“Understanding & Learning” part within this
research, a division of task categories has been made,
this division is displayed in table 1.
This part of the realization requires a strong
object-oriented structure and hence the Java
Programming Language is the language of use.
Starting at the first set of categories, the first step is to
retrieve data from the database. Consulting the
Firebase integration documentation, reading data is
done by obtaining the collections and retrieving the
corresponding documents per collection. Within the
experiments, it is expected from the participants to
first perform 8 laps under training circumstances.
This data is stored under the Training data collection.
The next step in the process is to simplify the
retrieved data and group the data together. The
parameters for simplifying data are the current
timestamp in seconds on the track and the distance
Table 1: Task division.
1) Retrieval of Data Read Firebase
2) Simplification of
Data
Create data markers per
condition X/Y*
3) Grouping of Data Group on conditions
X/Y
4) Construction of
Summaries
Calculate summary**
and averages Marker
g
roup
5) Classify Marker
Groups (MG)
Within each group,
classify value on
N
ormal Distribution
6) Recreation of
Trackline
Create ideal trackline
from highest
classification per MG
* X is defined as the distance ration, Y is defined as the time in lap
** The summary correlates to the Five number summary altogether
with the standard deviation and mean
ratio in percentages. The level of significance is in
milliseconds for the timestamp and one decimal after
the comma for the distance.
The next step within the process of understanding
& learning is to create the corresponding summaries
for defining the ideal telemetry set per marker. This
is done only for the marker with the distance ratio, as
this marker defines the leading track line correlated to
the telemetry. The summary consists of the distance
ratio, the mean wheel angle at this distance ratio, the
mean throttle/brake ratio at this distance ratio, and the
modus of the gear at this distance ratio.
After the mathematical summary has been
created, the markers get labeled with a classification.
This classification is built upon the Normal
Distribution where the critical values are defined by
the Z-Values derived from a distribution with a level
of significance of 0.05. Accordingly, the obtained Z-
Value for a 𝞪
total
= 0.05 is equal to
𝞪
upperTail
= 0.025 ⇒ 𝜇+ 2𝜎
𝞪
lowerTail
= 0.025 ⇒ 𝜇 − 2𝜎
Yielding the following criteria for the
classification:
For
mula
𝜇
−2𝜎
𝜇 −𝜎 𝜇 𝜇 + 𝜎 𝜇
+2𝜎
Clas
sifier
Lo
w
Mi
dLow
Mi
d
Mid
High
Hi
gh
Performance Enhancement of Formula One Drivers with the Use of Group Driven Learning
263
For which 𝜇 is the calculated marker average per
parameter of the marker and 𝜎 is the corresponding
standard deviation from this average.
After the dimensions of the classification have
been defined and the markers have been classified,
the entire dataset, as retrieved from Firebase, gets
classified on the basis of the aforementioned
classification criteria. Subsequently, the lower
classified data markers get removed from the dataset,
ensuring only “Mid”, “MidHigh” or “High” classified
markers and data points within the dataset. The next
step is therefore constructing a new trackline based on
the highest classified data points. This recreated ideal
trackline is defined as the “Advised Trackline for
maximum performance”. Throughout the entire
session, this process is repeated, improving the ideal
trackline per newly created or updated marker.
Throughout the research and the experiments, the
driver will face a certain learning curve that might
influence the research results. To overcome this
learning curve and therefore to minimize the effect of
this learning curve, the participant is asked to drive 8
laps before the test. Throughout these laps, the
participant will expose the learning curve by means
of increasing marker classifications. Once the system
recognizes a stabilization within the graphical
representation of the participant’s output, the learning
curve gets identified as all the output before the
stabilization. Accordingly, the data gets removed
from the training dataset, and the participant’s
learning curve is eliminated. However, the markers
classified as Mid, MidHigh, and High will remain in
memory for the improvement of the ideal trackline.
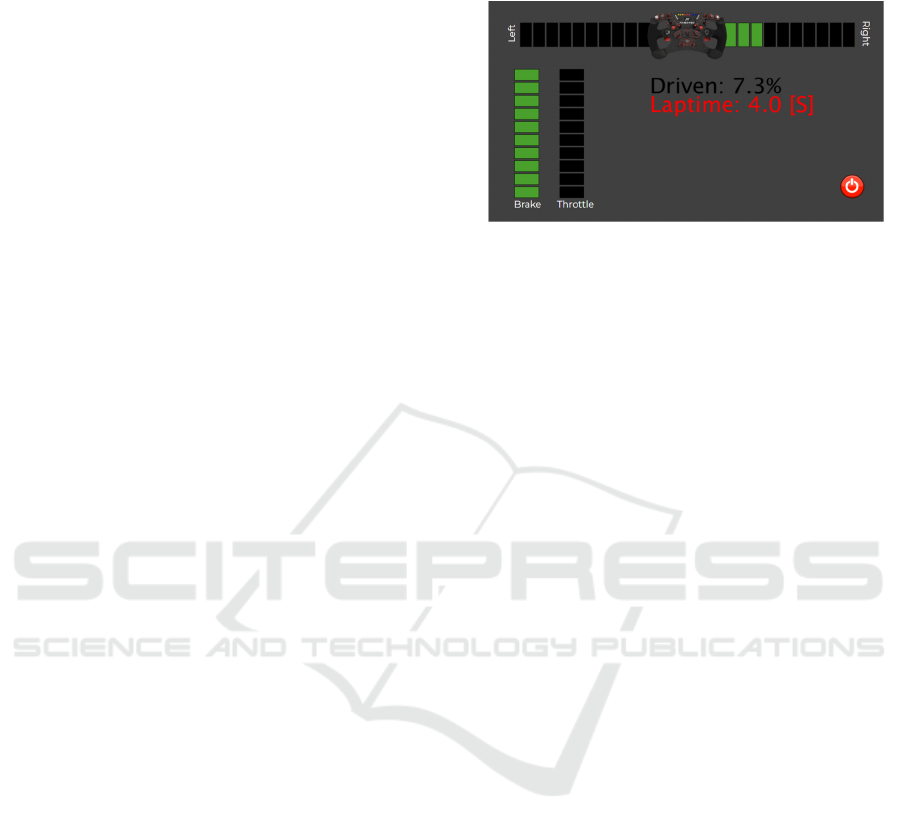
3.3 Communication & Visualisation
The third step in the CRISP-DM methodology is the
modeling of data. Displaying feedback is done
through a visualization dashboard. As mentioned
within section 3.2, the aim of the visualization is to
inform the driver about his current positioning on the
track, his current performance compared to the
advised line, and the improvements the driver has to
take to improve his performance without causing too
much distraction. Hence the visualization must be
simple and easy to understand from out of the corners
of the driver's eyes. The criteria for the visualizations
are that the colors must be distinguishable and the
information must be recognizable. For the steering
angle, a two-sided horizontal histogram is used to
denote the rate of change that needs to be applied to
the current steering angle. The Brake and Throttle
work according to a vertical bar chart that turns green
when too little pressure is applied and turns red when
too much pressure is applied. The visualization tool is
developed using the Processing 4.0 Beta 5 Library
within a Java Application. A snapshot of the
application is provided in Figure 3.
Figure 3: A snapshot of the visualization tool.
4 SYSTEM VALIDATION &
RESULTS
Within this section, the analysis of the results is
conducted. Before this analysis can take place, an
experiment is set up with a certain number of
participants. A single experiment consists of two
drivers, a potentially good driver, and a potentially
worse driver. The better driver is asked to participate
in the experiment first. Subsequently, the worst driver
is asked to participate in the experiment as the second.
Although not desired, it is important to anticipate a
situation wherein not all participants have an equal
amount of knowledge of racing simulators.
Therefore, to reduce the effects of this knowledge
gap, the experiments are divided into 5 sections:
1) Participant Briefing & installation
2) Training Session
3) Test Session
4) Survey
5) Open Discussion
The experiment starts with a brief introduction to the
project and a brief introduction to the experiment.
Once these introductory briefings are done, the
participants start a training session wherein he/she has
to drive 8 full laps on Circuit Zandvoort. There will
be no feedback given to the participant. The data is
collected and used for preparing the predictions that
will be shown to the participants in the test session.
During the Test session, the driver is once again asked
to drive 8 full laps, this time with visualizations and
feedback. Due to GDPR regulations, details about
participants will not be shared.
4.1 Results
For this research there was room to conduct three
experiments. The analysis of the experiments has
SIMULTECH 2022 - 12th International Conference on Simulation and Modeling Methodologies, Technologies and Applications
264
been divided into four parts. The first part is on the
harvesting of data and the reliability of the created,
ideal, trackline. Secondly, an analysis of the overall
performance of drivers is done by depicting the R-
Squared values of the Test sessions against the R-
Squared values of the Training Sessions for every
participant. Thirdly, the performance based on the
brake ratio, the throttle ratio, and the steering angle is
analyzed based on the initial training dataset and the
test dataset. Lastly, a brief analysis of the feedback
system is done. This is done based on the responses
to the survey.
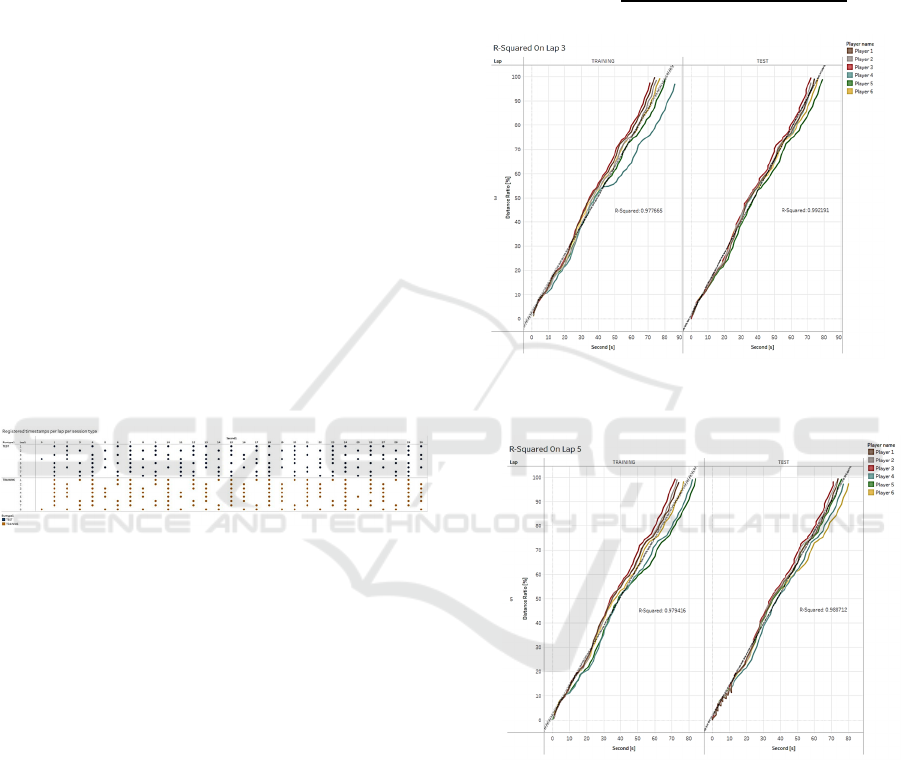
To visualize the power of big data and process
mining, the effect of a high data acquisition rate is
denoted against the reliability of the created advised
trackline. By displaying the number of timestamp
markers created per lap, it is easily seen when and
where the data packets have dropped. To overcome
the amount of dropped data, more data must be
gathered. As depicted in figure 4, once the total
number of laps driven increases, the total coverage of
the timestamps increases, leading to a higher
accuracy per marker. From this dataset, a generalized
model can be constructed wherein each required
timestamp is covered by the total data set. From this
generalization, a reconstruction of the trackline can
be created.
Figure 4: The data markers coverage per timed lap,
depicting the packet drops.
4.2 Driving Performance
When the goal of training is to improve multiple
drivers, along the same progress line, the variation in
data is the most important factor. More variation
means a larger difference in performance and
therefore a larger difference in abilities, confidence,
and skills. The analysis is based on the R Linear
Regression model wherein the severity of variation
within the dataset is denoted in R-Squared. R-
Squared is in the context of this research defined as
the statistical measure of how close the data fit the
generated regression line. The datasets recorded per
driver showed decreasing classification levels the
longer the session took. From this can be concluded
that due to the effects of fatigue and exhaustion,
drivers did perform less at the end of a session
compared to the beginning of the session. For the
reliability of the analysis, only laps 3 and laps 5 are
taken into account.
The R-Squared is defined as the depiction of the
distance ratio against the amount of time on track.
The regression line, therefore, is the ideal line
wherein the 100% distance ratio is reached in the
most average amount of seconds. The R-Squared
value is calculated using the formula:
𝑅
1−
𝑆𝑢𝑚 𝑆𝑞𝑢𝑎𝑟𝑒𝑑 𝑅𝑒𝑔𝑟𝑒𝑠𝑠𝑖𝑜𝑛
𝑇𝑜𝑡𝑎𝑙 𝑠𝑢𝑚 𝑜𝑓 𝑆𝑞𝑢𝑎𝑟𝑒𝑠
Figure 5: The R-Squared value as a rate of variation on
Lap 3.
Figure 6: The R-Squared value as a rate of variation on
Lap 5.
When analyzing Figure 5, the most visible
difference between the training and test data is that
there are fewer peaks and therefore fewer outliers
within the datasets during the test session compared
to the training session. Moreover, the values seem
closer to each other. This same phenomenon seems to
be present in Figure 6, where the analysis on lap 5 is
depicted. This formula yields the following table of
R-Squared values against the corresponding lap and
session type:
Performance Enhancement of Formula One Drivers with the Use of Group Driven Learning
265
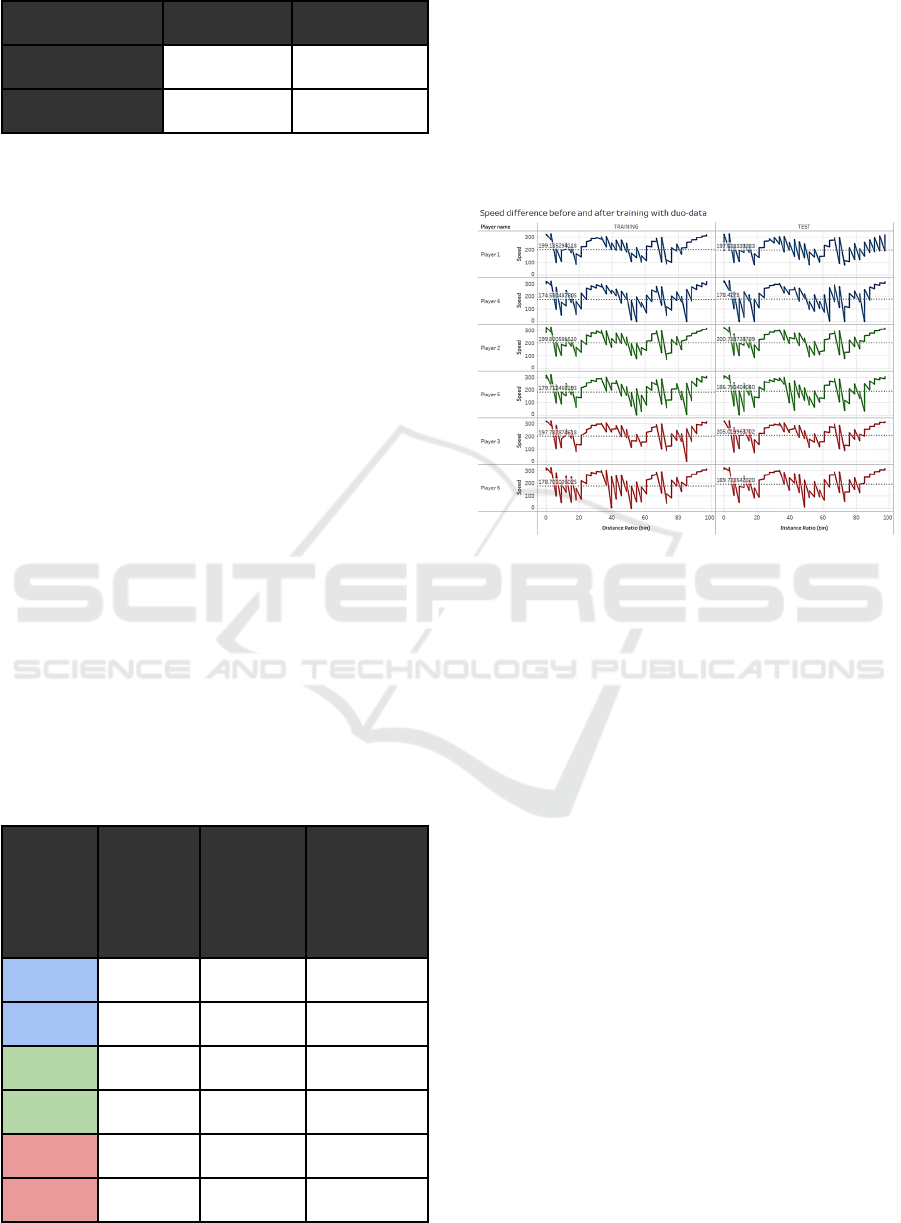
Table 2: R
2
values for lap 3 and lap 5 for both session types.
Lap 3 Lap 5
Training Session R
2
= 0.977665 R
2
= 0.979416
Test Session R
2
= 0.992191 R
2
= 0.988712
From this table it can be deduced that in any case,
the training session had less variety within the data
samples, although there is only the slightest
difference. Nonetheless, This yields that the testing
session had an additional factor in play that caused
this slight increase in overall performance.
4.3 Car Handling
The second performance analysis method is based on
the telemetry data retrieved from the real-time
database and the ideal telemetry calculated by the
learning system. Before the experiments started, the
drivers were grouped based on their experiences with
driving and racing simulators. According to these
groupings, driver duos were created. Each duo
consisted of a presumed experienced driver and a
presumed inexperienced driver. The aim of this
division between the participants opened options for
amplifying the effects of the training to gain the
maximum insights as possible during the analysis
phase.
When looking at the overall race pace of the
drivers in figure 7, it is seen that almost all drivers
improve upon their average speed. Within this
context, a higher average speed yields lower lap times
and hence a more efficient drive.
Table 3: The difference is race pace denoted in percentages
[%].
Driver
name
Avg Pace
during
Training
Session
[km/h]
Avg Pace
during
Test
Session
[km/h]
Difference
rate in
percentages
[%]
Pla
y
er 1 199.14 197.59 -0.808
Pla
y
er 4 174.58 178.43 +2.203
Player 2 199.80 200.79 +0.469
Pla
y
er 5 179.71 186.79 +3.938
Pla
y
er 3 197.78 205.01 +3.659
Player 6 178.70 189.73 +6.174
From table 3, it can be deduced that the rate of
change of the inexperienced driver correlates to the
rate of change of the experienced driver. Meaning that
if the experienced driver barely increases, the rate of
change for the inexperienced driver will be low due
to the low quality of the data. If the experienced driver
improves a lot, the quality of the data is high and
hence the inexperienced driver can benefit from this
set of highly classified data, meaning that the
feedback would become more accurate and reliable.
Figure 7: The difference in race pace with and without
feedback.
4.4 Brake Throttle Differences
Given the large difference in overall pace and driver
performance of duo 3; red, analyzing the data of this
duo returns the best visible effect of the duo training
program. In figure 8, the difference in brake and
throttle performance of player 6 has been depicted,
wherein the distinction has been made between the
session type (training, test). During the training
session, it is seen that there is much fluctuation in the
throttle. This leads to less time on the maximum
throttle and therefore less overall speed. These
fluctuations can be explained by the level of
confidence of the driver.
This same principle counts for the brake.
Comparing the results of the training session to the
test session, it is seen that within the test session, the
driver has much more confidence as there are fewer
fluctuations in the driver’s brake and throttle
handlings. This implies that the driver has more
understanding of the situation and hence can better
control the car to operate at maximum performance.
Moreover, it is seen that the driver is making less
use of the brakes and therefore makes more use of the
friction of the engine to slow down, implying that
more speed and more pace is carried throughout the
track, leading to more efficient handling of the car.
SIMULTECH 2022 - 12th International Conference on Simulation and Modeling Methodologies, Technologies and Applications
266
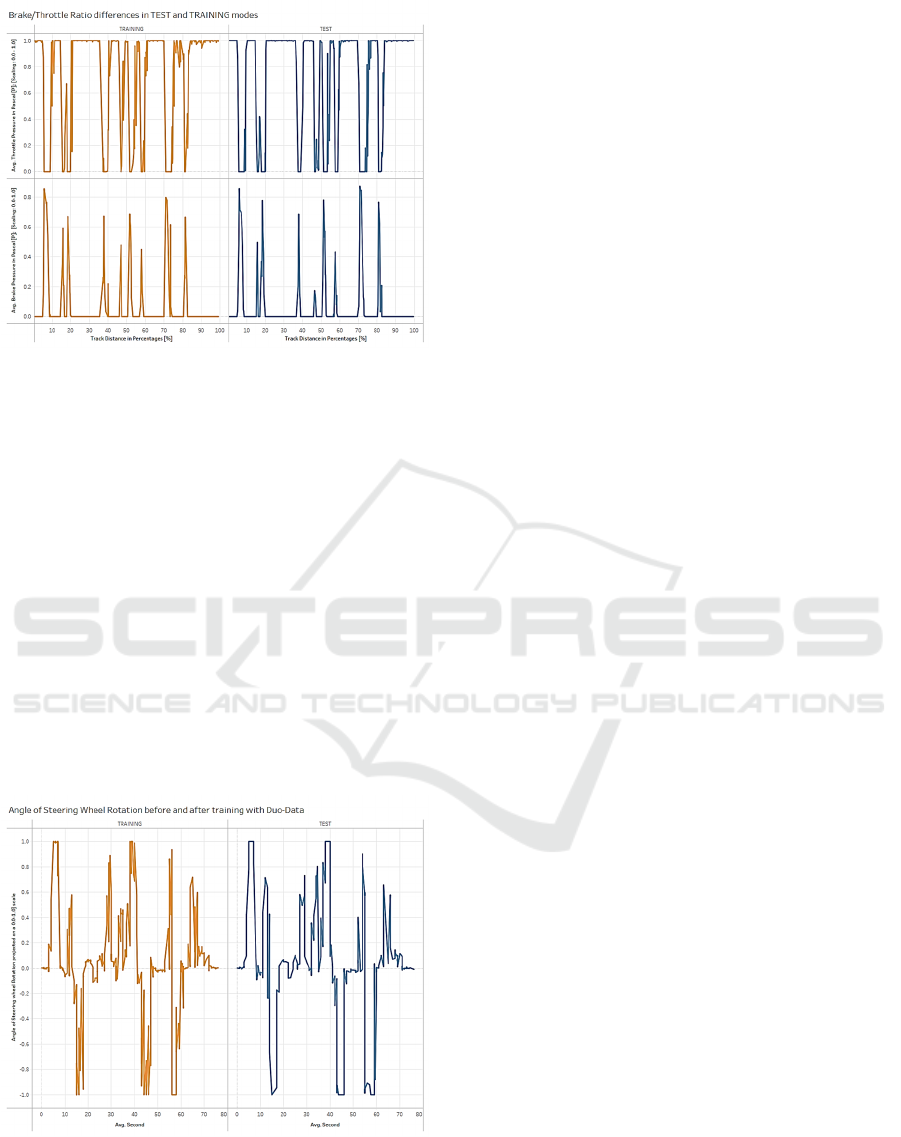
Figure 8: The brake and throttle performance during the
training and test sessions.
4.5 Steering Efficiency
During the training session, the player has a lot of
fluctuation in the steering wheel throughout the lap.
Within the context of the steering angle, fluctuations
mean the rate of corrections required to operate the
car. Hence, more fluctuations imply more corrections
and therefore less control of the car and the situation.
Comparing the results from the training session and
the test session, it is evident that the number of
fluctuations has decreased, implying that the driver
had more control over the car. Moreover, it is seen
that the steering angles remain more consistent over
the track segments, meaning that the cornering gets
longer, yielding more pace at the end of the corner,
yielding improved exits.
Figure 9: The steering angle during the training and test
session.
5 DISCUSSION
When willing to validate the results obtained during
the experiments, it is of high importance to be
realistic about the effectiveness, accuracy, and
reliability of the system and the tests. Therefore a
disclaimer must be made. While the results, as
introduced in chapter 4, seem promising and
effective, more statistical testing needs to be done.
5.1 Recreation of Ideal Trackline
The corresponding research subquestion that belongs
to this topic of the research is, as denoted in section
1.3: “To what extent is it possible to recreate an
artificial trackline built upon the basis of the highest
performances throughout the track?”. When trying to
answer this research question, the results that section
4.1 yielded showed that approximately 8 laps were
required to fully cover every second and every driver
meter of the track. From the data collected through
the racing simulator, it is possible to reconstruct the
events, with regard to every parameter of the car as
provided by the Codemasters API, that occurred
during the moment on the track. In this way, a data
collection can be created to artificially regenerate the
track and the position of the car on the track while
having every parameter required or not required in
mind. Therefore, the extent to which it is possible to
recreate the trackline is endless as long as the
database allows data to be captured.
5.2 Translation of Data into Feedback
The second question that needs to be answered before
reliable feedback can be provided to the driver, is the
question on the translation of data into advice based
on the current telemetry. The corresponding research
question to be answered is “How can this artificial
trackline be translated into terms of required
telemetry changes to guide towards this trackline?”.
The translation needs to happen for three parameters
only, as denoted by section 3.3. While these three
parameters are based on a series of calculations to
determine which values of the parameters are actually
the value to display, these parameters are easily
interpreted as single, rational values. These values
can then be translated into advice per marker, as
created by the learning system, and automatically be
bound to represent the marker in terms of the
telemetry settings.
5.3 Projection of Feedback to Driver
Evaluating the current visualization of the data, it is
important to take into consideration the parameters
Performance Enhancement of Formula One Drivers with the Use of Group Driven Learning
267

that need to be available to the driver. When looking
at the corresponding research question, the question
yields: “How can these telemetry changes be
communicated to the driver in the most effective
manner?”. Throughout the research, it was concluded
that not all types of feedback were ideal within the
context of this application, e.g., acoustic feedback
was labeled as useful for quick updates but not for
continuous feedback. As opposed to this statement,
the participants did agree that for continuous
feedback, visual feedback would be better, provided
that the manner of presenting this feedback was more
subtle. A potential implementation of this feedback
system would be integration within the F12020 game
or a virtual reality overlay. In this end, this project
remains a work-in-project and hence further research
is required before practical implementation
5.4 Limitations
Having in mind the scope of this research, up until the
current standing, the project seems promising and
yields great results. Considering that simulators are
already widely used for training professional drivers,
an additional layer of training and, eventually,
protection is seeming to be the way to conquer the
checkered flag.
Considering the minimal requirements for setting
up this research, many limitations have come to play
during the project. These limitations cover a broad list
of items that need to be discussed when willing to
redo or expand this project. The actual research
limitations will be discussed in the next section. The
items that this section will cover include:
• The availability of materials
• The budget cap
• Domain Experts
• The reliability of the UDP protocol
• The database limitations in contrast to the data
collection size
• The limited research on the Formula One Topic
• Limited availability of drivers
6 CONCLUSION
The aim of this paper is to find an optimal way of
enhancing driver performances by adjusting the
training according to gathered data on earlier
achieved performances. This was done in a process of
three steps. The first step was to harvest data on the
performances of drivers within a team or cluster. This
was done using the Racing Simulator and principles
of process mining. The data was stored in a database
for later analysis. The second step was to analyze the
gathered data with the main purpose of learning the
track boundaries, the telemetry boundaries, and
understanding the abilities of the driver. This was
done using conformance checking, basic principles of
statistics, and linear regression. Lastly, the analysis of
the data retrieved from the learning model was
translated into valuable feedback and displayed to the
driver through a feedback system.
When analyzing the data gathered by the ATS
system, several factors play a role to determine
whether a created marker is of high value. After this
classification of data markers has been made, a
training set is created from the currently stored data
with which the system trains itself to recognize
patterns. According to these created patterns, the
system builds advice per second and per distance ratio
on the track and bundles this with the corresponding
telemetry information. Moreover, the system reads
out the real-time telemetry database to link the current
behavior of the driver to a previously occurring event
or a generated marker to optimize the action, and
eventually the performance, of the driver.
The results of the experiments conducted with
three duo’s drivers were promising. Almost all
drivers showed an increase in performance and a rise
in confidence. Fewer fluctuations were observed at
the steering wheel, implying more control over the car
and a higher understanding of the abilities of the car
and above all, the abilities of the driver. Additionally,
more peaks in the use of the throttle were observed
while the use of the brakes decreased, resulting in
more overall pace and performance.
Nevertheless, while these results do imply an
effective training concept, the statistical backbone of
the project is weak. More experiments must be
conducted with a larger sample size to guarantee the
effectiveness of the training.
In conclusion, it is not yet possible to guarantee
that this manner of training works. The initial concept
of the training method appeared to be effective and
pervasive, however, the system lacks statistical
coverage to prove that this way of training athletes
guarantees an improvement in performance.
6.1 Practical Recommendations
It can be said that this training method shows
potential as the results obtained look promising.
However, to improve the system to make it
waterproof, some recommendations must be made.
The main recommendation to be made is the system
that all participants seemed to have difficulties with;
the feedback system. As this feedback system is the
main interface for the drivers to interact with, this
system must be either optimized in a way that it does
not form a distraction or the feedback system must be
implemented according to the feedback received from
SIMULTECH 2022 - 12th International Conference on Simulation and Modeling Methodologies, Technologies and Applications
268

the participants. In further research, I would
recommend redesigning the feedback system in a way
that is more visible to the driver with less effort.
Furthermore, it is of high importance to keep the
information even simpler so that the driver can see or
feel in a blink of an eye what is expected. Another
recommendation that I deem important is the speed of
the database. While the database showed an
impressive amount of speed and functionality, the
system lacked a bit behind due to the congestion
errors that were present by default. The internet
connection and the database configuration seemed to
be a bottleneck throughout the entire process. Perhaps
in future studies, a local database could be
implemented to overcome these issues.
Additionally, the learning and analysis method is
currently based on the normal distribution. While this
classification method seems to work for this context,
it is not always reliable. If a car crashes along the way,
the entire lap gets classified as a low marker.
Neglecting the time that a car is lacking in this
situation, the driver might still recover and increase
his pace. This increase in pace is currently not
counted towards the final classification and hence the
data is discarded. Having too many of these data
points might corrupt the data. To overcome this, a
fully functioning deep learning algorithm can be
implemented to recognize events like crashes.
6.2 Future Work
To exploit the effectiveness of this training method,
these recommendations must be taken into account.
Improvements must be made to increase the
reliability and accuracy of the system. Moreover, by
conducting more user tests, a statistical and scientific
backbone can be created for the training method.
Additionally, although the initial concept relied
on machine learning and deep learning principles, the
final concept within the scope of this research barely
made use of these concepts. For future development
of this project, machine learning and/or deep learning
could be exploited to better understand the obtained
data and perhaps give suggestions beforehand instead
of in real-time.
Lastly, the method of displaying information must
be changed. As denoted in the recommendation
section, another manner of providing feedback must
be implemented to gain the maximum result while
keeping the level of distraction low.
REFERENCES
Adams, J.A., Gopher, D., Lintern, G. (1977). Effects of
visual and proprioceptive feedback on motor learning.
Journal of Motor Behavior, 9(1),11-22.
http://dx.doi.org/10.1177/154193127501900204
Anseel, F., & Lievens, F. (2009). The Mediating Role of
Feedback Acceptance in the Relationship between
Feedback and Attitudinal and Performance Outcomes.
International Journal of Selection and Assessment, 17,
362-376. https://doi.org/10.1111/j.1468-2389.2009.00
479.x
Azevedo, A., & Santos, M. F. (2008). KDD, SEMMA and
CRISP-DM: a parallel overview. IADS-D.
Balcerzak, T., Kostur, K. (2018). Flight Simulation in Civil
Aviation. Revista Europa de Derecho de la Navegación
Marítima y Aeronáutica, 35(3), 35-68. Retrieved from
https://dialnet.unirioja.es/servlet/articulo?codigo=6953
721
Crespo, L. M., & Reinkensmeyer, D. J. (2010). Haptic
Guidance Can Enhance Motor Learning of a Steering
Task. Journal of Motor Behavior, 40(6), 545-557.
https://doi.org/10.3200/JMBR.40.6.545-557
De Winter, J.C.F., van Leeuwen, P.M., Happee, R. (2012).
Advantages and Disadvantages of Driving Simulators:
A Discussion. Retrieved from Delft, University of
Technology, Department of BioMechanical
Engineering. doi 10.1.1.388.1603
Espié, S., Gauriat, P., Duraz, M. (2005). Driving
Simulators Validation: The Issue of Transferability of
Results Acquired on Simulator. Retrieved from The
Université Gustave Eiffel.
Feng, J., & Donmez, B. (2013). Design of Effective
Feedback: Understanding Driver, Feedback, and Their
Interaction. Proceedings of the Seventh International
Driving Symposium on Human Factors in Driver
Assessment Training and Vehicle Design, 404-410.
http://dx.doi.org/10.17077/drivingassessment.1519
Hattie, J., Timperley, H. (2007). The Power of Feedback.
Review of Educational Research, 77(1). 81-112.
https://doi.org/10.3102%2F003465430298487
Hoppe, D., Sadakata, P., Desain, P. (2006). Development
of real-time visual feedback assistance in singing
training: a review. Journal of Computer Assisted
Learning, 22(4), 308-316. https://doi.org/10.1111/
j.1365-2729.2006.00178.x
Nelson, M.M., & Schunn, C.D. (2009). The nature of
feedback: how different types of peer feedback affects
writing performance, Instructional Science, 37, 375-
401. https://doi.org/10.1007/s11251-008-9053-x
Pakkanen, T., Raisamo, R., & Surakka, V. (2014) Audio-
Haptic Car Navigation Interface with Rhythmic
Tactons. In: Auvray M., Duriez C. (eds) Haptics:
Neuroscience, Devices, Modeling, and Applications.
EuroHaptics 2014. Lecture Notes in Computer
Science, vol 8618. Springer, Berlin, Heidelberg.
https://doi.org/10.1007/978-3-662-44193-0_27
Slob, J. (2008). State-of-the-Art Driving Simulators, a
Literature Survey. Retrieved from The University of
Eindhoven, Department of Mechanical Engineering,
Control Systems Technology Group. Website:
http://www.mate.tue.nl/mate/pdfs/9611.pdf
Voelkel, S., & Mello, L.V. (2014). Audio Feedback - Better
Feedback? Bioscience Education, 22(1), 16-30.
Performance Enhancement of Formula One Drivers with the Use of Group Driven Learning
269

https://doi.org/10.11120/beej.2014.00022
Wassink, L., Van Dijk, B., Zwiers, J., Nijholt, A., Kuipers,
J., Brugman, A. (2006). In the truman show: Generating
dynamic scenarios in a driving simulator. IEEE
Intelligent Systems, 21(5), 28-32, doi: 10.1109/MIS.20
06.97
SIMULTECH 2022 - 12th International Conference on Simulation and Modeling Methodologies, Technologies and Applications
270
