
Intersection Traffic State Estimation using Speed Transition Matrix and
Fuzzy-based Systems
ˇ
Zeljko Majstorovi
´
c
a
, Leo Ti
ˇ
sljari
´
c
b
, Edouard Ivanjko
c
and Ton
ˇ
ci Cari
´
c
d
Faculty of Transport and Traffic Sciences, University of Zagreb, Vukeli
´
ceva street 4, 10000 Zagreb, Croatia
Keywords:
Intersection State Estimation, Bottleneck Detection, Connected Vehicles, Fuzzy-based System, Speed
Transition Matrix.
Abstract:
Urban traffic congestion is a significant problem for almost every city, affecting various aspects of life. Besides
increasing travel time, congestion also affects air and life quality causing economic losses. The construction
of infrastructure to solve congestion problems is not always feasible, and, at the end, attracts only additional
traffic demand. Thus, a better approach for solving the problem of city congestion is by optimal management
of the existing infrastructure. Timely detection of traffic congestion on the road level can prevent congestion
formation and even improve road network capacity when used for appropriate traffic control actions. Detecting
congestion is a complex process that depends on available traffic data. In this paper, for traffic state estimation,
including congestion level, at the intersection level, a new method based on Speed Transition Matrix and
Fuzzy-Based System is presented. The proposed method utilizes the Connected Vehicle environment. It is
tested on a model of an isolated intersection made in SUMO simulation software based on real-world traffic
data. The validation results confirm the successful detection of traffic state (congestion level) at intersections.
1 INTRODUCTION
In recent years, the world has faced an increased num-
ber of vehicles due to globalization and enlargement
of the urban centers. The major challenge for almost
every city is traffic congestion, which mainly affects
road vehicles and public transportation as they share
the same urban infrastructure. On urban roads, traffic
congestions occur mainly at intersections where con-
flicting traffic flows are safely resolved using traffic
lights.
In general, urban congestions can be divided into
recurrent and non-recurrent. Physical limitations of
infrastructure, daily repeating periods of increased
traffic demand, and infrastructure management cause
recurrent congestions, and non-recurrent congestions
are mainly caused by traffic incidents, special events
(e.g., sports events, concerts, vehicle breakdown, traf-
fic accident), roadworks, etc (Chow et al., 2014). Re-
current congestions are easier to predict, and appro-
priate control actions can be planned in advance to
a
https://orcid.org/0000-0002-5242-6607
b
https://orcid.org/0000-0001-8257-8356
c
https://orcid.org/0000-0002-2083-0672
d
https://orcid.org/0000-0001-8564-4304
alleviate them. For the latter, good traffic state esti-
mation is crucial because the first step towards the so-
lution of congestion is its detection. By successfully
detecting the congestion, appropriate actions for con-
gestion soothing like changing the signal or rerouting
vehicles can be taken.
Urban roads can operate longer in stop-and-go
conditions during rush hours. Especially at intersec-
tions where the distinction between congestion and
regular traffic light queue is not always obvious. Hav-
ing accurate and timely information regarding traffic
state is crucial for every modern traffic control sys-
tem (Wang et al., 2018). Such a system has to ac-
count for multiple input parameters and describe them
with a single value to have reliable data to estimate
the traffic state. Researchers often use fuzzy logic
because it is close to human reasoning and can also
process vague input information. Fuzzy logic is used
to describe the uncertainty of things and has wide ap-
plication in fuzzy reasoning which allows application
in different fields (Maldonado et al., 2021). Because
of its properties, fuzzy logic has also found its ap-
plication in traffic engineering (Koukol et al., 2015).
It is also common to combine fuzzy logic with dif-
ferent methods for different purposes (Borlea et al.,
2021). One example are decision support systems,
Majstorovi
´
c, Ž., Tišljari
´
c, L., Ivanjko, E. and Cari
´
c, T.
Intersection Traffic State Estimation using Speed Transition Matrix and Fuzzy-based Systems.
DOI: 10.5220/0011275500003271
In Proceedings of the 19th International Conference on Informatics in Control, Automation and Robotics (ICINCO 2022), pages 193-200
ISBN: 978-989-758-585-2; ISSN: 2184-2809
Copyright
c
2022 by SCITEPRESS – Science and Technology Publications, Lda. All rights reserved
193

variable speed limits, and adaptive traffic signal con-
trol. (Pozna and Precup, 2014) created an algorithm
for modeling expert systems. The advantage of this
algorithm is the systematic and general formulation
that allows the modeling of uncertain expert systems.
The appearance of Connected Vehicles (CVs) has
opened up new areas of research. CVs have the possi-
bility of operating like mobile sensors that can pro-
vide large amounts of data for various traffic ana-
lyzes. Unlike historical traffic data that needs to be
collected over a period of time to observe patterns in
traffic behavior covering only specific measurement
points, each CV can provide real-time data. Thus,
spatio-temporal traffic data can be collected. While
existing infrastructure uses traffic monitoring sensors
and cameras to detect congestion and manage traf-
fic infrastructure, networked vehicles can communi-
cate with infrastructure using Vehicle to Infrastructure
(V2I) communication and other vehicles using Vehi-
cle to Vehicle (V2V) communication to exchange cur-
rent traffic parameters. For example, at a city inter-
section, vehicles can exchange position data, which
results in increased traffic safety.
The Society of Automotive Engineers (SAE)
J3016 standard defines six levels of driving automa-
tion (Shuttleworth, 2019). SAE Level 0 implies ve-
hicles without automation to SAE Level 5 which im-
plies full vehicle autonomy. According to the same
standard almost fully self-driving (Level 4) and even
fully autonomous vehicles (Level 5) are expected
within a decade including city driving.
CVs have significant advantages. Modern equip-
ment such as radars, lidars, cameras, and many
other sensors makes them excellent mobile data traf-
fic sources. To optimize the driving strategy of
the automated vehicles, (Kumm and Schreckenberg,
2019) implemented agent-based simulation in the
framework of the three-phase traffic theory using a
high number of interacting vehicles. The proposed
methodology allowed automated vehicles to merge
into the best possible gap between moving vehicles.
Moreover, CVs have advantages over existing traffic
sensor technology because they are not limited by line
of sight like cameras, and are collecting large amounts
of data at the microscopic level which is convenient
for studying traffic. However, the motivation for this
research stems from the question of how to process
large amounts of data quickly and efficiently. Such
data amounts of data will be generated by future traf-
fic flows containing classic and CVs. The share of
the later will rise decreasing the need for classic traf-
fic sensors (inductive loops). Speed Transition Matri-
ces (STMs) are suitable in this context because they
simplify data processing and are applied in this paper
as well. The motivation for this research stems from
the question of how to process large amounts of data
quickly and efficiently using the potential of mobile
sensors in form of CVs.
Thus, this paper presents a new method for in-
tersection traffic state estimation that is based on the
Center of Mass (CoM) of speed data represented in
the STM and Fuzzy Inference System. The STMs
were computed based on vehicle speed data collected
during simulation, and are represented as a speed
probability distribution of vehicles traveling between
two consecutive road segments. Thus, the scientific
contributions of this paper are as follows:
- Traffic data representation on a isolated urban in-
tersection using STMs for state estimation is de-
veloped;
- The methodology for the intersection traffic state
estimation is proposed based on the attributes ex-
tracted from the traffic patterns represented with
the STMs;
- The proposed methodology is applied and vali-
dated on an isolated intersection in the Simulation
of Urban Mobility (SUMO) software.
The rest of the paper is organized as follows. In
section 2, existing traffic state estimation methods are
described. The proposed methodology applied inter-
section state estimation and validation methods are
presented in section 3. Obtained results of intersec-
tion state estimation are analyzed in section 4. Con-
clusion and future work suggestions are given in last
section 5.
2 TRAFFIC STATE ESTIMATION
METHODS
Urban traffic state estimation is the subject of inter-
est for many researchers. In the literature, researchers
used different data sources and explored various traf-
fic state estimation methods. In general, traffic state
estimation methods can be categorized into the fol-
lowing categories: model driven, data driven, and
streaming-data driven methods (Seo et al., 2017).
Model driven methods are based on knowledge of
physical flows where models represent the physical
flow. Models have high explanatory characteristics,
which means even if the estimation is inaccurate, it is
possible to explain the inaccuracy. However, a poorly
calibrated model can affect the performance of the es-
timation method (Seo et al., 2017).
Data-driven traffic state estimation methods rely
on historical data, using statistical methods and ma-
chine learning techniques to determine real-time traf-
ICINCO 2022 - 19th International Conference on Informatics in Control, Automation and Robotics
194
fic states based on features found in historical data.
Depending on historical data has its drawbacks.
These methods are prone to failure if an irregular
event occurs or traffic trends change longtime. Es-
pecially in the case without having these two cases in
the historical data (Seo et al., 2017).
In contrast to previously mentioned methods,
streaming-data driven methods do not require histori-
cal data, which makes them robust to unpredictable
events. They rely on streaming data and weak as-
sumptions without capabilities for future prediction.
For accurate estimation, these methods require large
amounts of streaming data (Seo et al., 2017).
For traffic analysis, the Global Positioning System
(GPS) is commonly used as a data source. Needed
traffic data are mostly collected by GPS-equipped taxi
or delivery vehicles. GPS cannot always provide ac-
curate data. Thus, it is mostly used to determine con-
ditions on the road level. (Kan et al., 2019) detected
turn-level congestion analyzing features of GPS data.
Using clustering, their method identifies congestion
events for each turning direction. (D’Andrea and
Marcelloni, 2017) also used GPS data to detect traffic
states. They detected traffic states based on vehicle
speeds extracted from GPS data classified based on
speed thresholds. Another example of applying GPS
data to estimate queue length and level of service for
an intersection is (Ti
ˇ
sljari
´
c et al., 2018). All of these
methods rely on features such as vehicle speed and
position extracted from GPS data, which depend on
the number of tracked vehicles and valid GPS data
samples. Also, it is important to consider the time de-
lay caused by data processing because it takes some
time to collect enough GPS data and process it.
(He et al., 2019) relayed on probe vehicle data
consisted of latitude, longitude, speed, moving direc-
tion, and the stop-and-go characteristic of traffic pass-
ing through the intersection to identify turn-level con-
gestion. Besides GPS data, traffic detectors are also
very valuable data sources for research. (Lee et al.,
2015) and (Liu et al., 2009) implemented real-time
estimation of queue lengths on intersection based on
detectors data which resulted with reliable estimation
of queue lengths in real-time.
Fusion from multiple data sources can also pro-
vide timely and accurate information, which are im-
portant for applications such as driver information
systems and traffic control systems (Papageorgiou
et al., 2003). To estimate queue tail location, (Rostami
Shahrbabaki et al., 2018) fused detector data with the
location and speed of the CVs in a mixed traffic flow
containing classic and CVs.
3 METHODOLOGY
In this section, key steps of the applied research
methodology are described. The methodology pre-
sented in this paper relies on vehicle speeds which can
be extracted from GPS data or vehicle probe data in a
CV environment. Graphical visualization of method-
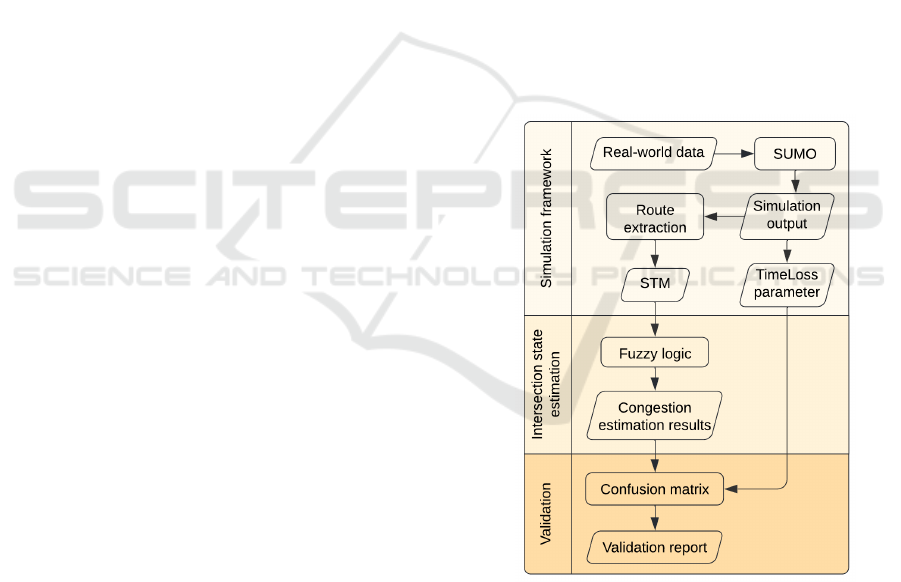
ology is shown in Fig. 1 which is divided into three
main steps: (i) simulation framework, (ii) intersection
state estimation, and (iii) validation. Within the simu-
lation framework, real-world data are used as input in
SUMO software to create a simulation model, which
results with STM and TimeLoss parameter. Intersec-
tion state estimation incorporates fuzzy logic, which
takes STMs as an input to estimate the intersection
state. In the validation step, congestion estimation re-
sults and TimeLoss from the first step are validated
using a confusion matrix to check the accuracy of the
state estimation. Every step was done by combin-
ing Python programming language and SUMO sim-
ulation software using real-world traffic data for the
creation of the intersection model. More details about
every step are given in the continuation.
Figure 1: Graphical visualization of proposed methodology
for the development of the intersection state estimator.
3.1 Simulation Framework
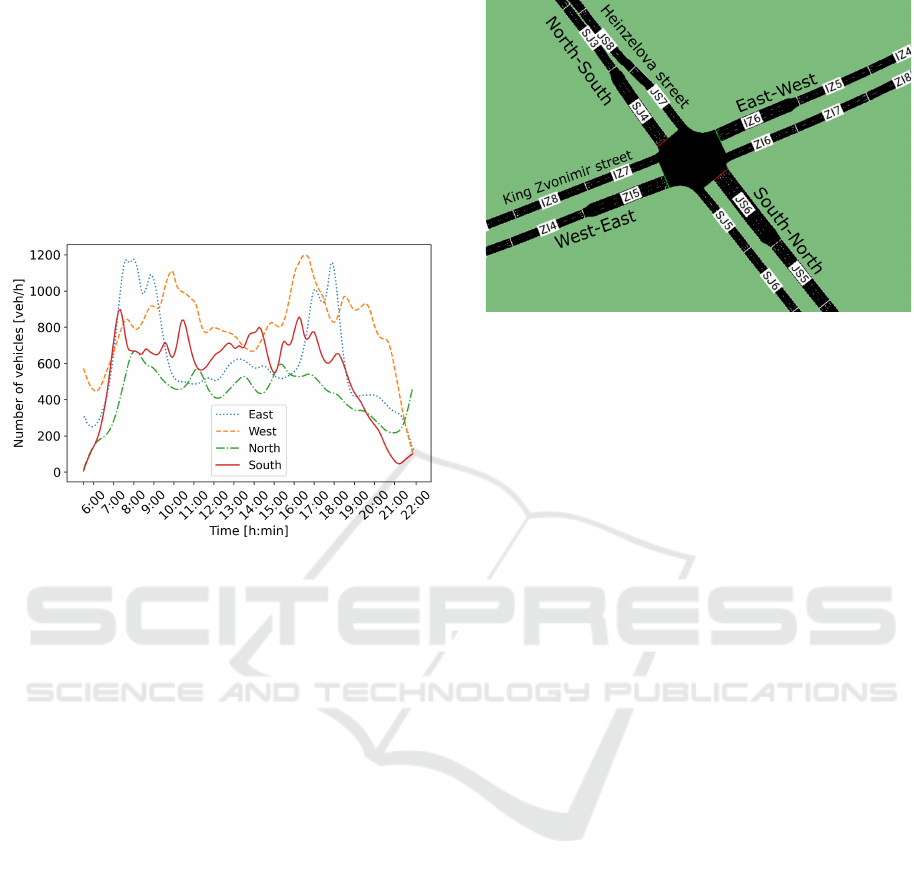
The simulation model is created in the open-
source SUMO microscopic traffic simulator soft-
ware (Behrisch et al., 2011). It represents the inter-
section between Heinzelova street and King Zvonimir
street in the (capital) City of Zagreb, Croatia (Fig. 3).
Intersection Traffic State Estimation using Speed Transition Matrix and Fuzzy-based Systems
195
The model is made based on real-world data, it is part
of the arterial road network of the City of Zagreb, and
it is known for congestions during peak hours.
Fig. 2 shows traffic volumes for each direction
where it can be observed that the morning and after-
noon peak hours are more evident for directions East
and West, while that is not the case with directions
South and North. Although this intersection is prone
to congestion, it has regular traffic flow outside the
peak hours without significant congestions.
Figure 2: Traffic volume for all directions of the simulated
intersection.
Data for traffic demand generation are used
from (Vuji
´
c, 2013) and project SORDITO (Erdeli
´
c
and Ravli
´
c, 2016) augmented with manual measure-
ments. Generated traffic demand in the form of traffic
flow rate (veh/h) and turn probabilities is used as in-
put for the SUMO simulator. It covers 16.5 h of a
typical working day, from 5 : 30 AM to 10 : 00 PM,
including accurate daily traffic signal programs con-
sisting of four different ones based on the Fixed Traf-
fic Signal Control (FTSC) regime. This simulation
does not include pedestrians, but traffic light signal
programs include minimum green light safety inter-
vals for pedestrians (Mileti
´
c et al., 2020).
The configuration of the chosen isolated intersec-
tion is shown in Fig. 3. It is a traffic light signalized
cross intersection with left and right turns for each
traffic direction. To get more precise measurements
the simulation model is divided into 50 m segments
(edges) according to (Ti
ˇ
sljari
´
c et al., 2022) and data
sampling is synchronized with traffic signal control.
The speed limit is set to 50 km/h.
During the simulation, two parameters (speed and
TimeLoss) are extracted for traffic state estimation.
Vehicles were monitored during the simulation, and
their speeds were collected from the simulation to cre-
ate STM. Also, the TimeLoss parameter is recorded
from the simulation. The TimeLoss parameter shows
the total number of seconds vehicles have lost due
Figure 3: Configuration of the isolated intersection used in
this research.
to driving slower than the desired speed, and it is
used for the validation of the method (Behrisch et al.,
2011). Total TimeLoss for a single edge is the sum of
all values for each vehicle crossed over the edge in a
given period of time.
3.2 Intersection State Estimation
Intersection traffic state is represented by applying
a fuzzy-based method that uses attributes extracted
from the STM as input parameters. Road traffic
is modeled using STMs, which are a cell transition
model as proposed in (Ti
ˇ
sljari
´
c et al., 2020). The
STM is a matrix that represent the probability of the
speed change when vehicles are traveling between
two consecutive road segments in the observed time
period ∆t. Every transition is defined with two con-
secutive road segments, e
i
representing the origin
segment, and e
i+1
, representing destination segment.
Harmonic mean vehicle’s speed is computed on the
transition point between e
i
and e
i+1
and placed in the
corresponding STM cell in the ( j,k) position, where
j represents the speed computed for origin segment,
and k represents the speed computed on the destina-
tion segment. Fig. 4 shows two representative exam-
ples of the extracted STMs. Thus, the final form of
the STM is:
X(∆t) =
p
(11)
p
(12)
.. . p
(1k)
p
(21)
.
.
.
.
.
.
.
.
.
.
.
.
.
.
.
p
( j1)
.. . .. . p
( jk)
, (1)
where p
( jk)
represents the probability of the speed
change from j to k on the observed transition at in-
terval ∆t.
ICINCO 2022 - 19th International Conference on Informatics in Control, Automation and Robotics
196
After processing the road traffic data creating
the STMs, the fuzzy-based traffic state estimation
method, adopted from (Ti
ˇ
sljari
´
c et al., 2022) is ap-
plied. The method is based on the traffic pattern posi-
tion extraction, which is represented within the STM.
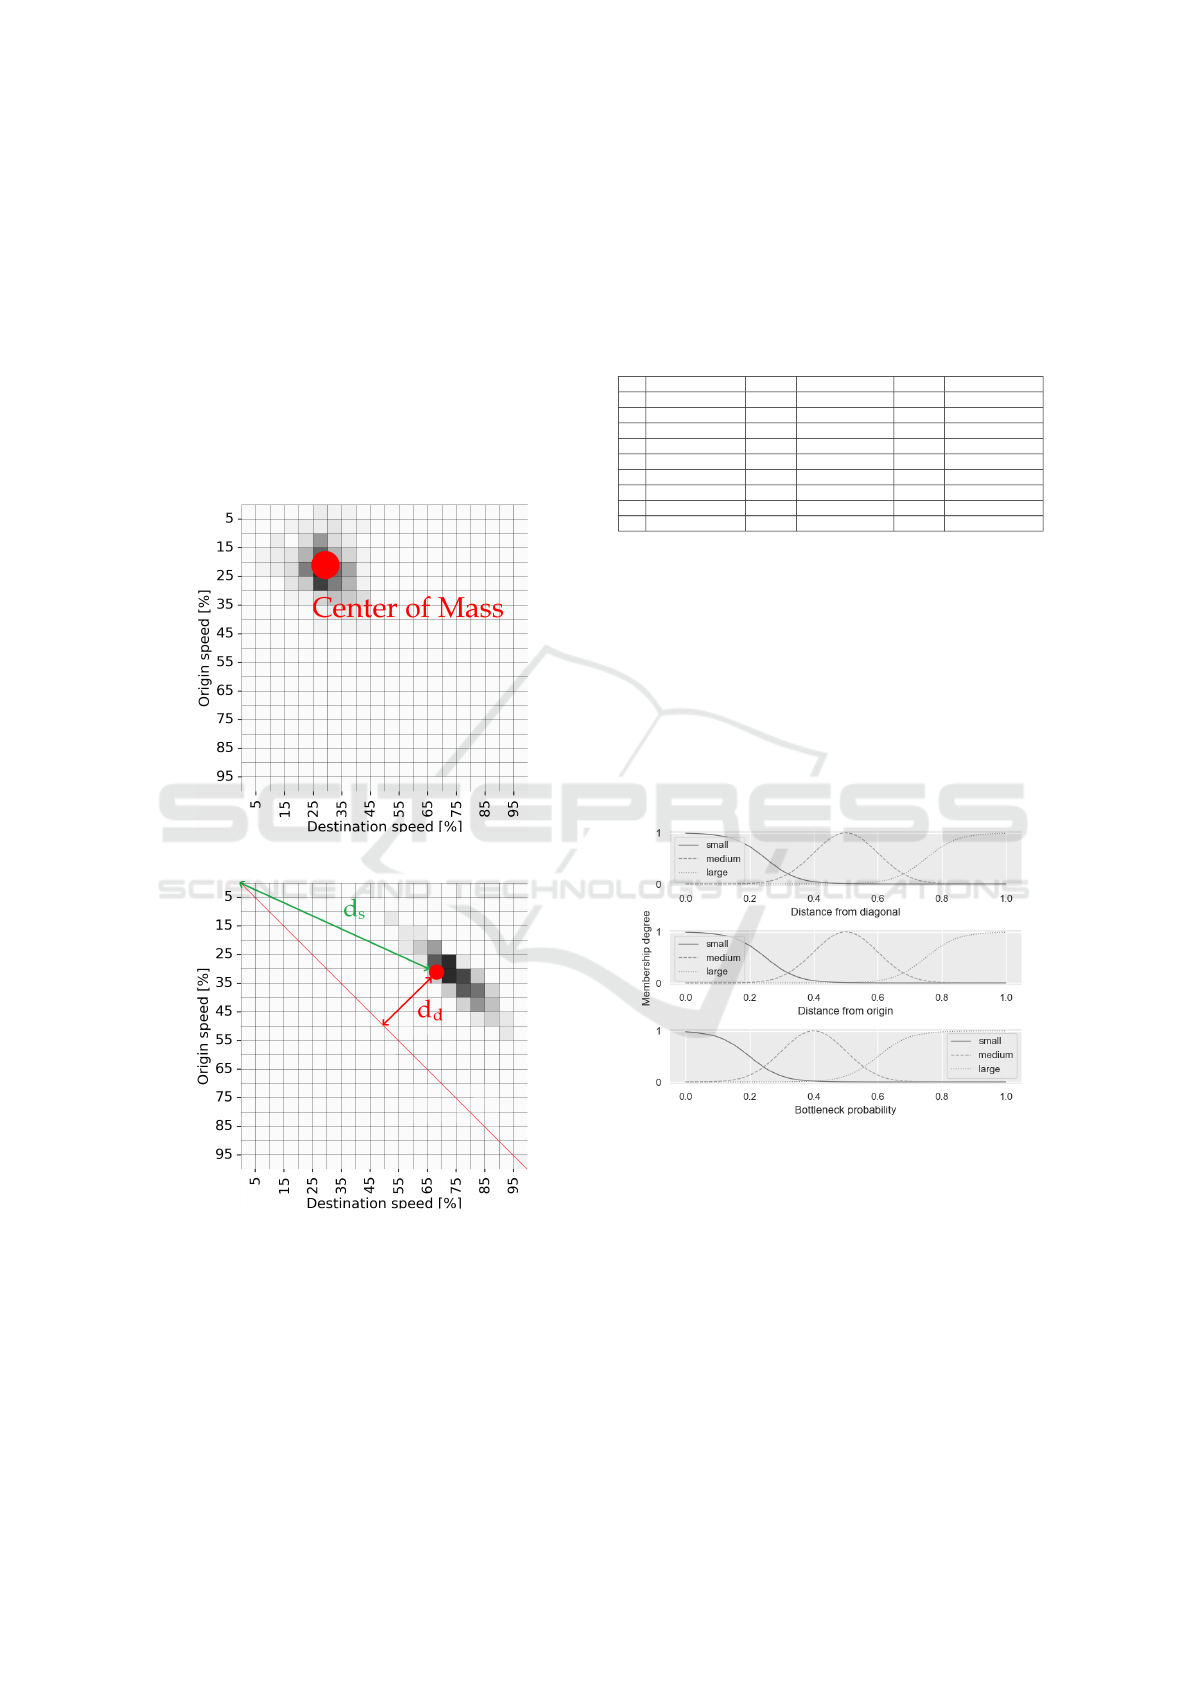
The traffic pattern position is represented by CoM
shown in Fig. 4a. The CoM’s position is the most
important information when working with the traffic
data modeled using STMs because it shows the ob-
served traffic parameter type, which implies the traf-
fic state. In Fig. 4a, congestion as one of the traf-
fic states can be detected because transitions indicate
small speeds on origin and destination segments.
(a) Center of mass estimation for congested
traffic flow
(b) Extraction of attributes from STM
Figure 4: Examples of STMs representing road traffic
states.
There are two attributes extracted from the STM
as input parameters for the fuzzy-based traffic state
estimation (shown in Fig. 4b): distance from the
STM’s source d
s
, and distance from the STM’s diag-
onal d
d
, both computed as the Euclidean distances.
Thus, d
s
is used as a parameter for the congestion
estimation, and d
d
parameter for the anomaly poten-
tial (Ti
ˇ
sljari
´
c et al., 2021). The d
s
and d
d
parameter
computation process is described in (Ti
ˇ
sljari
´
c et al.,
2022). The set of IF − T HEN fuzzy rules used for
bottleneck probability estimation is shown in Table 1.
Table 1: Set of fuzzy rules used for bottleneck probability
estimation (Ti
ˇ
sljari
´
c et al., 2022).
d
D
d
S
p
b
IF d
D
is ”small” AND d
S
is ”small” THEN p
b
is ”large”
IF d
D
is ”small” AND d
S
is ”medium” THEN p
b
is ”medium”
IF d
D
is ”small” AND d
S
is ”large” THEN p
b
is ”small”
IF d
D
is ”medium” AND d
S
is ”small” THEN p
b
is ”medium”
IF d
D
is ”medium” AND d
S
is ”medium” THEN p
b
is ”medium”
IF d
D
is ”medium” AND d
S
is ”large” THEN p
b
is ”small”
IF d
D
is ”large” AND d
S
is ”small” THEN p
b
is ”large”
IF d
D
is ”large” AND d
S
is ”medium” THEN p
b
is ”medium”
IF d
D
is ”large” AND d
S
is ”large” THEN p
b
is ”large”
The membership functions of the input and out-
put variables of the fuzzy-based system are shown
in Fig. 5. The bottleneck probability is the output
of the system with input variables modeled with d
d
and d
s
. Input and output fuzzy based-system vari-
ables are represented as linguistic variables with val-
ues ”small”, ”medium”, and ”large”, with the cor-
responding membership functions z-type, Gaussian,
and s-type functions. The output variable p
b
then
represents the bottleneck probability of the observed
transition at the intersection approach scale to the
value from the interval [0, 1] (Ti
ˇ
sljari
´
c et al., 2022).
Figure 5: Fuzzy-based system setup for the bottleneck prob-
ability estimation.
4 RESULTS
4.1 Intersection State Estimation
Results
A representative example of intersection state estima-
tion results are shown in Fig. 6. The Fig. 6a shows
speeds of vehicles captured with SUMO simulator
software for each edge along a single direction (in this
Intersection Traffic State Estimation using Speed Transition Matrix and Fuzzy-based Systems
197
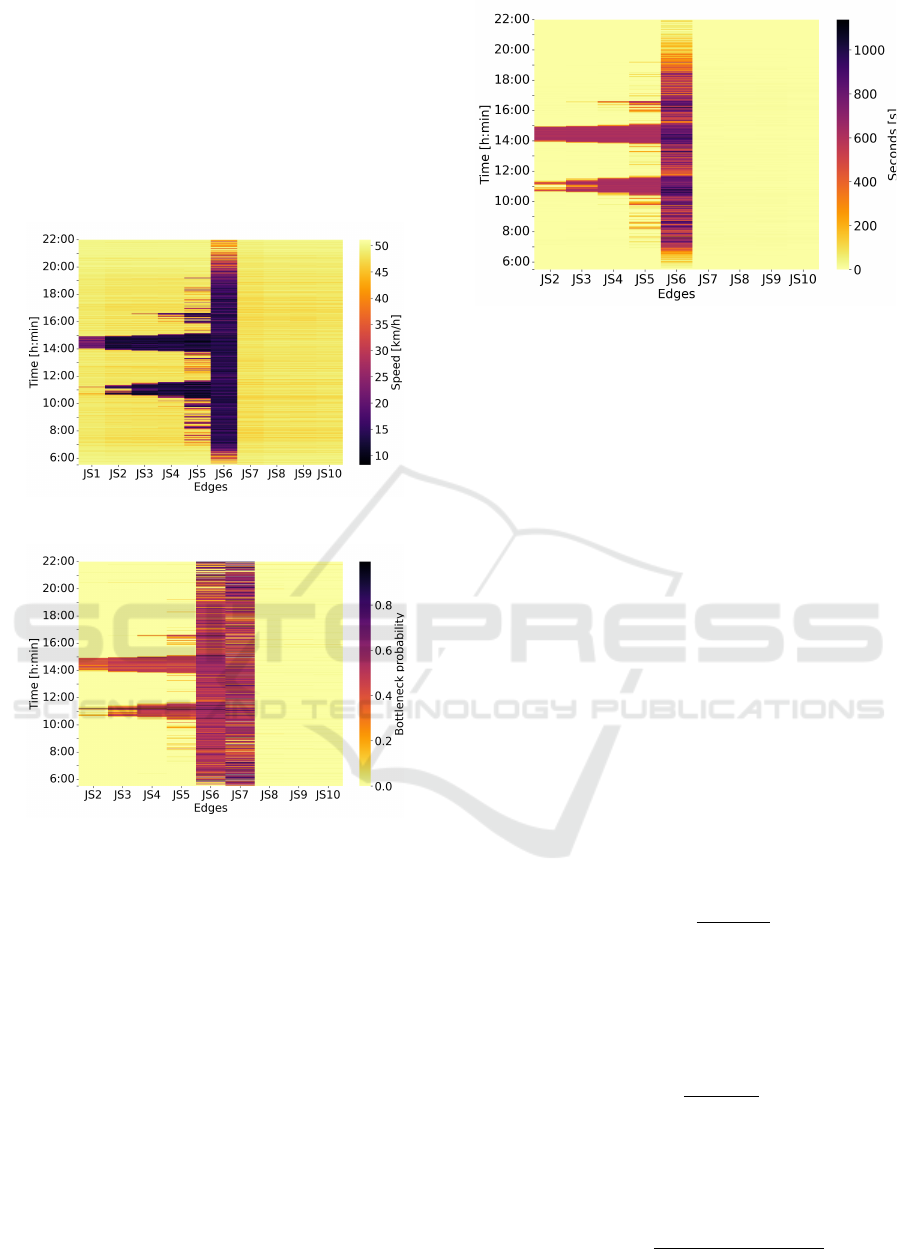
case, direction East-West). It can be observed that the
speeds in front of a traffic light (edge JS6 presented
in Fig. 6a) are lower during the whole day, which is
expected since the vehicles have to slow down or stop
and wait for the green light. Thus, during the rush
hour, slower speeds propagate towards the left side of
the image at specific parts of the day, indicating the
traffic queue propagation due to increased traffic de-
mand and non-optimal traffic signal control.
(a) Harmonic mean vehicles speed extracted from the
simulation
(b) Bottleneck probability
Figure 6: Example of intersection state estimation results.
Fig. 6b is the result of fuzzy inference system
where peak hours can be observed. Additionally, it
can be observed that during the day, the bottleneck
probability is increased on edge JS7. Increased bot-
tleneck probability on edge JS7 is because an STM
reflects speed change. When the vehicles start mov-
ing on the green traffic light signal, the CoM of that
STM will be positioned in the upper right corner. In
that case, d
s
and d
d
are high which results with in-
creased bottleneck probability.
Fig. 7 represents the example of TimeLoss results,
which were collected for each edge during the whole
simulation. It can be observed that the TimeLoss pa-
rameter is increased during peak hours and propagates
towards the left side of the figure in the same way in
Figs. 6a and 6b.
Figure 7: Example of results of TimeLoss parameter.
4.2 Validation
The validation process was conducted using confu-
sion matrices, and results were presented using a con-
fusion matrix and a classification report. The classifi-
cation report contains the total accuracy of the model,
precision, recall, and F1-score for each class. In this
case, class is particular traffic state, and two classes
are detected. Congestion class if there is a traffic light
induced queue forming, and free flow class without
a traffic light queue. Values in the confusion matrix
are represented as a percentage of each class’s total
number of data instances.
For validation purpose, the TimeLoss measure
obtained from the simulation tool is used as the
ground truth data, and the predicted value is the
bottleneck probability. The values in the matrix
represent accuracy as the number of data instances
that are correctly classified. In binary classification,
precision is calculated as the number of true positives
(T P) divided by the total number of TP and false
positives (FP) according to the equation (Brownlee,
2016):
Precision =
T P
T P + FP
. (2)
The recall value is calculated as the number of T P
divided by the total number of T P and false negatives
(FN) according to the following equation (Brownlee,
2016):
Recall =
T P
T P + FN
. (3)
F1-score is calculated as the harmonic mean of
precision and recall according to the following
equation (Brownlee, 2016):
F1 − score =
2 ∗ Precision ∗ Recall
Precision + Recall
. (4)
ICINCO 2022 - 19th International Conference on Informatics in Control, Automation and Robotics
198

The accuracy parameter is used to measure the
accuracy of the model. It is computed as the number
of data instances that were predicted correctly divided
by the number of all predictions made on the test set.
The accuracy parameter is calculated as (Brownlee,
2016):
Accuracy =
T P + T N
T P + T N + FP + FN
, (5)
where T N is the number of true negative predictions.
Table 2 represents validation results for East-West,
West-East, South-North, and North-South directions.
All four traffic directions have high precision and re-
call rate parameters for the Free flow class, which
results in a high value of F1-score. The Congestion
class precision values range from 89% for direction
South-North to 98% for direction North-South. Al-
though South-North’s direction has the lowest pre-
cision of 89%, the recall value is 91%, resulting in
a 90% F1-score, similar to the other two directions,
East-West and West-East.
Table 2: Validation results for all directions.
Direction Precision Recall F1-score
East-West
Free flow 0.99 0.99 0.99
Congestion 0.95 0.90 0.92
Accuracy 0.98
West-East
Free flow 0.98 0.99 0.99
Congestion 0.93 0.87 0.90
Accuracy 0.98
South-North
Free flow 0.98 0.98 0.98
Congestion 0.89 0.91 0.90
Accuracy 0.97
North-South
Free flow 0.99 1.00 0.99
Congestion 0.98 0.96 0.97
Accuracy 0.99
Table 3 represents confusion matrices for the ear-
lier mentioned four directions. The free flow state is
correctly classified at least 98% times. The classifi-
cation is worst performing for the West-East direc-
tion, with 87% correct classification for congestion
class which means in 12% cases, it miss-classifies
congested state as free-flow state, which is overall a
pretty decent result.
Table 3: Confusion matrices for all directions.
Direction
Known
Predicted
Free flow Congestion
East-West
Free flow 0.99 0.01
Congestion 0.09 0.90
West-East
Free flow 0.99 0.01
Congestion 0.12 0.87
South-North
Free flow 0.98 0.02
Congestion 0.08 0.92
North-South
Free flow 0.99 0.01
Congestion 0.04 0.96
5 CONCLUSIONS
In this paper, the possibility of using STM in com-
bination with fuzzy logic to estimate the intersection
state was presented. The research is conducted in
the SUMO simulator and the intersection model is
made based on real-world data. The results from the
microscopic simulator are validated with additional
TimeLoss parameter and confusion matrix. The vali-
dation of the results indicated that this method is suc-
cessful in intersection state estimation with a total ac-
curacy score of 98%. From the results, we can pre-
cisely detect congestion’s temporal and spatial char-
acteristics which match real-world situations.
However, this method has its drawbacks. STM is
sensitive to vehicle speed changes. Whether the vehi-
cle is slowing down or speeding up, it tends to show
increased bottleneck probability which can be mis-
leading. Example of that behavior is shown in results
section. Increased bottleneck probabilities can be ob-
served on the edge JS7 in Fig. 6b, and that edge is af-
ter the traffic light where the vehicles are accelerating.
The impact of such behavior on intersection manage-
ment systems should be considered in future applica-
tions. Another drawback is that it cannot be directly
determined how many vehicles are waiting ahead of
the traffic lights. Although it is possible to detect bot-
tleneck on a specific edge, it cannot be determined
how many vehicles are on that road segment. Also,
the exact length of the waiting queue cannot be deter-
mined. Thus, the future work will be focused on STM
improvement and applying the presented method to
multiple intersections, where the intersection traffic
state estimation will be used as an input parameter for
the intersection control system.
ACKNOWLEDGMENT
This work has been partly supported by the by
the Croatian Science Foundation under the project
IP-2020-02-5042 (DLASIUT), and by the Euro-
pean Regional Development Fund under the grant
KK.01.1.1.01.0009 (DATACROSS). This research
has been carried out within the activities of the Center
of Research Excellence for Data Science and Coop-
erative Systems supported by the Ministry of Science
and Education of the Republic of Croatia. The author
and Ph.D. student
ˇ
Zeljko Majstorovi
´
c from University
of Zagreb Faculty of Transport and Traffic sciences
received a grant from the University of Zagreb for the
publication of this paper.
Intersection Traffic State Estimation using Speed Transition Matrix and Fuzzy-based Systems
199

REFERENCES
Behrisch, M., Bieker-Walz, L., Erdmann, J., and Kra-
jzewicz, D. (2011). SUMO – Simulation of Urban
MObility: An overview. In Proceedings of SIMUL,
volume 2011.
Borlea, I.-D., Precup, R.-E., Borlea, A.-B., and Iercan,
D. (2021). A unified form of fuzzy c-means and k-
means algorithms and its partitional implementation.
Knowledge-Based Systems, 214:106731.
Brownlee, J. (2016). Deep Learning With Python. Machine
Learning Mastery.
Chow, A. H., Santacreu, A., Tsapakis, I., Tanasaranond, G.,
and Cheng, T. (2014). Empirical assessment of urban
traffic congestion. Journal of advanced transporta-
tion, 48(8):1000–1016.
D’Andrea, E. and Marcelloni, F. (2017). Detection of traf-
fic congestion and incidents from GPS trace analysis.
Expert Systems with Applications, 73:43–56.
Erdeli
´
c, T. and Ravli
´
c, M. (2016). SORDITO - System for
Route Optimization in Dynamic Transport Environ-
ment. PROMET - Traffic&Transportation, 28(2):193–
194.
He, Z., Qi, G., Lu, L., and Chen, Y. (2019). Network-wide
identification of turn-level intersection congestion us-
ing only low-frequency probe vehicle data. Trans-
portation Research Part C: Emerging Technologies,
108:320–339.
Kan, Z., Tang, L., Kwan, M.-P., Ren, C., Liu, D., and Li,
Q. (2019). Traffic congestion analysis at the turn level
using taxis’ GPS trajectory data. Computers, Environ-
ment and Urban Systems, 74:229–243.
Koukol, M., Zaj
´
ı
ˇ
ckov
´
a, L., Marek, L., and Tu
ˇ
cek, P. (2015).
Fuzzy logic in traffic engineering: a review on sig-
nal control. Mathematical Problems in Engineering,
2015.
Kumm, M. and Schreckenberg, M. (2019). An agent-
based approach to a temporal headway development
statistics in urban traffic using three-phase theory. In
ICAART (1), pages 238–243.
Lee, S., Wong, S., and Li, Y. (2015). Real-time estima-
tion of lane-based queue lengths at isolated signalized
junctions. Transportation Research Part C: Emerging
Technologies, 56:1–17.
Liu, H. X., Wu, X., Ma, W., and Hu, H. (2009). Real-time
queue length estimation for congested signalized in-
tersections. Transportation research part C: emerging
technologies, 17(4):412–427.
Maldonado, S., L
´
opez, J., and Vairetti, C. (2021). Time-
weighted fuzzy support vector machines for classifica-
tion in changing environments. Information Sciences,
559:97–110.
Mileti
´
c, M., Ku
ˇ
si
´
c, K., Greguri
´
c, M., and Ivanjko, E.
(2020). State complexity reduction in reinforcement
learning based adaptive traffic signal control. In 2020
International Symposium ELMAR, pages 61–66.
Papageorgiou, M., Diakaki, C., Dinopoulou, V., Kotsialos,
A., and Wang, Y. (2003). Review of road traffic con-
trol strategies. Proceedings of the IEEE, 91(12):2043–
2067.
Pozna, C. and Precup, R.-E. (2014). Applications of signa-
tures to expert systems modelling. Acta Polytechnica
Hungarica, 11(2):21–39.
Rostami Shahrbabaki, M., Safavi, A. A., Papageorgiou, M.,
and Papamichail, I. (2018). A data fusion approach
for real-time traffic state estimation in urban signal-
ized links. Transportation Research Part C: Emerging
Technologies, 92:525–548.
Seo, T., Bayen, A. M., Kusakabe, T., and Asakura, Y.
(2017). Traffic state estimation on highway: A com-
prehensive survey. Annual reviews in control, 43:128–
151.
Shuttleworth, J. (2019). SAE Standards News: J3016
automated-driving graphic update. https://www.sa
e.org/news/2019/01/sae-updates-j3016-automated-d
riving-graphic, Jan. 2019.
Ti
ˇ
sljari
´
c, L., Cari
´
c, T., Abramovi
´
c, B., and Fratrovi
´
c, T.
(2020). Traffic state estimation and classification on
citywide scale using speed transition matrices. Sus-
tainability, 12(18).
Ti
ˇ
sljari
´
c, L., Erdeli
´
c, T., and Cari
´
c, T. (2018). Analysis of
intersection queue lengths and level of service using
GPS data. In 2018 International Symposium ELMAR,
pages 43–46.
Ti
ˇ
sljari
´
c, L., Fernandes, S., Cari
´
c, T., and Gama, J. (2021).
Spatiotemporal road traffic anomaly detection: A
tensor-based approach. Applied Sciences, 11(24).
Ti
ˇ
sljari
´
c, L., Vrbani
´
c, F., Ivanjko, E., and Cari
´
c, T. (2022).
Motorway bottleneck probability estimation in con-
nected vehicles environment using speed transition
matrices. Sensors, 22.
Vuji
´
c, M. (2013). Dynamic priority systems for public
transport in urban automatic traffic control. PhD the-
sis, Faculty of Transport and Traffic Sciences, Univer-
sity of Zagreb.
Wang, Y., Yang, X., Liang, H., and Liu, Y. (2018). A review
of the self-adaptive traffic signal control system based
on future traffic environment. Journal of Advanced
Transportation, 2018:1–12.
ICINCO 2022 - 19th International Conference on Informatics in Control, Automation and Robotics
200
