
Sensorless Condition Monitoring of Feed Axis Components in
Production Systems by Applying Prony Analysis
Chris Schöberlein, Johannes Quellmalz, Holger Schlegel and Martin Dix
a
Institute for Machine Tools and Production Processes, Chemnitz University of Technology, Reichenhainer Str. 70,
09126 Chemnitz, Germany
Keywords: Electromechanical Axis, Condition Monitoring, Prony Analysis, Data Acquisition.
Abstract: Condition monitoring of modern production systems has established itself as an independent area of research
in recent years. Main goal is to achieve an increase in machine productivity by reducing downtime and
maintenance costs. In particular, the installed electromechanical axes offer great potential for improvement.
Besides an installation of additional sensors, modern drive systems also provide various signals suitable for
superordinated monitoring systems. The paper presents a novel approach for monitoring of specific
mechanical axis components based solely on internal control loop signals. Fundamental idea is to combine a
parametric approach for vibration analysis, the so-called Prony analysis, with a drive-based setpoint
generation and data aquisition. The method is verified by detecting emulated malfunctions on a single-axis
test stand and a three-axis vertical milling machining center. Experimental investigations prove that the
presented approach is capable of reliably detecting the artificially introduced defects on different axis
components.
1 INTRODUCTION
In modern production systems, electromechanical
feed axes realize the required motion profiles. In the
case of metal-cutting machine tools, they generate the
feed movements, thus maintain chip removal as well
as all other necessary positioning, infeed and tool
change movements. In the field of forming
technology, servo screw presses gain more and more
attention. One ore more electromechanical axes
generate the main process movements for different
forming processes (Sewohl et. al., 2018). In addition,
electromechanical systems are also installed in
production systems for conveying, positioning and
synchronization applications, in printing and textile
machines as well as in packaging, filling and
assembly systems. Altintas states that
electromechanical axes, together with the main drive,
determine the work accuracy and productivity of
modern production systems to a particular extent
(Altintas et al., 2017). Figure 1 illustrates the general
structure of such an axis. It consists of an electrical
part including an industrial control, a drive system
with servomotor and the associated position
a
https://orcid.org/0000-0002-2344-1656
measuring systems, as well as a mechanical part. In
the case of linear feed axes, the latter is usually
designed as a ball screw drive with comprising
coupling, bearing and gear elements. The main causes
for unplanned malfunctions of feed axes arise from
errors in the mechanical subsystem and frequently
result in downtime of the machine tool itself (Plapper
and Weck, 2001). Therefore, goal of progressive
research efforts is to detect damage on mechanical
axis components prematurely and derive consecutive
maintenance strategies with minimum downtime and
costs. In addition, the utilization of drive-internal
measuring systems makes additional sensors
redundant.
Content of the paper is a novel methodology for
monitoring mechanical components of feed axes
based on characteristic frequency components. In the
context of this paper, the term sensorless denotes that
the approach utilizes only signals available in the
drive internal control loops and therefore does not
require the installation of additional sensors.
Furthermore, it is applicable during regular machine
operation. In contrast to established methods based on
frequency spectra analysis (e.g. Bellini and Tassoni
214
Schöberlein, C., Quellmalz, J., Schlegel, H. and Dix, M.
Sensorless Condition Monitoring of Feed Axis Components in Production Systems by Applying Prony Analysis.
DOI: 10.5220/0011287200003271
In Proceedings of the 19th International Conference on Informatics in Control, Automation and Robotics (ICINCO 2022), pages 214-221
ISBN: 978-989-758-585-2; ISSN: 2184-2809
Copyright
c
2022 by SCITEPRESS – Science and Technology Publications, Lda. All rights reserved
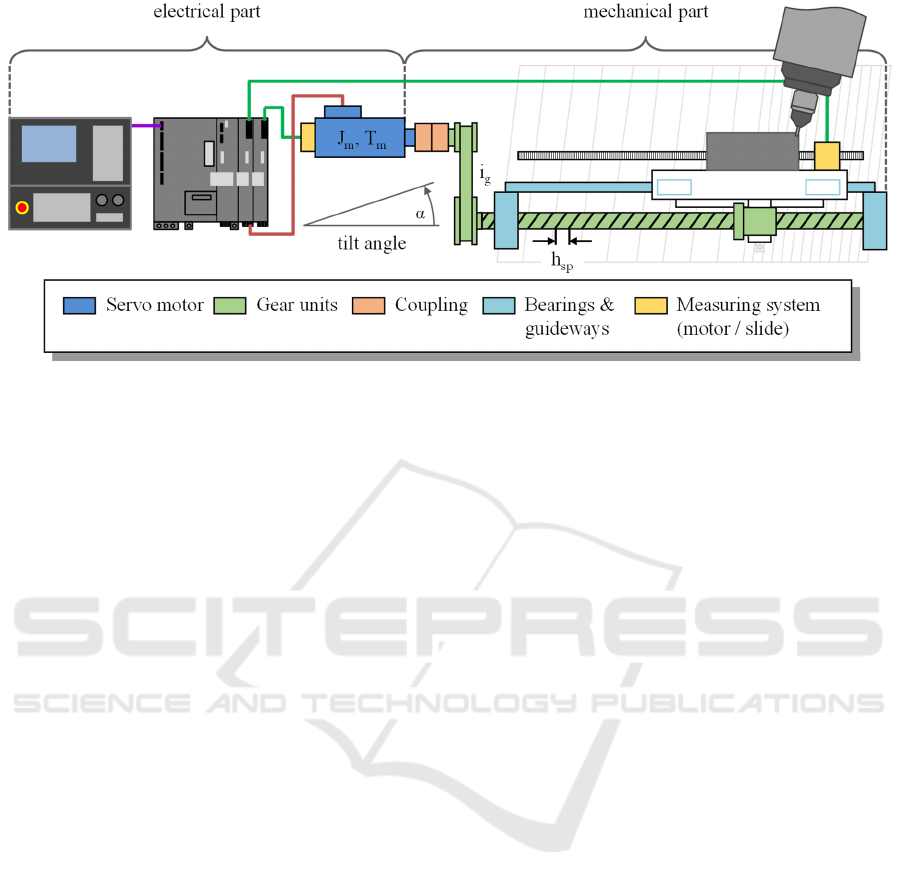
Figure 1: Schematic structure of a typical electromechanical fedd axis.
2008, Huang et al., 2020) or methods of time-
frequency analysis (e.g. Putz et. al., 2018), a
parametric signal analysis method is used, the so-
called Prony analysis. This approach was already
successfully applied for the assessment of drive
control loops (Neugebauer et al., 2011) or
characterization of mechanical transfer systems
(Schöberlein et al., 2017). Within the scope of this
paper, we extend the analysis method by an
automatic, partially invasive test signal application
combined with simultaneous data recording for
machine tool controls. Functionality is demonstrated
in two exemplary cases: detection of an emulated
damage on a feed-axis coupling as well as
determining preload changes in belt drive systems.
The paper has the following structure. In chapter
2, the basics of prony analysis are explained initially.
Subsequently, the overall methodology including
automatic test signal generation and data recording is
presented. Chapter 3 shows a single-axis test stand for
detecting emulated coupling defects as well as a
machine tool for belt drive monitoring. Core of the
paper is chapter 4 inlcuding experimental
investigations on previously described test scenarios.
The paper closes with a summary and an outlook on
further research topics.
2 METHODOLOGY
2.1 Fundamentals
Similar to Fourier transform, Prony analysis allows
the decomposition of a signal into its spectral
components. Main difference is that Prony analysis is
a parametric method. Due to the low number of
required measurement points, short term signals such
as impulse or step responses can also be evaluated,
which is almost impossible with conventional Fourier
analysis (Neugebauer et al., 2011).
The measured input signal is represented as a sum
of individual, damped sine oscillations. Starting point
is a time signal 𝑥
sampled equidistantly with
sampling time 𝑇
, which is reproduced as sum of
complex functions 𝑥
(Eq. 1).
𝑥
=𝑏
∙𝑧
(1)
𝑏
=
𝐴
∙𝑒
(2)
𝑧
=𝑒
∙
(3)
Substituting (2) and (3) into (1), applying Euler's
formula results in a sum of 𝑝 damped sinusoidal
signals of magnitude 𝐴
, angular frequency 𝜔
,
initial phase 𝛷
as well as damping ratio 𝛼
. For
details on mathematical derivation and
implementation, consider (Schönherr et al., 2011.).
By specifying a fixed model order 𝑝 and subsampling
𝑛∙𝑇
of the input signal, the analysis can be adapted
to specific frequency ranges.
Figure 2 shows the result of a Prony analysis for
an exemplary signal curve. The input signal is the
control deviation after a speed setpoint step, recorded
on an exemplary drive test stand. The measured signal
(black) is represented by four damped sinoids
(dashed) whose sum (green) leads to an appropriate
approximation of the input response.
Sensorless Condition Monitoring of Feed Axis Components in Production Systems by Applying Prony Analysis
215
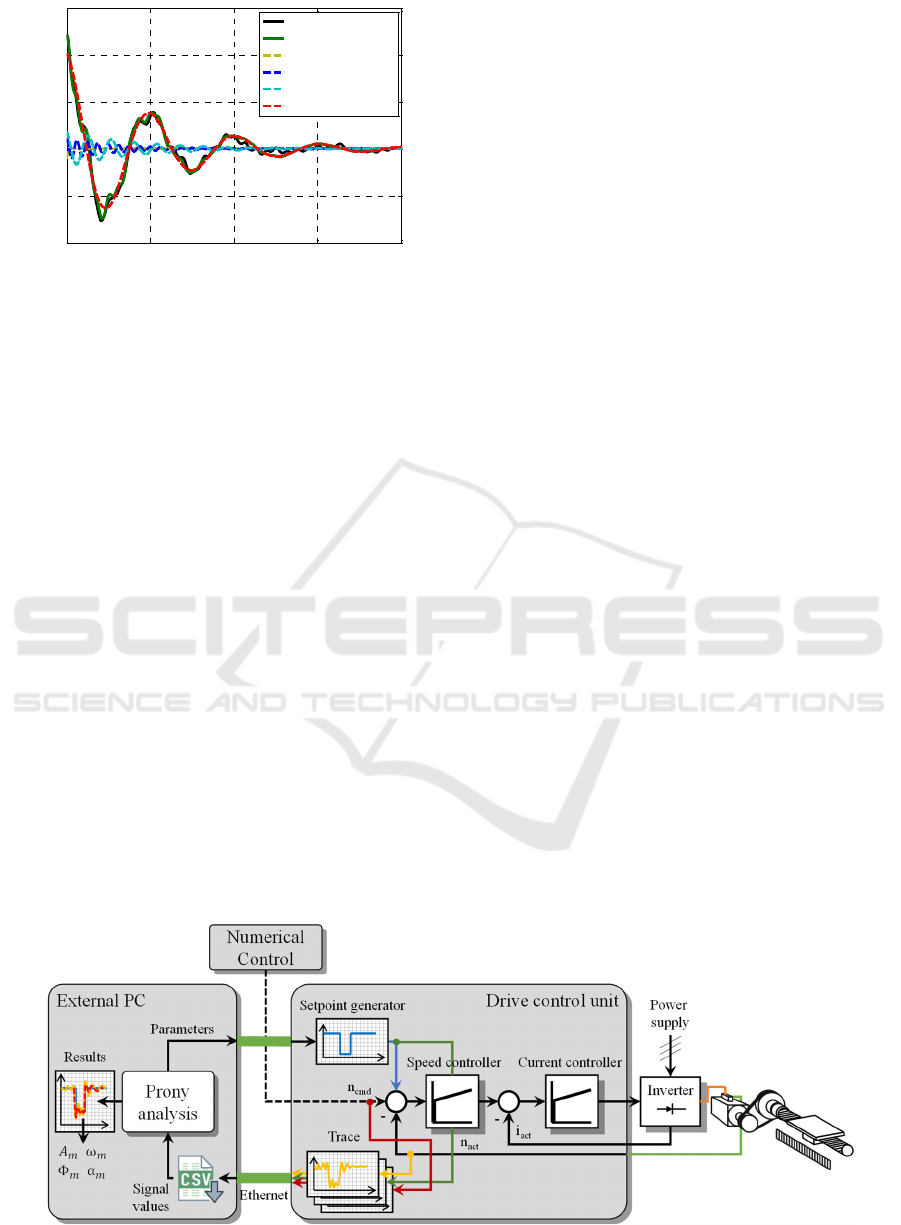
Figure 2: Application of Prony analysis to an exemplary
input signal.
2.2 Overall Concept
Application of the described method for monitoring
mechanical components of feed axes is carried out by
using the overall approach shown in Figure 3. The
electromechanical feed axis is excited during
conventional operation mode with a superimposed
setpoint impulse at level of the speed control loop.
This ensures an excitation over a broad frequency
range. At the same time, speed setpoint and actual
values are recorded utilizing the drive-internal
oscilloscope (trace function). Note that control and
drive systems usually include all necessary functions
for setpoint generation and signal recording.
However, one usually controls them manually during
axis commissioning or for diagnostic purposes. In
order to apply the presented method autonomous
during regular machine operation, an interface
software developed in (Hellmich et al., 2016,
Schöberlein et al., 2018) was utilized. It connects an
external computer to the machine control via Ethernet
connection and grants remote access to all drive
parameters and functions. Data storage via CSV-files
ensures further processing of the logged signals.
Subsequently, the recorded signal is decomposed into
its spectral components using an application-
dependent parameterized Prony analysis. Based on
calculated vibration parameters, one can derive
statements on the condition of specific axis
components. The assignment of the considered
vibration component to a concrete axis component is
based on previously recorded frequency response
analysis. The required data is usually available during
commissioning of the axis.
3 TEST SETUP
Functional verification of the presented approach is
performed on a single-axis test rig and a machine tool
feed axis. Both systems are equipped with Siemens
drive and control systems. These systems already
provide a parameterizable setpoint generator in the
drive control unit, which allows generating specific
test signals (square wave, sine wave, binary noise
signal) at various input points of the control loops.
Furthermore, it provides an internal oscilloscope
(trace function) for recording time signals with
maximum sample frequency of the drive control unit.
Smallest achievable sampling time for both test
stands is 𝑇
= 125 µ𝑠.
3.1 Rotary Axis
In the first experiment, we emulate an exemplary
damage of a feed-axis coupling on a rotary single-
axis. As shown in Figure 4 on the left side the
corresponding test stand consists of a servo motor, a
coupling, a bearing block as well as optional
additional weights. The control is a motion control
type SIMOTION D445 with a SINAMICS S120 drive
system. The artificially introduced defect is simulated
Figure 3: Overall concept of the sensorless monitoring strategy.
0 20 40 60 80
-200
-100
0
100
200
300
time [ms]
control error [1/min]
measurement
prony estimation
component 1
component 2
component 3
component 4
ICINCO 2022 - 19th International Conference on Informatics in Control, Automation and Robotics
216

Figure 4: Rotary single-axis test stand (left) and machine tool feed axis with belt drive (right).
by loosening a single lamella connection screw of the
coupling (cf. Figure 4). Drive-internal system
excitation and recording of measured values are
controlled manually via an engineering system.
Calculation of Prony method and analysis of the
results follows the finished data aquisition in Matlab.
3.2 Linear Feed Axis
The second functional verification is performed on a
machine axis (x-direction) installed in a DMG Mori
DMC850V three-axis vertical milling machining
center (Figure 4, right). The machine tool is equipped
with Sinumerik 840D sl CNC control as well as
Sinamics S120 drive system. Additional
measurements via reflexion sensor confirm correct
preload setting of the belt drive. A laptop connected
to the controller includes all necessary
communication interface for writing and reading
required drive parameters and signals. Consequently,
test signal generation and recording run fully
automated (cf. Figure 3). Prony method estimates the
corresponding parameters externally on the laptop
after recording is completed. As an exemplary wear
feature, the loss of preload of the toothed belt drive is
simulated.
4 EXPERIMENTAL RESULTS
4.1 Rotary Axis Test Stand
Main objective is to detect malfunctions on axis
couplings represented by an artificially introduced
fault in form of a loosened lamella connection screw.
Measurements are performed with and without
defect. The mechanical configuration corresponds to
Figure 4 without additional mass on output side. First,
we suggest detecting the introduced defect using
conventional spectral analysis in frequency domain.
For this purpose, the system is excited by a pseudo-
binary noise signal at torque level. Simultaneously,
internal trace function records motor torque and
speed. After transforming all time signals into
frequency domain, frequency response function is
plottet in a Bode diagram. Considering Figure 5, one
cannot make a clear distinction between functional
and damaged coupling. Although a horizontal shift of
the mechanical natural frequency is observable in
magnitude and phase response, this could also result
from deviations in repeated measurements of the
frequency responses. Furthermore, the analysis
provides the result only in form of a frequency
response, which is not easy to interpret without expert
knowledge. For direct access, its further processing to
characteristic values (e.g. natural frequency) is
necessary.
Figure 5: Frequency response function of the speed control
plant.
One advantage of Prony method is that all
parameters necessary for an interpretation of the
vibration components are direct result of the analysis.
10
1
10
2
10
3
frequency in Hz
-30
10
5
0
coupling ok
coupling damaged
10
1
10
2
10
3
fre
q
uenc
y
in H
z
-180
-90
0
90
180
Sensorless Condition Monitoring of Feed Axis Components in Production Systems by Applying Prony Analysis
217
Therefore, the methodology described in section 2.2
is applied. All specified parameters for setpoint
generator and Prony analysis are listed in Table 1.
The axis is moved at constant speed of 200 min
-1
with
closed control loops for speed and current.
Table 1: Parameters for rotary axis test stand.
Paramete
r
Value
Spee
d
offset 200 min
-1
Im
p
ulse ma
g
nitude -100 min
-1
Im
p
ulse duration 500
µ
s
Sam
p
le time 125
µ
s
Recording time 50 ms
Analysis time 15 ms
Model orde
r
4
Subsam
p
lin
g
facto
r
2
Fre
q
uenc
y
ran
g
e 1200
–
1400 Hz
Simultaneously, the signal generator creates a
speed setpoint pulse with absolute magnitude of 100
min
-1
and duration of 500 µs while the drive-internal
trace function simultaneously records signals for
setpoint and actual speed. Subsequently, Prony
method with model order 𝑚=4 and subsampling
time 𝑇
,
= 2∙𝑇
is calculated. Based on
preliminary tests (cf. Figure 5), the model component
with a frequency in the range of 1200 Hz to 1400 Hz
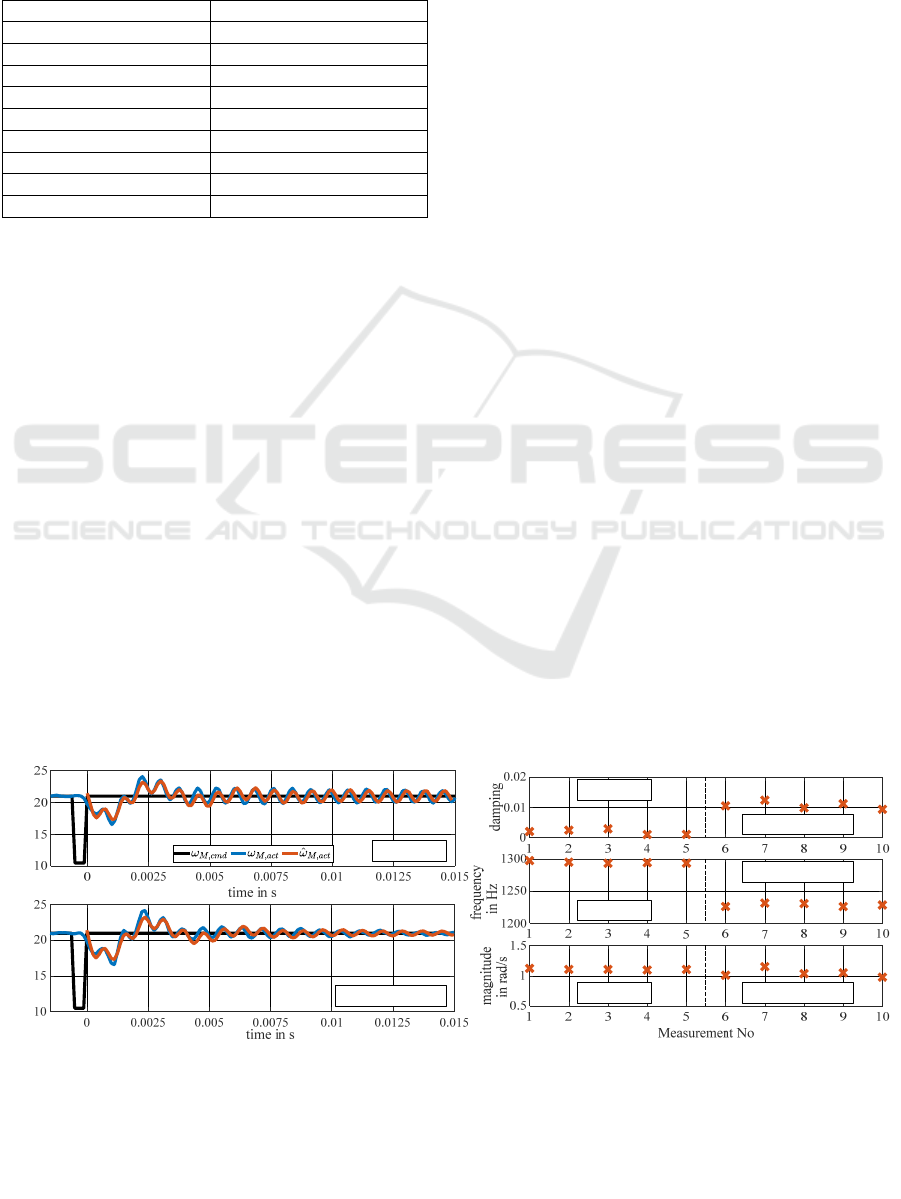
is selected. Figure 6a shows the estimation results
without defect (top) and with loosened connecting
screw (bottom). Comparing the measured time
signals and Prony estimation, one may recognize
slight differences in decay behavior. By repeating the
described procedure five times each with intact and
damaged coupling while plotting all output
parameters (damping, frequency, amplitude) of Prony
analysis individually above test number, one gets the
picture shown in Figure 6b. Note that measurements
one to five represent the undamaged case while six to
ten show results with damaged coupling. Especially
in the damping values, significant differences occur.
Thus, the value is approximately 𝐷 = 0.002 in the
intact case and in damaged case around 𝐷 = 0.011.
Although there occur clear differences regarding the
frequency values (Figure 6b, center), tests with
additional mass have shown that these are
occasionally subject to significant fluctuations.
Investigations for linear feed axis in the following
section confirm this conclusion. Eventually, it can be
stated that clear distinctions are possible between
undamaged and damaged coupling considering the
damping value of Prony estimation.
4.2 Linear Feed Axis
In the next step, the described method is applied on a
linear feed axis of a machine tool. Main objective is
to detect changes in preload of the installed toothed
belt drive (cf. Figure 4, right). The procedure
corresponds to the schematic diagram in Figure 3 and
previous investigations on the single-axis test rig,
respectively. Only difference is the autonomous
setpoint connection and signal recording parallel to
conventional NC operation. Consequently, all control
loops (position, speed and current) are closed. The
axis moves at constant feed rate of 2000 mm/min.
Magnitude of the superimposed reference pulse is set
to 50 min
-1
. Recording duration and sample time
remain unchanged. For model order and subsampling
time, previous experiments showed that the values
listed in Table 2 lead to better results. Frequency
range of the analysis was again determined based on
preliminary tests analogous to the single-axis test
stand. According to the manufacturer, correct belt
tension is present when the manual measurement with
reflexion sensor reaches an oscillation frequency of
approximately 130 Hz. By applying drive based
excitation and calculating the frequency response
Figure 6: Prony estimation (a) and calculated values for intact and damaged axis coupling (b).
rotational speed in rad/s
rotational speed in rad/s
a)
b
)
coupling ok
coupling damaged
coupling ok
coupling ok
coupling ok coupling damaged
coupling damaged
coupling damaged
ICINCO 2022 - 19th International Conference on Informatics in Control, Automation and Robotics
218
function, this leads to a characteristic natural
frequency of approximately 300 Hz. Therefore, we
suggest to set the observed frequency range for the
Prony analysis as listed in Table 2
Table 2: Parameters for linear feed axis.
Paramete
r
Value
Speed offse
t
2000 mm/min
Impulse ma
g
nitude
50 min
-1
Impulse duration
500 µs
Sample time
125 µs
Recordin
g
time
50 ms
Anal
y
sis time
15 ms
Model orde
r
8
Subsamplin
g
facto
r
5
Frequenc
y
ran
g
e
250 – 400 Hz
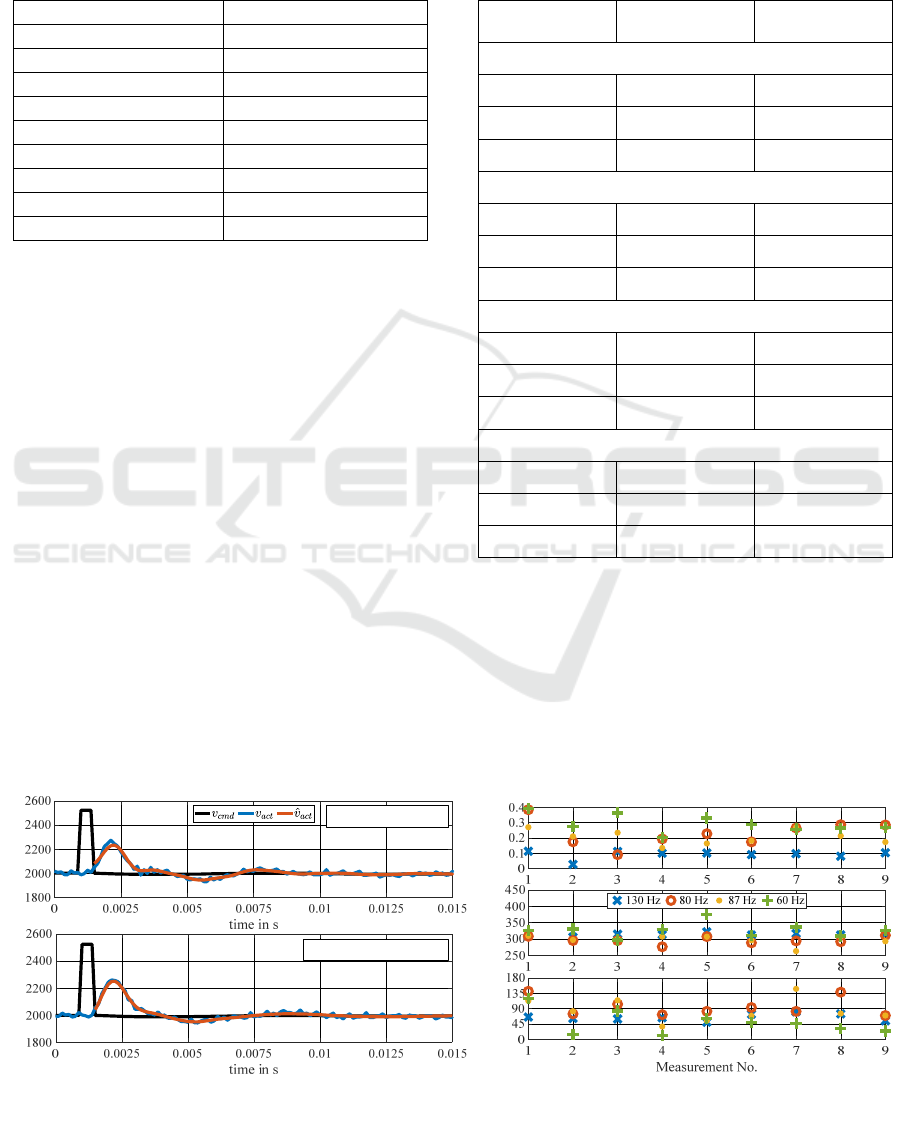
In a first test, the belt tension was significantly
reduced so that manual measurements with reflexion
sensor lead to a frequency drop from 130 Hz to 60 Hz.
Results of the subsequent Prony analysis are shown
in Figure 7a. Again, no significant differences in the
signal curves are visible at first sight. However, there
occur large differences in the calculated damping
values. For correct preloaded belt drive, Prony
analysis estimates a damping value of
𝐷 = 0.100. On the other hand, with reduced tension
the approach calculates the damping value to
𝐷 = 0.329 . If one repeats the measurement at
different points over the whole travel range of the axis
(Figure 7b, blue crosses and orange circles), single
measurements may sometimes lead to unambiguous
results (e.g. measurement No. 3). This can be
countered by a cyclically recurring application and
subsequent averaging of the calculated parameters
(cf. Table 3). In real operation mode, however, there
is no sudden, but rather gradual drop in belt preload.
Consequently, resolution of the analysis is crucial for
practical applicability and therefore the method must
reliably detect slow tension losses. For this reason,
further tests were carried out in which the preload was
changed in smaller steps.
Table 3: Results of the Prony analysis for linear feed axis.
Parameter Average
Standard
deviation
Preload appropriate (130 Hz)
𝛼
(-)
0.10 0.02
𝜔
(Hz)
316.80 9.20
𝐴
(mm/min)
61.58 15.37
Preload not appropriate (87 Hz)
𝛼
(-)
0.20 0.04
𝜔
(Hz)
297.50 14.40
𝐴
(mm/min)
85.22 33.85
Preload not appropriate (80 Hz)
𝛼
(-)
0.23 0.09
𝜔
(Hz)
296.20 10.70
𝐴
(mm/min)
95.43 31.81
Preload not appropriate (60 Hz)
𝛼
(-)
0.29 0.06
𝜔
(Hz)
326.70 22.10
𝐴
(mm/min)
49.22 34.93
Note that a correctly pretensioned belt drive has a
natural frequency of 130 Hz when measured
manually by reflexion sensor. Figure 7b shows the
results for different preloads and several
measurements at different points over the whole
travel range of the axis. Considering the individual
values, it becomes clear that a single measurement
Figure 7: Prony estimation (a) and calculated values for gradually reduced belt drive preload (b).
damping
frequency
in Hz
magnitude
in mm/min
velocity in mm/min
velocity in mm/min
a)
b
)
preload ok (130 Hz)
preload reduced (60 Hz)
Sensorless Condition Monitoring of Feed Axis Components in Production Systems by Applying Prony Analysis
219

can once again lead to incorrect conclusions
regarding the belt configuration. However, if one
calculates average values of the identified parameters
as well as their standard deviation (cf. Table 3), the
damping values of the associated vibration
component provide a clear result. In case of the
frequency values, which can be considered as an
alternative comparison criterion, a distinction is not
always possible (e.g. between 87 Hz and 80 Hz.
Furthermore, when preload is reduced down to 80 Hz,
a drop in average frequency is obervable, which,
however, increases again in case of 60 Hz. The same
applies in reverse for the magnitude values. Only the
average damping increases proportionally to the
reduction in preload and therefore provides a suitable
feature for superimposed condition monitoring and
diagnosis.
5 SUMMARY AND CONCLUSION
The paper presents a novel approach for sensorless
condition monitoring of mechanical parts of
electromechanical axis by applying Prony analysis.
Main advantages of the approach are the partially
invasive applicability during conventional machine
operation without dismantling any axis components.
Due to the exclusive utilization of drive internal
signals, no additional sensors are required. In contrast
to conventional Fourier analysis, Prony analysis
decomposes a signal into a series of damped
sinusoidal oscillations. In addition, characteristic
oscillation parameters (magnitude, frequency,
damping, phase angle) are directly calculated output
parameters. A communication interface for NC
controls including automated setpoint generation as
well as drive signal acquisition qualifies the method
for application during regular machine operation.
This was proven by extensive experimental
investigations. Initially, fundamental verification was
demonstrated on an exemplary rotational single-axis
test rig. The method was able to detect an artificially
introduced damage (loosening of a lamellaa
connecting screw) by changes in calculated damping
values. The subsequent application on the linear axis
of a conventional three-axis machine tool shows the
capability of the approach. Component damage was
simulated by reducing preload of the installed toothed
belt drive. However, the experiments led to the
conclusion that cyclically recurring analysis is
necessary for reliable results. Nonetheless, the
average damping values are able to display slow
changes in preload.
Future research activities should investigate to
what extent the methodology is able to detect
malfunctions on other axis parts (e.g. bearing
damage). In particular, with regard to the industrial
application of the method, reliable threshold values
must be defined which classify a component as
defective. Suitable reference values can be identified
by determining parameters during machine
commissioning. In addition, suitable times for
connecting the test signal must be specified regarding
practical applicability on machine tools. One possible
solution is to analyze the current machining program
and identify safe motion areas for superimposition
(e.g. rapid movements, tool change movements). By
connecting a data storage with parameter history as
well its combination with an enterprise resource
planning system, an extended diagnosis with a
suitable maintenance strategy and spare parts supply
is possible.
ACKNOWLEDGEMENTS
Funded by the Federal German Ministry for
Economic Affairs and Climate Action.
REFERENCES
Sewohl, A. et al. (2018). Root Cause Analysis of Deep
Drawing Processes with Superimposed Low-Frequency
Vibrations on Servo-Screw Presses: A practical
Research on Predictability in Simulation, In
Proceedings of the 15
th
International Conference on
Informatics in Control, Automation and Robotics
Research (INCINCO 2018) 2, pp. 621-627.
Altintas, Y. et al. (2011). Machine tool feed drives, In:
CIRP Annals – Manufacturing Technology 60, pp. 779-
796.
Plapper, V. and Weck, M. (2001). Sensorless Machine Tool
Condition Monitoring based on open NCs, In:
Proceedings of the 2001 IEEE International
Conference on Robotics & Automation, pp. 3104-3108.
Bellini, A. and Tassoni, C. (2008). Diagnosis of bearing
faults in induction machines by vibration or current
signals: a critical comparison. In: IEEE Transac-tions
on Industry Applications 46 (4), pp.1350-1359.
Huang, X. et al. (2020). A Novel Condition Monitoring
Signal Analysis Method of Numerical Control Machine
Tools in Varying Duty Operation, In: IEEE Access 8,
pp. 72577-72584.
ICINCO 2022 - 19th International Conference on Informatics in Control, Automation and Robotics
220

Putz, M. et al (2018). Sensorless fault detection in linear
axes with dynamic load profiles, In: Procedia
Manufacturing 19, pp. 66–73.
Neugebauer, R. et al. (2011). Using the Prony Analysis for
Assessing Servo Drive Control, In: Intelligent Control
and Automation 2(4), pp. 293-298.
Schöberlein, C. et al. (2017), Integration of Prony-Analysis
for Process-parallel Control Loop Monitoring of
Machine Tools, 10th International Conference on
Industrial Tools and Advanced Processing
Technologies - ICIT&APT 2017, 24-26 April 2017,
Ljubljana, Slovenia.
Schönherr, R. et al. (2012). Assessing the Performance of
Servo Drive Feedback Controls, In: Proceedings of the
13
th
Mechatronics Forum International Conference 1,
pp. 328-334.
Hellmich, A. et al. (2016). Drive Data Aquisition for
Controller Internal Monitoring Applications, In:
Journal of Machine Engineering 13(2), pp. 82-94.
Schöberlein, C. et al. (2018). Data Management System for
Drive-based Smart Data Services - A Pratical Approach
for Machine-Internal Monitoring Applications, In:
Proceedings of the 15th International Conference on
Informatics in Control, Automation and Robotics
(ICINCO 2018) 2, pp. 389-395.
Sensorless Condition Monitoring of Feed Axis Components in Production Systems by Applying Prony Analysis
221
