
Data Partitioning Strategies for Simulating non-IID Data Distributions in
the DDM-PS-Eval Evaluation Platform
Mikołaj Markiewicz
a
and Jakub Koperwas
b
Institute of Computer Science, Warsaw University of Technology, Warsaw, Poland
Keywords:
Distributed Data Mining, Federated Learning, non-IID Data, Data Partitioning Strategies, Algorithm Evalua-
tion, Clustering, Classification.
Abstract:
Nowadays, the size of the various datasets collected worldwide is growing rapidly. These data are stored in
different data centres or directly on IoT devices, and are thus located in different places. Data stored in different
locations may be uniformly distributed and convergent in terms of the information carried, and are then known
as independent and identically distributed (IID) data. In the real world, data collected in different geographic
regions tend to differ slightly or have completely different characteristics, and are then known as non-IID data.
Increasing numbers of new algorithms have been implemented to work with such distributed data without the
need to download all the data to one place. However, there is no standardised way of validating these, and
such algorithms are typically tested on IID data, which are uniformly distributed. The issue of non-IID data is
still an open problem for many algorithms, although the main categories of ”non-IID-ness” have been defined.
The purpose of this paper is to introduce new data partitioning strategies and to demonstrate the impact of
non-IID data on the quality results of distributed processing. We propose multiple strategies for dividing a
single dataset into multiple partitions to simulate each of the major non-IID data category problems faced by
distributed algorithms. The proposed methods of data partitioning integrated with the DDM-PS-Eval platform
will enable the validation of future algorithms on datasets with different data distributions. A brief evaluation
of the proposed methods is presented using several distributed clustering and classification algorithms.
1 INTRODUCTION
Various methods of data mining have been developed,
and in the last few years, there has been growing inter-
est in the study of federated learning (FL) techniques.
In this approach, a large amount of data is distributed
over a large number of devices that cooperate in the
learning process. It is worth noting that the concept
of FL represents a special case of general distributed
data mining (DDM) methods, which also deal with
distributed data but at different scales. For example,
the processing of megabytes of data stored in millions
of devices requires a different approach from the pro-
cessing of petabytes of data stored in a few data cen-
tres. A lack of knowledge about the characteristics
of the data distribution and the inability to download
all of the data locally are challenges for modern al-
gorithms operating in distributed environments. This
type of data, which are typically collected and stored
in different geographic regions, does not guarantee an
equal distribution of data samples for each location.
The data are then not independent and identically dis-
a
https://orcid.org/0000-0003-4229-8098
b
https://orcid.org/0000-0003-0693-5109
tributed (non-IID).
Research into non-IID data partitioning has be-
come very popular in the last few years, and re-
searchers have begun to pay more attention to the im-
pact of uneven data distributions on the results of dis-
tributed algorithms, as discussed in (Markiewicz and
Koperwas, 2019), (Sattler et al., 2019) or (Hsieh et al.,
2020). These studies have mainly analysed the skew
in data label distributions and training communica-
tion costs to improve efficiency, particularly for non-
IID data distribution. However, recent research has
focused on rigorous FL, which has been extensively
studied in terms of the algorithms used, FL systems
as a whole, and benchmarking tools for these systems.
The literature contains various approaches to valida-
tion (mainly tools or frameworks for benchmarking
FL algorithms), as summarised in a recent study of
such systems (Li et al., 2021b). Several publications
have documented new benchmark systems (Caldas
et al., 2018), (Luo et al., 2019) containing existing
non-IID partitioned datasets. Most of the latest tools
have focused on complete FL systems and the testing
of their components (Hu et al., 2020), (Bouraqqadi
et al., 2021), but have not placed particular emphasis
Markiewicz, M. and Koperwas, J.
Data Partitioning Strategies for Simulating non-IID Data Distributions in the DDM-PS-Eval Evaluation Platform.
DOI: 10.5220/0011290200003266
In Proceedings of the 17th International Conference on Software Technologies (ICSOFT 2022), pages 307-318
ISBN: 978-989-758-588-3; ISSN: 2184-2833
Copyright
c
2022 by SCITEPRESS – Science and Technology Publications, Lda. All rights reserved
307

on a wide range of data partitioning strategies. Recent
work (Liu et al., 2020) and (Li et al., 2021a) have
demonstrated several approaches to generating non-
IID datasets, nevertheless for (Li et al., 2021a) data
generation only applies to provided datasets placed in
their benchmarking system. In (Liu et al., 2020), the
authors, among other things, simulate the problem of
skew in the feature distribution and distort the image
data by adding random noise, which is an interesting
but unrealistic approach, since it distorts the real data
attributes themselves. Many other tools are described
in (Li et al., 2021b), although there is as yet no gen-
eral consensus on how to properly evaluate distributed
algorithms and how to define metrics for the non-
IID-ness of data. Non-FL distributed processing tools
and algorithms have also been intensively developed
across the world. Like the FL benchmarking tools,
these tools were created for the purpose of validat-
ing other DDM methods, and can be found in (Lim
´
on
et al., 2019) and (Markiewicz and Koperwas, 2022).
The authors of the latter started preparations to en-
able the evaluation of the algorithms in the case of
non-uniform data distributions by allowing the use of
various user-defined data partitioning strategies.
This paper represents a modest contribution to the
ongoing discussions of data partitioning methods for
simulating non-IID data distributions, with the aim of
facilitating better algorithm evaluations. Our current
research on data partitioning strategies focuses on the
horizontal partitioning of data. We consider the im-
pact and propose methods for simulating such data
distributions in order to face the open issues around
the use of distributed processing algorithms, as sum-
marised recently in (Kairouz et al., 2019). We define
various approaches to data partitioning that may be
appropriate for different research questions, as men-
tioned in a recent paper (Li et al., 2021b). Although
we cannot know the actual distribution for each dis-
tributed dataset in the real world, we can prepare the
implementation of the algorithm to be more resistant
to data distributions.
This paper is structured as follows. Section 2
refers to non-IID data partitioning and consists of two
substantial and related subsections. Subsection 2.1
provides an overview of an extended taxonomy of
non-IID data. The proposed data partitioning methods
are described in Subsection 2.2. Section 3 explains
the contribution and connection to the DDM-PS-Eval
platform. Section 4 reports the results of experiments
performed on the proposed data partitioning strate-
gies. Finally, Section 5 concludes with a summary
and plans for future work.
2 non-IID DATA PARTITIONING
In order to start designing partitioning strategies for
each non-IID data distribution, it is required to know
the origin of such distribution. The origin is directly
related to the data itself, and it would be beneficial
to know where it formally belongs in the hierarchy of
data partitioning methods.
2.1 Extended Data Partitioning
Taxonomy
Data may be split in multiple ways in independent
data centres, or may simply be in separate physical
locations. A taxonomy of types of partitioning was
presented in (Kairouz et al., 2019) with regard to the
problem of FL. In this paper, we introduce new levels
to the ’Non-identical client distributions’ part of the
existing taxonomy. These new levels are related to
partitioning strategies and data properties. Extending
the existing taxonomy is required to create suitable
and non-overlapping partitioning strategies for data
distribution characteristics. This extension improves
the categorisation of the new and existing methods
within the taxonomy structure. It also helps to avoid
strategy duplication for already handled non-IID dis-
tributions. The focus of our attention is on numeri-
cal or nominal data rather than on text, as partitioning
such data is a different issue that needs to be investi-
gated separately. Another brief categorisation of non-
IID data related to images, which is partially beyond
the scope of this work, and time-series data, is pre-
sented in (Zhu et al., 2021).
We started our work by investigating the main cat-
egories of non-IID distributions in order to determine
which data properties are related to each category.
There are three properties that can be used to describe
a data distribution: the distribution of data attributes,
the distribution of labels (classes)
1
of the samples, or
the amount of data itself. These distributions can be
observed together, which naturally defines it as a tax-
onomy rather than a tree-structured hierarchy. The
listed properties form the parent level of the category
level. The second additional level introduced here de-
fines methods of realising the expected data partition-
ing for the purposes of quality evaluations of algo-
rithms. Having top levels in place, we can correctly
link partitioning strategies to the categories. The pro-
posed extended taxonomy, illustrated in Fig. 1, shows
data partitioning strategies associated with main cate-
gories and their relationship to data properties.
1
The terms ”class” and ”label” are used interchange-
ably in the text because their meaning is the same, but the
nomenclature depends on the context.
ICSOFT 2022 - 17th International Conference on Software Technologies
308

Vertical
Non-identical client distributions
Horizontal
Attribute related Label / class related Amount related
Covariate shift
Prior probability shift
Concept driftConcept shift
Unbalancedness
- “Dense and outliers”
- “Diff. statistical attr. distribution”
- …
- “Separated”
- “All but”
- “Missing some”
- “Most plus all”
- “Most plus some”
- …
- “Split by attribute”
- …
- “Change label”
- …
- “Unbalanced labels”
- …
Data property
Main category
Partitioning strategies
Dataset shiftViolations of independence
[...] […]
Source of dependence
Non-IID Data partitioning
[possible strategy mix]
Figure 1: Extended non-IID data partitioning taxonomy, including new levels in bold (the line style of the arrows is not
important, and is only used to indicate the groups).
The taxonomy presented in Fig. 1 gives us a more
detailed view of data distribution possibilities and
their origins. It also allows us to prepare a compre-
hensive test suite covering multiple non-IID data dis-
tributions to evaluate algorithms. Thanks to the taxon-
omy graph, we can quickly notice that both ’covariate
shift’, ’concept shift’, and ’concept drift’ categories
relate to data attributes. At the same time, they do
not consider the quantity amount of the data. On the
other hand, ’prior probability shift’ and ’unabalanced-
ness’ are closely related to the data quantity amount
unconcerned about data attributes. Based on this ob-
servation, we can state that a minimal test suite for
algorithm evaluation utilizing non-IID data requires
examining at least two of five partitioning categories.
Therefore, we cannot fulfil the correct but minimal
algorithm evaluation without using at least one par-
titioning strategy that belongs to each data property.
An example set of strategies that fulfil this condi-
tion would be the ’concept drift’ and ’unbalanced-
ness’ partitioning that covers each data property in-
troduced at the parent taxonomy level. A possible
strategy mix used as a single test suite covering multi-
ple data properties might be a different approximation
for algorithm evaluation; however, mixing strategies
is out of the scope for this work.
2.2 Data Partitioning Strategies
In the following sections, we provide details of the
proposed partitioning strategies with examples for
each main category. For each strategy, we assume that
the dataset and number of target partitions are pro-
vided as input along with the strategy parameters.
2.2.1 Covariate Shift (Feature Distribution
Skew)
One of the first problems that arise is that data may be
placed in partitions with different distributions of at-
tributes. In other words, the combined histogram for
all ’split-separated’ data collected from each partition
would show relatively shifted attribute densities be-
tween the data in each partition. This is illustrated in
Fig. 2 and described in more detail below. Although
these partitions contain the same classes of data sam-
ple representatives, some of the attribute distributions
are slightly different. Examples include typical differ-
ences in handwriting characteristics, speed limit signs
that differ slightly between European countries (Grig-
orescu, 2018), or attributes describing the same plant
species based on their size, colour, etc., which vary
depending on the weather conditions and sunlight ex-
posure.
In this method, we want to perform partitioning
that will simulate this problem for a given dataset. It
is easy to get nearly separate and evenly spaced data
partitions based on a single attribute, by sorting the
data according to the value of the attribute and divid-
ing it into D equal parts. However, such parts have a
data shi f t equal to
1
D
, which is the relative distance
between the mean densities for these parts, as dis-
cussed below. Hence, to perform data splitting for dif-
ferent data shifts, we need to define an objective func-
tion for this problem. In our approach, we propose a
function that consists of two user-defined parameters
and unknown variables defined as mean data values
M
n
;n ∈ [1; splits]∧ n ∈ N for each data split. The first
parameter (splits) is the number of partitions, and the
Data Partitioning Strategies for Simulating non-IID Data Distributions in the DDM-PS-Eval Evaluation Platform
309

second parameter (shi f t) is the distance between the
data distribution means of the splits, which is the tar-
get skew of the data. The objective function is de-
termined by mathematical induction. We define the
requirement for maintaining a certain ratio of the dis-
tances between the distribution centres of the splits in
Equation 1:
M
2
− min
max − min
−
M
1
− min
max − min
= shi f t
⇒
M
2
− M
1
max − min
= shi f t
∧
M
3
− M
2
max − min
= shi f t
∧ ... =⇒
M
n
− M
n−1
max − min
= shi f t
(1)
It follows from Equation 1 that an overall shift be-
tween first and last is a multiple of the shi f t parame-
ter:
M
3
− M
2
max − min
+
M
2
− M
1
max − min
= 2 · shi f t
⇒
M
3
− M
1
max − min
= 2 · shi f t
=⇒
M
n
− M
1
max − min
= (n − 1) · shi f t
(2)
We can write the above expression as in Equation 3:
M
n
− M
1
max − min
=
splits
∑
n=2
M
n
− M
n−1
max − min
=⇒
splits
∑
n=2
M
n
− M
n−1
max − min
= (n − 1) · shi f t
(3)
Since n = splits, we obtain the final restrictions for
the objective function as in Equation 4:
∑
splits
n=2
M
n
−M
n−1
max−min
= (splits − 1)· shi f t
∀n
M
n
−M
n−1
max−min
= shi f t
∧ splits > 1; shi f t ∈ (0,
1
splits
]
(4)
where min and max are the minimum and maximum
attribute values.
Solving this problem with these constraints is not
an easy task. Our goal is to minimise the difference
between the defined target function and the selected
ratio. To achieve this, we need to search the space of
possible solutions, which grows with the amount of
data. We therefore approach this as a typical search
task that involves finding a solution that meets cer-
tain conditions. This can be done in many ways, in-
cluding brute force, random methods, or evolution-
ary algorithms. In our implementation, we choose the
simplest solution, which has two phases. We start by
sorting the data based on the selected attribute value,
to create an initial even split. We then iteratively move
a random sample from one split to another, rolling
back the operation if the objective function deterio-
rates. The stop condition is defined in the standard
way, as a low epsilon value or a maximum number of
iterations. Several strategies for moving the data sam-
ples were tested, including random splits and moving
borderline data samples between partitions. However,
the most straightforward solution turned out to pro-
duce the best results. Fig. 2 gives an example of the
split obtained after applying the proposed method to a
single attribute. We can see how the distribution of at-
tribute values varies depending on the split numbers.
Using a higher value for the shi f t param, we obtain
far apart separated distributions with low overlapping
for each split. Each split represents a data distribu-
tion dedicated to an independent target partition. For
the low value of the shi ft param, attribute distribution
across splits is more mixed; however, the mean values
are notably disjoint.
0.0
0.5
1.0
1.5
Density
original, all data
data
splits=2, shift=0.5
split_1
split_2
4 6 8
0.0
0.5
1.0
1.5
Density
splits=3, shift=0.3
split_1
split_2
split_3
4 6 8
splits=3, shift=0.1
split_1
split_2
split_3
Iris dataset attribute split by 'sepal_length'
Figure 2: Example of attribute densities for the
’sepal length’ attribute of the Iris dataset, in the original
case and after applying the proposed splitting method.
Splitting a dataset using a covariate shift for mul-
tiple attributes at the same time is possible, and re-
quires that the function in Equation 4 is fulfilled
for each attribute independently. However, the task
then becomes more complex, and it may be impossi-
ble to achieve an acceptable function result for some
datasets. Nevertheless, experiments described in the
next section show that ”shifting” data based on even
one attribute affects the quality of the distributed al-
gorithms.
Another variation of the covariate shift ap-
proach that is worth mentioning is the use of the
’dense-and-outliers’ partitioning strategy mentioned
in (Markiewicz and Koperwas, 2022). The authors
suggested that separating anomalies and boundary
data from dense data clusters defined by a data-
ICSOFT 2022 - 17th International Conference on Software Technologies
310

specific measure of similarity affects the quality of
distributed algorithms. Since the proposed method
operates on attribute values and their distribution, it
can be classified as a covariate shift partitioning strat-
egy.
2.2.2 Prior Probability Shift (Label Distribution
Skew)
Due to geographical or cultural differences, data sam-
ples from the same class may be stored on indepen-
dent nodes in different amounts. A typical example
of this would be the presence of kangaroos in various
regions around the world: this animal lives in the wild
only in Australia, although single individuals can be
found in a few zoos around the world. Another situa-
tion is represented by people from different countries
who emigrate and settle in groups that affect the dis-
tributions of the local communities. A third situation
is the use of English in books or conversations, which
is of course mainly found in the US or UK; however,
this particular language is also used all over the world.
On the basis of these examples, we can distinguish
many possibilities of separating data distributions into
independent data partitions. We therefore distinguish
the following partitioning strategies:
- ’separated [data]’, where it is assumed that data
samples with the same class are present only on
one partition.
- ’all [of the data] but [some]’, where specific la-
belled data samples are missing from some parti-
tions;
- ’most [of the data] plus some’, where the data are
partitioned according to labels and small subsets
of them are then scattered among several indepen-
dent partitions;
- ’most [of the data] plus all’, which is the same
as the previous strategy except that each subset is
also spread over each independent partition. This
scenario simulates the case where each partition
contains data for each label but with a different
distribution;
- ’with anomalies’, where most data are partitioned
evenly but contain anomalies - certain labels in
single quantities;
All of them are based on scattering data samples
across different partitions but with different and spe-
cific distributions for their cases. The first three strate-
gies assume main concentrations of data samples with
certain classes and several classes missing within par-
titions. The last two strategies require representatives
of all data classes to be kept together on every parti-
tion but in different amounts. Based on analyses and
numerous experiments performed to receive distin-
guished distributions, we have concluded that a single
but parameterised method is sufficient to address each
of the abovementioned strategies, rather than prepar-
ing separate, dedicated partitioning methods for each
of them.
The proposed method is divided into two stages,
related to labels and data quantities. First, we sep-
arate each class or group of classes depending on
the number of partitions. We then determine addi-
tional classes for partitions and classes for empty par-
titions
2
. When the number of partitions is greater than
the number of unique labels in the dataset, we need to
choose how to fill the empty partitions, as there are
not enough unique labels available for each partition.
In our method, we have two options: to fill empty
partitions evenly with samples of all labels, or select
the number of labels to be filled with data samples.
The most treacherous part is to avoid adding the same
label on every partition. We therefore use a cyclic it-
erator concept by adding classes in order which aligns
the distribution of label presence across partitions. As
a result of the first stage, we create tuples with three
items: main labels of the partition, additional labels,
and labels to fill empty partitions. An example of
the abovementioned partitioning methods is given in
Fig. 3. The figure shows the final algorithm assign-
ment of different labels numbered from 0 to L to each
group of labels within D partitions.
d1=[0, 3] + [1, 2, 4] + []
d2=[1, 4] + [0, 2, 3] + []
d3=[2] + [4, 1, 3, 0] + []
Most plus all:
D=3
L=5
Add=all
d1=[0, 3] + [1, 2] + []
d2=[1, 4] + [3, 0] + []
d3=[2] + [1, 3, 4] + []
All but:
D=3
L=5
Add=-1
d1=[0, 3] + [1, 2] + []
d2=[1, 4] + [3, 0] + []
d3=[2] + [1, 3] + []
Separated:
D=3
L=5
Add=0
d1=[0, 3] + [1, 2] + []
d2=[1, 4] + [3, 0] + []
d3=[2] + [1, 3] + []
Most plus some:
D=3
L=5
Add=2
d1=[0] + [] + []
d2=[1] + [] + []
d3=[2] + [] + []
d4=[] + [] + [0, 1, 2]
d5=[] + [] + [0, 1, 2]
Separated:
D=5
L=3
Add=0
EmptyAdd=all
d1=[0] + [] + []
d2=[1] + [] + []
d3=[2] + [] + []
d4=[] + [] + [0, 1]
d5=[] + [] + [2, 0]
Separated:
D=5
L=3
Add=0
EmptyAdd=2
Legend:
1st [] - majority labels
2nd [] - additional labels
3rd [] - empty partition labels
L - labels >= D - partitions
EmptyAdd=0
L - labels < D - partitions
d1=[0] + [1] + []
d2=[1] + [2] + []
d3=[2] + [0] + []
d4=[] + [2] + [0, 1]
d5=[] + [1] + [2, 0]
All but:
D=5
L=3
Add=-1
EmptyAdd=2
Figure 3: Examples of different label partitioning strategies
depending on the parameters L (number of unique labels), D
(number of partitions), Add (additional number of labels),
and EmptyAdd (additional number of labels for empty par-
titions).
The second step uses simple mathematical pro-
portions based on the provided parameters and the
amounts of data to be transferred from the main sub-
sets. At the end of the process, the data samples are
randomised with a uniform distribution for each label
according to the defined dependencies, and then split
2
An empty partition is one without a dedicated majority
of data samples for a specific label, which is possible when
the number of unique labels is lower than the number of
target partitions.
Data Partitioning Strategies for Simulating non-IID Data Distributions in the DDM-PS-Eval Evaluation Platform
311

between partitions. Both steps require several param-
eters related to the label separation itself and the quan-
tity of data samples to be distributed. The first pair is
additionalClasses and emptyPartitionClasses, which
determine how many additional classes should exist
in the partition despite the initial number of labels
present in the partition, and how many labels add to
empty partitions. The second pair is emptyPercent
and additionalPercent, which describe the maximum
percentage of the data that should be used to fill empty
partitions, and how much data should be used as ad-
ditional padding for other partitions. To keep the ma-
jority in the initial subsets, the first should not be less
than 50%, and the second should be at most half the
value of the first parameter. The same concept is de-
scribed in a recent paper by (Markiewicz and Koper-
was, 2019), with reference to different strategies for
preparing uneven data distributions.
There are many parameterisation possibilities,
which depend on the dataset used, the number of la-
bels, and the amount of data. By looking at the fi-
nal result of this partitioning process, we can clearly
see that it is closely related to both the label and the
amount in terms of the data property. In itself, it does
not take attribute values into account; although this
is possible, it would involve mixing different non-IID
partitioning main categories rather than a single as-
pect of the data distribution.
2.2.3 Concept Drift (Same Label, Different
Features)
The term ’concept drift’ refers to a problem of dis-
tributed learning training phase in which a certain
set of data objects from the same class on each in-
dependent node is represented by samples with dis-
joint attribute values. It can refer to a fully disjoint set
of attribute values between nodes or simply a differ-
ent value distribution for some attributes in different
nodes. The most common example where this issue
occurs is a classification task for pictures with houses,
where photos of houses are taken at different times of
the year or under different weather conditions. An-
other example is the features of people from differ-
ent regions of the world who differ in terms of their
height, weight, hair colour, etc., which has an impact
when exploring data on medical conditions. To simu-
late this type of data distribution, the dataset with the
selected label should be separated to obtain the most
separable data sample groups possible based on the
attribute values. A simple technique would be to ap-
ply a partitioning algorithm to a subset to find a spe-
cific number of groups; however, this may be a non-
deterministic method. We took a different approach,
and our algorithm is defined in Algorithm 1.
Algorithm 1: ’concept drift’ partitioning strategy.
Input Dataset Data, target label L, and partition
”drifts” D
Output Data partitioned into D partitions
1: Extract a data subset Data with label L;
2: [optional] Discretise the numerical attributes into
R ranges for further processing;
3: Group data into buckets consisting of samples
with the same attribute values, in order to sepa-
rate the individuals and groups of disjoint sets of
attribute values, where individuals are samples or
buckets of samples with the unique values of all
attributes. A disjoint set refers to a group of sam-
ples whose values for each attribute in every sam-
ple are disjoint to values for each attribute of every
sample from other sets. Fig. 4 gives an example
of this process. This example shows the result and
the second pass after processing step 5.2.;
4: [optional] For a dataset that contains only nom-
inal attributes, find individuals - they are can-
didates for scattering anywhere because of com-
pletely different feature values than other sam-
ples; they can be treated as data anomalies;
5: Check whether it is possible to perform the se-
lected ”drift” from the groups found by checking
the conditions: |buckets \ individuals| ≥ D and
|bucket| >
|Data|
D
·r;∀bucket; where r - ratio with
default, but possibly parameterisable value 0.2, to
avoid highly unbalanced partitioning:
5.1: If the conditions are met, or all the attributes
have been checked, partitioning begins;
5.2: Otherwise, remove individuals from the Data
subset, exclude the single Data attribute with
the lowest entropy value, and repeat the steps,
starting with step 3;
6: Partitioning is done by dividing the found buckets
sorted by the value from the last examined at-
tribute into D partitions, where the number of
samples is divided between them as evenly as pos-
sible;
7: If any individuals are found, place them into par-
titions to fill or equalise sample quantities be-
tween partitions;
7.1: [optional] For numerical data, the target par-
titions for individuals are those closest to the
centre in terms of the Euclidean distance (note
that without the discretisation performed in
Step 2, there is usually a large number of
individuals);
ICSOFT 2022 - 17th International Conference on Software Technologies
312
Id: a1, a2, a3
1 : a, b, c
2 : w, d, e
3 : x, y, z
4 : d, e, f
5 : w, b, b
6 : d, f, d
7 : c, c, f
8 : x, y, z
bucket 1:
ids=[1, 2, 5]
a1 =[a, w]
a2 =[b, d]
a3 =[c, e, b]
bucket 2:
ids=[3, 8]
a1 =[x]
a2 =[y]
a3 =[z]
bucket 3:
ids=[4, 6, 7]
a1 =[d, c]
a2 =[e, f, c]
a3 =[f, d]
individuals
Id: a2, a3
1 : b, c
2 : d, e
4 : e, f
5 : b, b
6 : f, d
7 : c, f
bucket 1:
ids=[1, 5]
a2 =[b]
a3 =[c, b]
bucket 2:
ids=[2]
a2 =[d]
a3 =[e]
bucket 3:
ids=[4, 7]
a2 =[e, c]
a3 =[f]
individuals
bucket 4:
ids=[6]
a2 =[f]
a3 =[d]
1st pass:
2nd pass:
3nd pass..
Figure 4: An example of found buckets with individuals for
the first two passes of the ’concept drift’ strategy. Bolded
value with cyan background marks the attribute values re-
sponsible for grouping samples into the first bucket. Sample
with id 5 affects the unrelated to each other samples with
ids 1 and 2, as they have a transitive similarity: 1 ∼ 5 ∧ 2 ∼
5 =⇒ 1 ∼ 2.
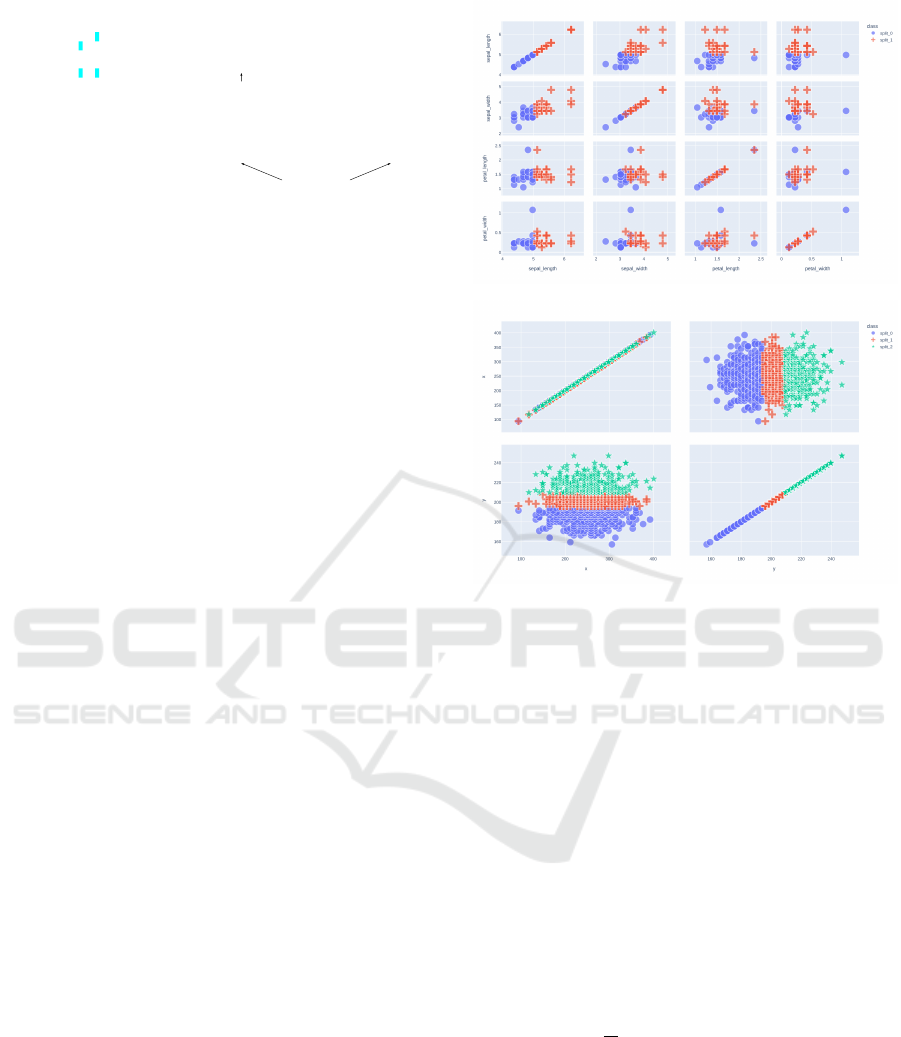
Although we assume here that drifting is per-
formed for one selected label, the same algorithm can
be applied to others. Examples of the partitioning re-
sults for the Iris dataset and the two-dimensional nu-
merical single ellipse Gaussian dataset are shown in
Fig. 5. With the use of colours and shapes, it is easy to
notice how data samples are divided separately from
each other. The dataset firmly separated represents
the same object class, e.g. the same genre of flower
or cluster of points; however, divided as much as pos-
sible after attribute distribution examination. As a re-
sult, we obtain well-separated subclasses.
However, this approach may fail if the dataset can-
not be split in this way, in which case the method pro-
cessing comes down to splitting the data sorted by the
most diverse value of a single attribute. For images or
textual datasets, using the proposed approach should
additionally consider either a prior aggregation of at-
tributes or a reduction in the number of dimensions.
Without this preprocessing step, the algorithm would
try to carry out an analysis at too low a level of detail,
such as a single pixel value, which is irrelevant in the
overall scope.
2.2.4 Concept Shift (Same Features, Different
Label)
The concept of this issue relates to a divergent class
identification of data objects described by the same
features in different regions, or simply a different un-
derstanding of what is represented by the characteris-
tics when marking the data used for training. This is
more related to the NLP process for sentiment anal-
ysis problems, where words can be tagged in differ-
ent ways in the training dataset depending on the un-
derstanding. An example of nominal data can be a
different understanding of a high or wealthy person
depending on the country. When classifying non-text
data, it is difficult to avoid errors in processing. It is
(a) Iris dataset - ’Iris-setosa’ attribute.
(b) 2-dimensional single cluster dataset.
Figure 5: Scatter matrix plots for single label data parti-
tioned using the ’concept drift’ strategy.
almost impossible to evaluate the correct solution, as
training is based on previously known labels. When
the features of data objects are similar but labelled
differently, the only way to get a correct result is to
use fuzzy classification, where the classified sample
can have multiple classes assigned to it. However, the
clustering task is not affected by this problem at all,
as it is an unsupervised learning method that does not
involve an analysis of the training data classes. Due to
the conditions mentioned above, the proposed method
of data partitioning consists of changing the label to
a new, unique one for a certain number of data sam-
ples. Our implementation of this partitioning strategy
allows us to change the label of training samples for
a subset of data with a selected class. This training
subset of size s ·
1
N
is then separated and the labels are
changed, where s is the number of parts of the data
subset to perform an independent label change, and N
is the number of partitions. Fig. 6 gives an example of
this type of partitioning. The exemplary dataset con-
sists of data samples of two different labels required
to be divided into three partitions and create two more
classes using ’concept shift’. As a result, we obtain
four classes distributed on three partitions where two
classes are artificially created from the chosen one.
Data Partitioning Strategies for Simulating non-IID Data Distributions in the DDM-PS-Eval Evaluation Platform
313

200 * C 200 * D
n
1
= 300 n
2
= 300 n
3
= 300
dataset size = 900
number of parts (s) = 2
worker nodes (N partitions) = 3
shift label = ‘B’
300 * ‘A’ 600 * ‘B’
100 * A
100 * A
100 * A
200 * B
Figure 6: ’concept shift’ partitioning strategy applied to
data samples labelled ’B’.
The overall purpose of using this method for val-
idation is to see how much such a divergent under-
standing of object class may affect the final results.
This can be useful when the evaluated algorithm pro-
duces a fuzzy result or returns artefacts describing
samples rather than a simple classification label.
2.2.5 Unbalancedness (Quantity Skew)
The last method of data partitioning described in this
paper is the preparation of unbalanced data in terms
of the number of samples. In this case, we assume
that some nodes have more data samples, and oth-
ers have significantly fewer. The partitioning method
can be trivial by using random data partitioning along
with the probability weights of presence in each par-
tition. However, it would be difficult to maintain the
ratio between sizes of those partitions with more data
samples and other partitions for various numbers of
target partitions. A simplified diagram illustrating pa-
rameterisation for this approach to obtain a ¼ ratio is
shown in Fig. 7.
However, our intention was to allow the user to
choose this ratio along with the number of nodes that
should contain more data samples. In order to make
this possible, a simple system of two equations has to
be solved, in which we have two unknown variables
and four known parameters. Equation 5 describes the
conditions to solve in order to find unknown values L
and S, where L is the large amount of data and S is the
small amount of data; the known parameters from the
data description are C and W , where C is the dataset
size and W is the number of target partitions; and
the user-defined parameters are node threshold T as
the number of target partitions that should have more
data, and ratio U which is the target unbalancedness.
T · L + (W − T ) · S = C
S
L
= U
=⇒
L =
C
U·(W −T )+T
S =
C−T ·L
W −T
(5)
Based on the previous example in Fig. 7, we can
obtain these numbers by using parameter values of
0.25 for the unbalancedness ratio and two nodes as
the threshold. In our implementation of this method,
it is also possible to select a proportional imbalance to
keep the same ratio for each class as a result of data
partitioning. 0 However, this behaviour is usually un-
desirable, as it tends towards the IID data distribution.
As a result of this partitioning strategy, the data sam-
ples are scattered among the partitions in the number
of the calculated partition sizes: L and S. Samples
are chosen from the original dataset by a uniformly
random function.
900 samples
n
1
= 400
n
2
= 400
n
3
=
100
dataset size = 900
worker nodes (N partitions) = 3
large partitions quantity = 2
target ratio = ¼ = 100 / 400
~44.5% ~44.5%
~11%
Figure 7: The trivial approach of finding the partition size
division.
It should also be noted that when the imbalance
factor is high, we do not consider ’unbalancedness’
alone, but in conjunction with the ’prior probability’
category, which in this case is related to the ’Label /
class related’ data property defined in the taxonomy.
This is another indication that we are considering a
taxonomy rather than a hierarchy.
3 DDM-PS-EVAL PLATFORM
PARTITIONING COMPONENT
The DDM-PS-Eval platform created and described
by (Markiewicz and Koperwas, 2022) is a tool used
to perform comprehensive distributed data mining al-
gorithms evaluation. The most exciting element in
this platform referring to this work is the possibility of
running experiments on the same dataset but with dif-
ferent data distribution. This platform contains built-
in partitioning strategies and has been designed to be
easily extendable with new custom ones. It is possible
to write custom implementations following the given
interface rules and use them in the platform.
A crucial part of this work was to prepare working
implementations of partitioning strategies that expand
algorithms evaluation with different non-IID data dis-
tributions. Moreover, using the extended taxonomy
presented in section 2.1, already existing strategies
have been arranged into the main categories:
- ’uniform’, is treated as reference IID partitioning
and kept outside of non-IID data partitioning tax-
onomy;
- ’label-strategy’, during this work has become gen-
eralised and placed into the ’prior probability
shift’ category;
ICSOFT 2022 - 17th International Conference on Software Technologies
314

- ’dense-and-outliers’, aforementioned also in sec-
tion 2.2.1 and refers to the ’covariate shift’ cate-
gory.
We have prepared implementations of partitioning
strategies for the three missing categories in the plat-
form. These were ’concept drift’, ’covariate shift’,
and ’unbalancedness’. Adding them completes the
set of non-IID from the ’Non-identical client distri-
butions’ taxonomy branch.
The overview of the most interesting and data-
related components of the platform is presented in
Fig. 8. The platform allows us to perform multiple
Load input essentials
Prepare test suite
DDM-PS-EVAL evaluation process
Scatter data
using partitioning strategy
Execute algorithm
Validate results
repeat
DDM-PS-EVAL
built-in
similarity
measures
built-in
partitioning
strategies
Data
loader
Similarity measure
loader
Partitioning strategy
loader
Slice of the DDM-PS-EVAL components
Algorithm
loader
Prepare environment
« use »
« use »
Figure 8: Fragment of the DDM-PS-Eval platform with es-
sential components related to data partitioning; a simplified
algorithm evaluation process on the left.
parameterised experiments using different built-in or
custom partitioning strategies. Partitioning strategy
components marked with a green background are re-
sponsible for this process.
3.1 Data Similarity Measures
Commonly, algorithms operating on numerical data
use Euclidean distance to compare data samples;
however, it is not a rule. Cosine distance works
better to compare a vector representation of text doc-
uments. On the other hand, specialised algorithms
can work with custom similarity metrics. Comparing
genomic data described by specialised structures is
an excellent example. The DDM-PS-Eval platform
is prepared to load and use custom data similarity
metrics for partitioning strategy alongside built-in
metrics. The already existing ’dense-and-outliers’
strategy uses this feature to calculate the distance
between data samples depending on data and the
provided similarity measure. Nevertheless, the
proposed in this work strategies do not require any
metric. They work directly on the data attributes,
labels or amounts related to labels. On the other
hand, to achieve a more sophisticated distribution
for ’prior probability shift’, moving more simi-
lar samples with the same class together between
partitions instead of random choice would be
beneficial.
4 EXPERIMENTS
In order to verify the validity of the proposed parti-
tioning strategies, we carried out several experiments.
To illustrate the impact on the quality of the results,
we ran selected distributed algorithms for datasets
that were independently partitioned using multiple
strategies.
For the evaluation, we used four different dis-
tributed clustering algorithms and two simple dis-
tributed classifiers. The classifiers were a distributed
implementation of naive Bayes, which builds global
a priori probability statistics based on the collected
probabilities from local nodes, and the naive dis-
tributed SVM approach described in (Navia-V
´
azquez
et al., 2006), tentatively named DN-SVM. In the lat-
ter approach, the final SVM model is trained on lo-
cally found support vectors sent from local nodes,
which are treated as global training data. The cluster-
ing algorithms were DK-means (Ji and Ling, 2007),
Opt-DKM (Markiewicz and Koperwas, 2019), a
lightweight clustering technique (Aouad et al., 2007)
tentatively named LCT, and a modified version of the
BIRCH algorithm (Zhang et al., 1997), which used
a partitioning approach for the final clustering. This
modification was made by combining the agglomer-
ative process in BIRCH with a partitioning method.
BIRCH clusters the data at the local nodes and sends
the cluster centroids to the global node, where the
same operation is performed by treating the centroids
as data samples to be clustered. Finally, global clus-
tering is done by assigning samples to the closest
global centroid.
The data used in the experiments included well-
known datasets from the UCI Machine Learning
Repository, such as the unbalanced Shuttle dataset
and the tiny MNIST dataset. We used the PCA algo-
rithm to preprocess and reduce MNIST data dimen-
sionality from 28x28 into 28 attributes to avoid ap-
plying partitioning strategies on raw pixel values. We
also used the noiseless ”Dataset 1”, which was in-
troduced with the CURE algorithm in (Guha et al.,
1998), and a dataset generated as two-dimensional
points arranged into Gaussian clusters with some
overlapping outliers to avoid perfect clustering re-
sults. The first two of these are primarily used for the
task of classification, whereas the last two are used for
clustering purposes. The full parameterisation of the
experiments is given in Table 1.
Data Partitioning Strategies for Simulating non-IID Data Distributions in the DDM-PS-Eval Evaluation Platform
315

Table 1: Summary of the test suite with experimental configurations.
Data (classes/groups, number of samples)
Shuttle (7, 58.000), MNIST (10, 70.000),
CURE (5, 2.000), Synthetic-Gaussians (7, 100.000)
Algorithms
Naive Bayes, DN-SVM,
DK-means, Opt-DKM, LCT, DP-BIRCH
Worker nodes / partitions
Three workers for the first three literature datasets
Four workers for the synthetic dataset
Partitioning strategies
(parameterised separately for each dataset)
uniform, dense-outliers, covariate-shift,
separated, most-plus-some, most-plus-all, all-but,
concept-drift, concept-shift, unbalancedness
The results of the experiments on distributed clas-
sification are shown in Fig. 9, and those for distributed
clustering are shown in Fig. 10. In each chart, the first
black bar on the left represents the results for uniform
data distribution, and the rest represents the other par-
titioning strategies. For the non-deterministic algo-
rithms, each bar shows the average result of 30 execu-
tions, with error bars representing the minimum and
maximum values of all executions. All experiments
were carried out on the DDM-PS-Eval platform pre-
sented in (Markiewicz and Koperwas, 2022) hence all
the methods proposed are ready to use, and have been
implemented in the way suggested by the authors
of (Markiewicz and Koperwas, 2022). This allowed
us to collect multiple forms of information, such as
the processing time, transfer load, and final quality;
however, for clarity of presentation, only the quality
3
is presented in the charts. The quality measure used
for clustering is the adjusted Rand index, whereas for
classification we use the F-score in response to the un-
balanced number of classes in the Shuttle dataset. The
number of partitions used is small, due to the small
number of classes and data samples, since the goal is
to show the impact of non-IID partitioning rather than
to add artificial complexity to the problem.
The primary goal of any algorithm design is to
obtain high-quality results regardless of data distri-
bution. However, in many implementations of dis-
tributed algorithms, the results are affected by differ-
ent data dispersion. Due to its nature, a distributed im-
plementation of the Naive Bayes algorithm produces
exactly the same results, regardless of the partition-
ing strategy used. The expected exception in experi-
mental results is poor accuracy obtained for the tested
classifiers using ’concept shift’ partitioning strategy,
as they are not fuzzy classifiers. The second clas-
sifier encountered problems with highly segregated
data, where the number of support vectors was small.
The clustering results showed how the mean and max-
imum possible values of the clustering quality might
3
Full results as raw data and an interactive
format are available at https://github.com/Kajo0/
icsoft-2022-experiments-results
vary depending on the data partitioning. It was found
that even using the k-means++ initialisation intro-
duced in (Arthur and Vassilvitskii, 2006) did not help
to avoid the impact of different data partitioning meth-
ods on the results. The effects of the different data
partitioning methods on the final clustering are very
different, as shown in the results of the DK-Means
and Opt-DKM algorithms. It is also interesting that
in most cases, uniform data distribution made it diffi-
cult to obtain the best results, which was not expected
at the outset. However, this can be explained by the
density-based nature or non-deterministic initialisa-
tion of these algorithms.
An important implication of these findings is that
we can roughly summarise how each partitioning
strategy affects the algorithms examined here, as pre-
sented in Table 2. We cannot state that a particular
category of non-IID data affects calculations or results
for particular types of algorithms, for example par-
titioning or density-based methods. This is because
modern distributed algorithms are usually based on
an ensemble approach, and typically combine differ-
ent methods for better results. However, we can cer-
tainly determine the approximate level of the possible
impact of each main non-IID category on the algo-
rithm, as shown in Table 2. This approximation may
form a starting point for authors aiming to optimise
the implementation of their algorithm.
We also need to remember that the impact of non-
IID data partitioning on the quality of the algorithms
also depends on the characteristics of the data itself
without partitioning. This is illustrated in Figs. 9
and 10, where the distributions of the results for the
same algorithm differ between the datasets; this is
clearly visible for the DK-means algorithm, for in-
stance. Moreover, it is obvious that there are countless
test case parameterisations, including the selection of
dataset attributes, the size of the “drift” or “shift”,
and the number of target partitions. For this article,
we have selected more interesting results for the dif-
ferent partitioning strategies to emphasise the impact
of the data distribution. Depending on the behaviour
of the algorithm, the results may be better or worse,
ICSOFT 2022 - 17th International Conference on Software Technologies
316
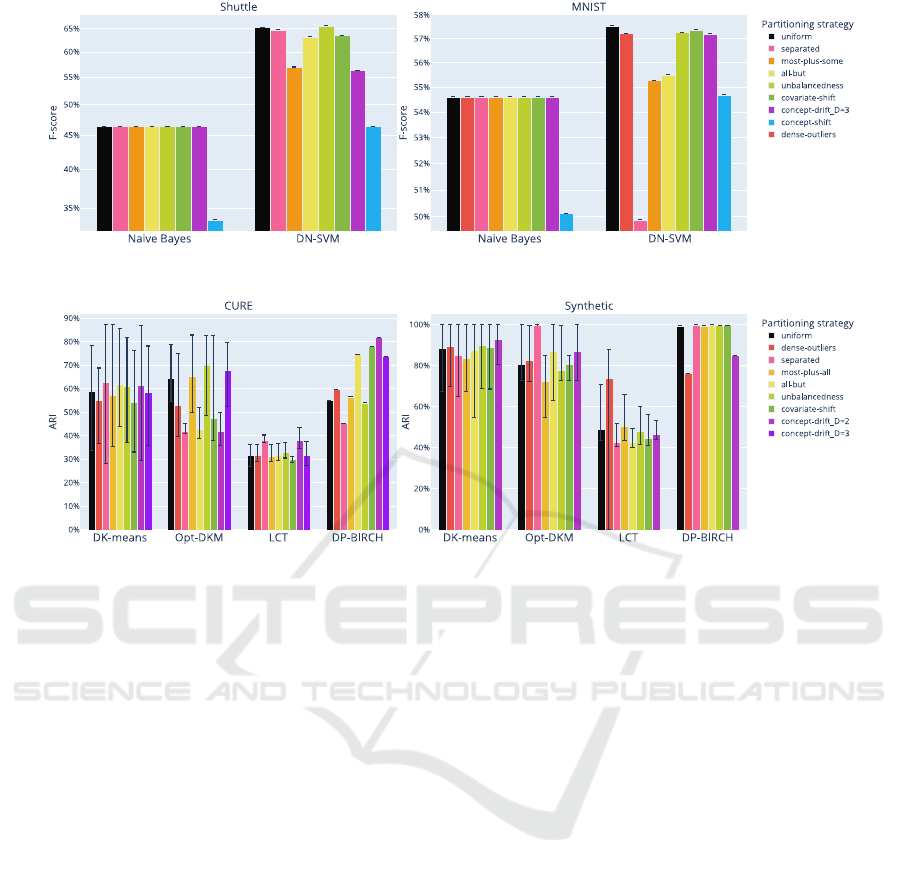
Figure 9: Comparison of results obtained for classification using a logarithmic scale.
Figure 10: Comparison of average results obtained for clustering.
or may not change at all. For example, in the case
of distributed versions of density-based algorithms,
data separation is typically an obstacle in subsequent
phases of global aggregation. For this reason, it is
crucial to validate algorithms using multiple data par-
titioning strategies instead of a single uniform one.
All the methods proposed represent only a few
possibilities for the data distributions, and many more
are possible. At this point, it should be noted that
in terms of data partitioning, numerical data such as
images with large numbers of dimensions should be
treated differently from data collected from surveys,
which are used for classification purposes. Moreover,
in some label-related strategies that perform dataset
separation based on the sample class, the number of
target partitions plays a role, which opens up another
discussion on how to deal with this.
5 CONCLUSIONS AND FUTURE
WORK
In this work, we extended the existing non-IID tax-
onomy by two levels. The first is the data prop-
erty as the parent level of the main non-IID category.
Adding this level then allowed us to determine the re-
lation between data attribute and specific partitioning
strategies defined as the new leaf-level of the taxon-
omy. We have presented multiple dataset partitioning
methods that simulate non-IID data dispersion for nu-
merical and nominal data, with detailed explanations
and examples for each category. The proposed meth-
ods have been evaluated for distributed clustering and
classification algorithms using several datasets and
various algorithms. Results for different parameter-
isations have been presented and discussed. Each
described data partitioning strategy has been imple-
mented and is ready to work with the DDM-PS-Eval
platform. In conclusion, this study has shown that
there is a significant impact of data partitioning on the
results provided by distributed algorithms. This work
paves the way for better validation of algorithms, in
order to allow for the design of algorithms that are
data distribution-agnostic.
Further research on different data partitioning
schemes, such as for textual datasets, is necessary to
extend our evaluation to other types of algorithms.
Future work will involve extending the proposed
methods to produce more realistic distributions of
non-IID data by mixing multiple partitioning strate-
gies based on attributes, labels, and quantity. Several
open issues need to be analysed and addressed, such
as the aforementioned mixture of strategies and deal-
ing with a large number of partitions for data with few
labels.
Data Partitioning Strategies for Simulating non-IID Data Distributions in the DDM-PS-Eval Evaluation Platform
317

Table 2: Summarised ranges of the negative impact of each partitioning strategy on the examined algorithms and datasets (L,
M, H indicate low (<5%), medium (<10%), high (≥10%) impact, respectively, and 0 indicates no noticeable impact or results
that are better than those obtained for uniform data distribution; for non-deterministic algorithms, separate differences were
taken into account for both mean and maximum values collected from multiple executions; bold cells indicate potentially high
impact).
Main non-IID category
of data partitioning strategy
Naive Bayes DN-SVM DK-means Opt-DKM LCT DP-BIRCH
Covariate shift 0 0 - L 0 - M 0 - H 0 - H 0 - H
Concept shift M-H H 0 0 - L 0 - H 0 - L
Concept drift 0 0 - M 0 - L 0 - H 0 - H L - H
Prior probability shift 0 0 - H 0 - L 0 - H 0 - H 0 - M
Unbalancedness 0 0 0 - L 0 - L 0 - H L - H
REFERENCES
Aouad, L. M., Le-Khac, N.-A., and Kechadi, T. M. (2007).
Lightweight clustering technique for distributed data
mining applications. In Industrial Conference on Data
Mining, pages 120–134. Springer.
Arthur, D. and Vassilvitskii, S. (2006). k-means++: The
advantages of careful seeding. Technical report, Stan-
ford.
Bouraqqadi, H., Berrag, A., Mhaouach, M., Bouhoute,
A., Fardousse, K., and Berrada, I. (2021).
Pyfed: extending PySyft with N-IID Feder-
ated Learning Benchmark. Proceedings of the
Canadian Conference on Artificial Intelligence.
https://caiac.pubpub.org/pub/7yr5bkck.
Caldas, S., Duddu, S. M. K., Wu, P., Li, T., Kone
ˇ
cn
`
y,
J., McMahan, H. B., Smith, V., and Talwalkar, A.
(2018). Leaf: A benchmark for federated settings.
arXiv preprint arXiv:1812.01097.
Grigorescu, S. M. (2018). Generative one-shot learn-
ing (gol): A semi-parametric approach to one-shot
learning in autonomous vision. In 2018 IEEE In-
ternational Conference on Robotics and Automation
(ICRA), pages 7127–7134. IEEE.
Guha, S., Rastogi, R., and Shim, K. (1998). Cure: An ef-
ficient clustering algorithm for large databases. ACM
Sigmod record, 27(2):73–84.
Hsieh, K., Phanishayee, A., Mutlu, O., and Gibbons, P.
(2020). The non-iid data quagmire of decentralized
machine learning. In International Conference on Ma-
chine Learning, pages 4387–4398. PMLR.
Hu, S., Li, Y., Liu, X., Li, Q., Wu, Z., and He, B.
(2020). The oarf benchmark suite: Characterization
and implications for federated learning systems. arXiv
preprint arXiv:2006.07856.
Ji, G. and Ling, X. (2007). Ensemble learning based dis-
tributed clustering. In Pacific-Asia Conference on
Knowledge Discovery and Data Mining, pages 312–
321. Springer.
Kairouz, P., McMahan, H. B., Avent, B., Bellet, A., Bennis,
M., Bhagoji, A. N., Bonawitz, K., Charles, Z., Cor-
mode, G., Cummings, R., et al. (2019). Advances and
open problems in federated learning. arXiv preprint
arXiv:1912.04977.
Li, Q., Diao, Y., Chen, Q., and He, B. (2021a). Federated
learning on non-iid data silos: An experimental study.
arXiv preprint arXiv:2102.02079.
Li, Q., Wen, Z., Wu, Z., Hu, S., Wang, N., Li, Y., Liu,
X., and He, B. (2021b). A survey on federated learn-
ing systems: vision, hype and reality for data privacy
and protection. IEEE Transactions on Knowledge and
Data Engineering.
Lim
´
on, X., Guerra-Hern
´
andez, A., Cruz-Ram
´
ırez, N., and
Grimaldo, F. (2019). Modeling and implementing dis-
tributed data mining strategies in jaca-ddm. Knowl-
edge and Information Systems, 60(1):99–143.
Liu, L., Zhang, F., Xiao, J., and Wu, C. (2020). Evaluation
framework for large-scale federated learning. arXiv
preprint arXiv:2003.01575.
Luo, J., Wu, X., Luo, Y., Huang, A., Huang, Y., Liu, Y.,
and Yang, Q. (2019). Real-world image datasets for
federated learning. arXiv preprint arXiv:1910.11089.
Markiewicz, M. and Koperwas, J. (2019). Hybrid
partitioning-density algorithm for k-means cluster-
ing of distributed data utilizing optics. International
Journal of Data Warehousing and Mining (IJDWM),
15(4):1–20.
Markiewicz, M. and Koperwas, J. (2022). Evaluation
platform for ddm algorithms with the usage of non-
uniform data distribution strategies. International
Journal of Information Technologies and Systems Ap-
proach (IJITSA), 15(1):1–23.
Navia-V
´
azquez, A., Gutierrez-Gonzalez, D., Parrado-
Hern
´
andez, E., and Navarro-Abellan, J. (2006). Dis-
tributed support vector machines. IEEE Transactions
on Neural Networks, 17(4):1091.
Sattler, F., Wiedemann, S., M
¨
uller, K.-R., and Samek, W.
(2019). Robust and communication-efficient feder-
ated learning from non-iid data. IEEE transactions on
neural networks and learning systems, 31(9):3400–
3413.
Zhang, T., Ramakrishnan, R., and Livny, M. (1997). Birch:
A new data clustering algorithm and its applications.
Data Mining and Knowledge Discovery, 1(2):141–
182.
Zhu, H., Xu, J., Liu, S., and Jin, Y. (2021). Federated
learning on non-iid data: A survey. arXiv preprint
arXiv:2106.06843.
ICSOFT 2022 - 17th International Conference on Software Technologies
318
