
A Planning Tool for COD Flow Optimisation to a Waste Water
Treatment Plant
Kirsten M. Nielsen and Tom S. Pedersen
Automation and Control, Department of Electronic Systems, Aalborg University, Aalborg, Denmark
Keywords:
Model Predictive Control.
Abstract:
The waste water flows to a typical wastewater treatment plant (WWTP) is comprised from periodic domestic
flows and more stochastic industrial flows. Especially variations in the flow of Chemical Oxygen Demand
(COD) at the inlet to the WWTP are problematic due to the biological purification process and bio gas pro-
duction. Traditionally the inlet is un-controlled. A way to reduce variations is to insert a buffer tank near the
industrial areas and control the tank outlet according to a prediction of household COD flow. As a first step
a planning tool for operator control of the buffer tank outlet 24 hours ahead is designed. The WWTP in the
Danish town Fredericia is used as a case. At the moment the only on-line measurement is the inlet flow to the
wastewater treatment plant and reliable measurements in the network are difficult to establish. A Model Pre-
dictive Control scheme is shown to be able to give considerable reduction in the COD flow variations. To do
this two models are introduced; one describing the buffer tank and sewer network from the tank to the WWTP
and one describing the daily variations in the household flow. Additionally prediction of the industrial outlet
is included. The control scheme has been tested showing good results in a SWMM simulation environment
(ProtectionAgency, 2016) based on network architecture and measurements in Fredericia.
1 INTRODUCTION
The topic within this paper is to improve the the pu-
rification and bio-gas production in wastewater treat-
ment systems by smoothing the COD Flow to a
WWTP.
The sewer system drains wastewater from indus-
tries and private households. A sewer system network
consists of gravity pipes, pressurised pipes, pumps,
manholes, weirs etc. making up a complex system,
there is no retain tanks in the network. At the moment
the inflow to the WWTP is un-controlled. The idea is
to insert a retrain tank in the system and control the
tank outlet. The first iteration which is in focus in this
work is an operator support system making 24 hours
ahead plans for outflow from the tank. The planning is
based op prediction of industrial and household waste
water flow and concentration and potentially precipi-
tation. The execution of the plan is left to the opera-
tor. In this work, the sewer network in the Danish city
Fredericia with approximately 50000 inhabitants is in
focus.
Wastewater is comprised of different pollutants
like phosphor, nitrogen and COD. The inlet flow and
concentration to the WWTP is varying due to daily
variations in household wastewater, varying industrial
outlets and different time delays from these sources
to the WWTP inlet. In addition, precipitation causes
irregular variations. In Fredericia in dry periods ap-
proximately 50 % of the wastewater comes from in-
dustries.
A detailed model description of all phenomena
is extremely comprehensive as seen in e.g. the
simulation tool WATS (T. Hvitved-Jacobsen et al.,
2013),(DHI, 2017) and is not well suited for con-
troller design. Therefore, a simple model describing
the main dynamics is formulated, additionally only
flow and COD are taken into account and furthermore
it is assumed, that no biological processes takes place
in the sewer network.
The sewer system as well as the biological pro-
cesses are complex and further it is difficult to make
on-line measurements of the pollutants. In Fredericia
the only available real time on-line measurement is
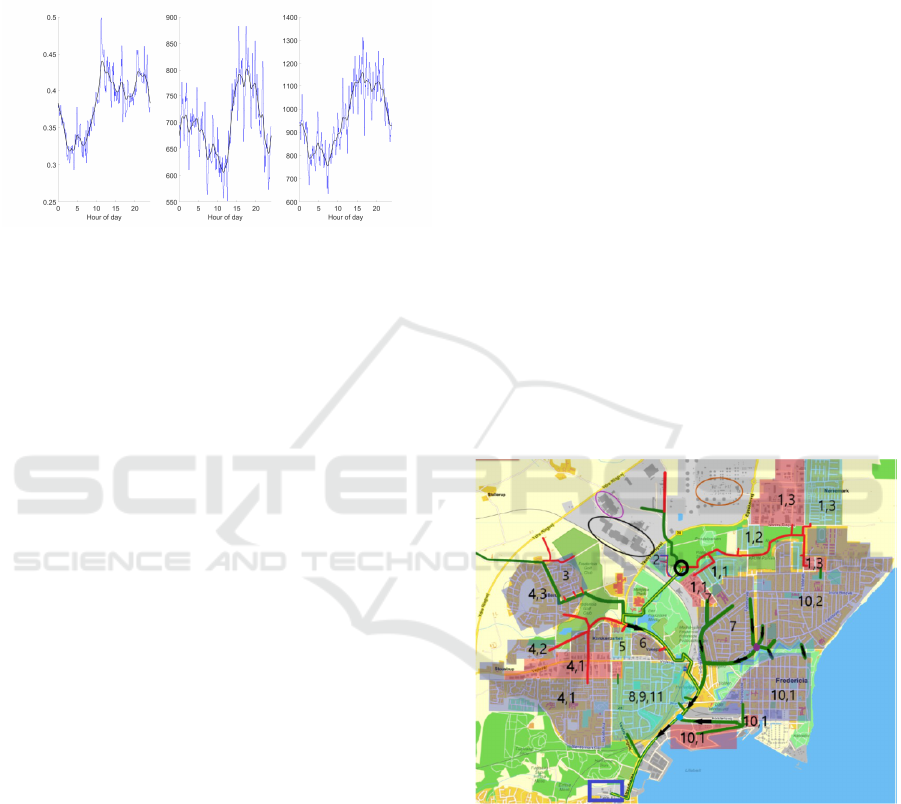
the inlet flow to the WWTP. Off-line measurements of
COD flow and concentration are available from Octo-
ber 2017. The average and filtered average of the total
flow as well as the COD concentration and COD flow
in October 2017 are shown in Fig. 1.
As seen in the figure the shapes of the COD and
222
Nielsen, K. and Pedersen, T.
A Planning Tool for COD Flow Optimisation to a Waste Water Treatment Plant.
DOI: 10.5220/0011296200003271
In Proceedings of the 19th International Conference on Informatics in Control, Automation and Robotics (ICINCO 2022), pages 222-229
ISBN: 978-989-758-585-2; ISSN: 2184-2809
Copyright
c
2022 by SCITEPRESS – Science and Technology Publications, Lda. All rights reserved
flow inlet show the same tendencies. In (Nielsen and
T. S. Pedersen, 2020) a control scheme for minimis-
ing the total mass flow variations at the inlet to the
WWTP using a buffer tank was developed. In the
present work the benefit from including COD mea-
surements is investigated.
Figure 1: 24 hours average flow [l/s], average COD concen-
tration [mg/l] and average COD flow [mg/s] based on mea-
surements from 30 days at the inlet to Fredericia WWTP
(frese.dk, 2018).
Control of sewer systems are described in (Mari-
naki and Papageorgiou, 2005; ?; Pilgaard and Peder-
sen, 2018; ?). A way to minimize the flow variations
is to insert buffer tanks in the sewer network and con-
trol the outputs from these. At the moment no such
tanks are available in the sewer system in Fredericia.
Due to large industrial waste water variations a log-
ical place for a buffer tank is close to the industrial
outlets. An algorithm to control the outflow from a
buffer tank in order to minimize the input flow varia-
tions at the WWTP is developed.
To design a controller, models of the buffer tank,
the sewer network, the household flows and industrial
flows are necessary.
A simple tank model based on a mass balance is
used. A dynamic model describing main characteris-
tics of the sewer network is formulated; in (Nielsen
and T. S. Pedersen, 2020) it is shown that the Saint-
Venant equations under certain assumptions can lead
to a delay model for the flow. The flow delay from a
buffer tank to the WWTP inlet is found from cross
correlation on simulated data. Similarly the COD
concentration delay in the network is identified; this
delay combined with a linear transfer function consti-
tutes the COD model. The model describing the flows
from households to the WWTP is based on measure-
ments.
A Model Predictive Controller (MPC) with a per-
formance function aiming to minimize the variance
of inlet COD flow to the WWTP has been formulated
given buffer tank volume constraints.
To test the benefit of a buffer tank inserted in
the sewer system a realistic simulation describing
flow and concentration dynamics in the Fredericia
sewer system is developed using the EPA’s Storm Wa-
ter Management Model (SWMM) (ProtectionAgency,
2016).
In section 2 the Fredericia sewer system is de-
scribed. Section 3 considers the control concept. The
SWMM simulator is presented in section 4. The
sewer system modelling is described in section 5.
Section 6 is a description of the actual control of the
buffer tank output. The control concept is tested in
SWMM which is described in section 7 and finally
the conclusion is in section 8.
2 FREDERICIA SEWER SYSTEM
Fredericia wastewater treatment plant covers the town
of Fredericia, nearby villages and industrial areas
north and west of the town. The total sewer net is
among the largest in Denmark. Households and in-
dustrial areas north and west of the town dominate the
wastewater in Fredericia. The map shows the north-
ern part of Fredericia divided in subareas. A large
number of pipes leads to the WWTP. In this work, the
pipes from the industrial areas to the WWTP are con-
sidered. These are indicated in the map Fig. 2.
Figure 2: Main sewer system in Fredericia, (Pilgaard and
Pedersen, 2018). The blue square is the WWTP, oval shapes
are industrial areas, black circle is inlet from industry to the
main pipe.
Household wastewater is predictable with regard
to flow (Schlutter, 1999). As seen in Fig. 2, the area
covered by the wastewater plant is large and the sewer
network is split into numerous branches implying that
the shape of the inflow from the households to the
wastewater treatment plant is influenced by varying
delays in flow.
In the WWPT, the quality of the wastewater treat-
ment and biogas production are dependent on the in-
A Planning Tool for COD Flow Optimisation to a Waste Water Treatment Plant
223
flow, as the biological processes needs time for scal-
ing. Smoothing the input flow will improve the qual-
ity of the WWTP processes.
A case study covering the north part of the area
is considered; it comprises the industrial area north
to the city, a buffer tank added close to the industrial
area, the sewer network from the buffer tank to the
WWTP and the residential areas indicated in Fig. 2.
A controller is optimising the output flow from the
tank.
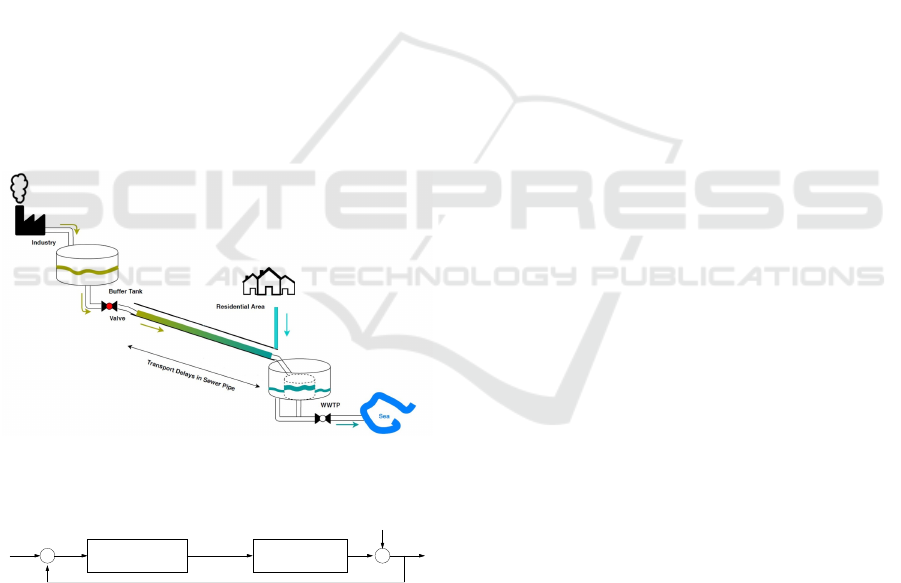
3 CONTROL CONCEPT
The main goal for the control system is to reduce the
COD fluctuations in the inlet, Y , to the WWTP. It
is assumed that the only measurement is Y and the
only controllable variable is the outlet flow U from
the buffer tank. The inlet flow from industries to the
buffer tank is Q
i
. Y
re f
is the WWTP inlet flow refer-
ence. The household flows is added to one flow di-
rectly to the WWTP inlet. In this work, we look at
one buffer tank. The concept for controlling this may
easily be extended to more detention tanks. Fig. 3
shows a sketch of the simplified system.
Figure 3: Simplified sewer system with the main compo-
nents buffer tank, households, sewer pipe and WWTP.
+
ref
Q
h
U Y
Controller Main pipe
+
−
+
Y
Figure 4: Classical control concept for the problem showing
inputs, outputs and disturbances.
A classical control concept is illustrated in Fig. 4.
Q
h
is the total household flow disturbance and is seen
as a flow directly to the WWTP. The model of the
main pipe may include a transport delay; therefore, a
classic controller will result in a low bandwidth and
poor disturbance rejection (Aastrom and Haegglund,
2006; ?). The disturbance is periodic, see Fig. 1, this
periodicity is difficult to take into account in a clas-
sic control concept. It is well known from the clas-
sical control theory that cascading can improve the
performance. More flow measurements in the main
pipe will make this possible and up-stream measure-
ments of the household flow could be used as feed
forwards. Iterative learning control could be another
way to improve a classic controller. A third concept
is to use a neural network. In this work it is cho-
sen to use a Model Predictive controller (MPC); the
method is based on optimisation from prediction via
a plant model. The model can include time delays
and it is possible to incorporate knowledge of future
disturbances (household flow and potentially precipi-
tation) in the optimisation.
4 SWMM MODEL OF
FREDERICIA NORD
A realistic simulation model of the main pipes in
Fredericia Nord is developed using the EPA’s Storm
Water Management Model (SWMM) (ProtectionA-
gency, 2016). SWMM is used for simulations of wa-
ter runoff quantity and quality. It provides an environ-
ment for hydraulic and water quality simulations. The
main sewer system in the northern part of Fredericia
Fig. 2 is modelled based on information on dimen-
sions and location of pipes, channels, drains, man-
holes, storage’s and pumps. Dominating residential
and industrial areas are connected to the main pipe
Fig. 5, the household flow from these areas are con-
structed from typical data from households (Schlutter,
1999) and scaled by the number of inhabitants. In ad-
dition to the existing sewer system elements a buffer
tank are added close to the industrial area.
The purpose of the model is twofold. Test se-
quences of flow and concentrations can be applied
in the network and corresponding data sets for flow
and concentration e.g. at the inlet to the WWTP can
be used to investigate propagation rates and filtration
for flow and concentration. Additionally evaluation of
the control concept can be carried on in the simulation
environment.
5 MODELLING THE SEWER
SYSTEM
A model predictive controller requires development
of an appropriate model. The model may consists of a
description of the industrial wastewater flow and con-
centration, a tank model combined with a model of
the sewer network from the tank to the WWTP and a
ICINCO 2022 - 19th International Conference on Informatics in Control, Automation and Robotics
224
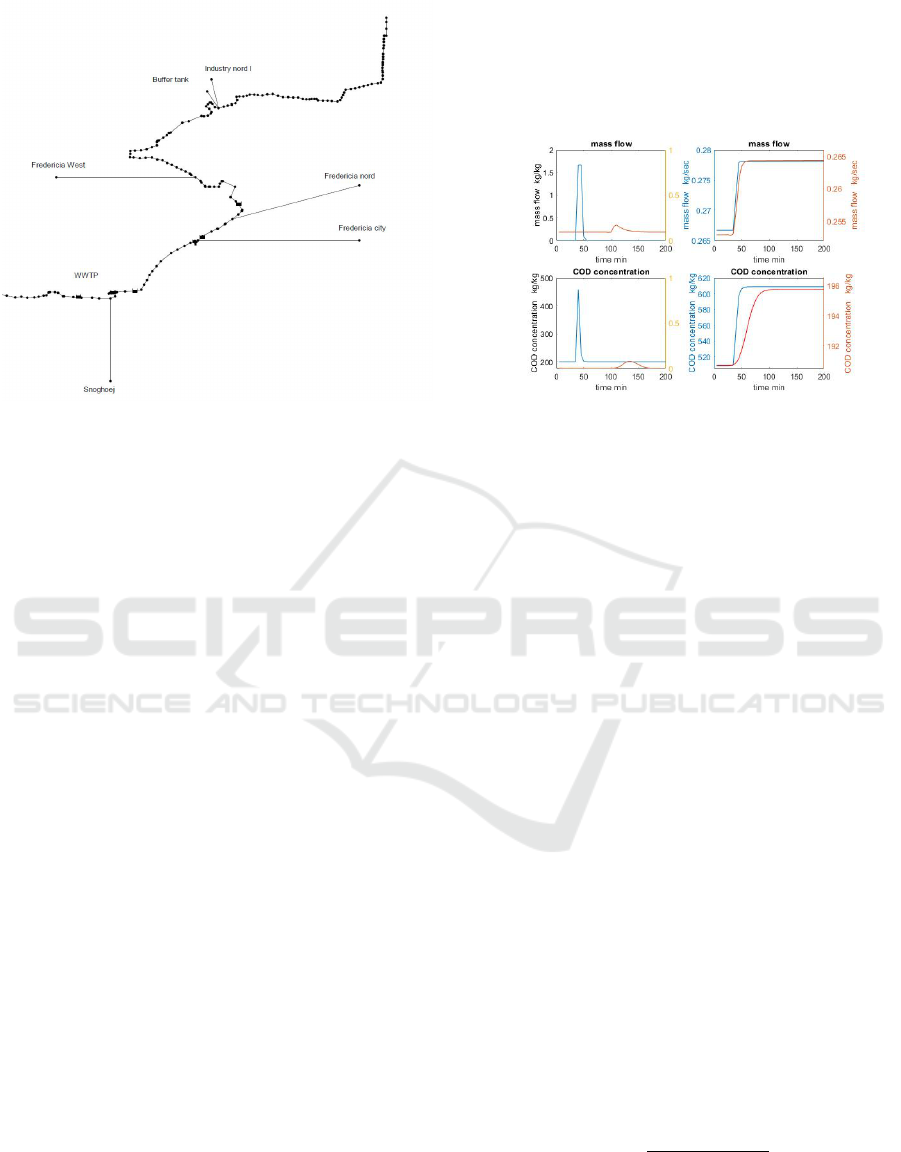
Figure 5: SWMM model of the main sewer system in Fred-
ericia Nord (Pilgaard and Pedersen, 2018).
household flow and concentration disturbance model.
The Sewer Network and Tank Model
The model of the combined tank and sewer system
must be able to show mass flow dynamics and dy-
namics corresponding to the COD flow in the sewer
net from the tank inlet of industrial waste water to the
WWTP. Separate models for mass flow and COD con-
centrations in the network and the tank are developed
and combined to one state space description.
The sewer system is dominated by pipes but also
consisting of manholes, pumps, minor accumulating
tanks etc, Fig. 5. In (Nielsen and T. S. Pedersen,
2020) the connection from the tank to the WWTP is
considered not filled pipes and the pipes are described
as an open channel. Therefore the flow, the level and
the COD content in sewer networks are modelled
by the Saint-Vernant equations (Crossley, 1999),
(Michelsen, 1976), (Andersen, 1977). A simplified
linear model is derived (Nielsen and T. S. Pedersen,
2020) showing that the mass flow in the sewer
network can be modelled as a delay. The COD
concentration propagation rate is assumed to be the
same as for the flow.
In this work a more thorough analysis of the net-
work model is presented. The SWMM model Fig. 5 is
used to provide realistic data for the Fredericia sewer
system. Average flows and concentration are used as
initial values. A mass flow impulse and a COD con-
centration impulse are used to identify delays from
the tank outlet to the WWTP inlet Fig. 6 upper left
and lower left. The simulated values are given with a
sampling rate T
s
of 5 minutes. Even though the out-
let from the tank is diluted by mixing the flow and
concentration from the remaining part of the net, the
figures show clear delays for flow and concentration
from the tank to the WWTP.
Figure 6: SWMM simulations for pipe responses. Upper
left: Impulse mass flow added at the buffer tank (blue) and
the flow at the WWTP (red). Lower left: Impulse in COD
concentration added at the buffer tank (blue) and the con-
centration at the WWTP (dotted). Upper right: Mass flow
at the buffer tank (blue) and at the WWTP (red). The input
is delayed 70 minutes corresponding to 14 samples. Lower
right: COD concentration at the buffer tank (blue) and at
the WWTP (red). The input is delayed 90 minutes corre-
sponding to 18 samples. At all simulations other inputs are
constant.
The delays T
d− f low
and T
d−COD
are determined by
cross correlation..
T
d− f low
= 14samples = 70minutes
T
d−COD
= 18samples = 90minutes
T
d−di f f
= T
d−COD
− T
d− f low
= 4samples = 20minutes (1)
To find the transfer functions mass flow and con-
centration steps are added at the tank outlet. Fig. 6
upper right and lower right shows input steps and cor-
responding data sets for the inlet to the WWTP; in the
figures the tank outputs are staggered by the identified
delays. Fig. 6 upper right shows that the dynamics for
mass flow is negligible and it will not be taken into
account. Fig. 6 lower right is a step in COD concen-
tration. The concentration dynamics are modelled as
a second order system. The parameters are identified
using the system identification tool SENSTOOL (?)
giving a function of the type
k
out
(s) =
Kω
2
s
2
+ 2ζωs +ω
2
k(s) (2)
In the optimisation algorithm the flow delay T
d− f low
is handled by shifting the industrial sequences in rela-
tion to the household sequences. This shifting is done
A Planning Tool for COD Flow Optimisation to a Waste Water Treatment Plant
225
for both flow and concentration. The additional con-
centration delay T
di f f
is included in the model.
k
out
(s) =
Kω
2
s
2
+ 2ζωs +ω
2
e
−T
di f
s
k(s) (3)
The network model is rewritten in state space
form and discretised. The discrete form is
x
1
(t + T
s
)
x
2
(t + T
s
)
:
= A
sec
x
1
(t)
x
2
(t)
:
+ B
sec
k(t) (4)
k
out
= C
sec
x
1
(t)
x
2
(t)
x
1
and x
2
is from equation 3, the additional states
correspond to the number of samples in T
di f
. In short
the state space description for the pipe from the tank
to the WWTP is written as
X
net
(t + T
s
) = A
net
X
net
(t) + B
net
k(t) (5)
k
out
= C
net
X
net
(t)
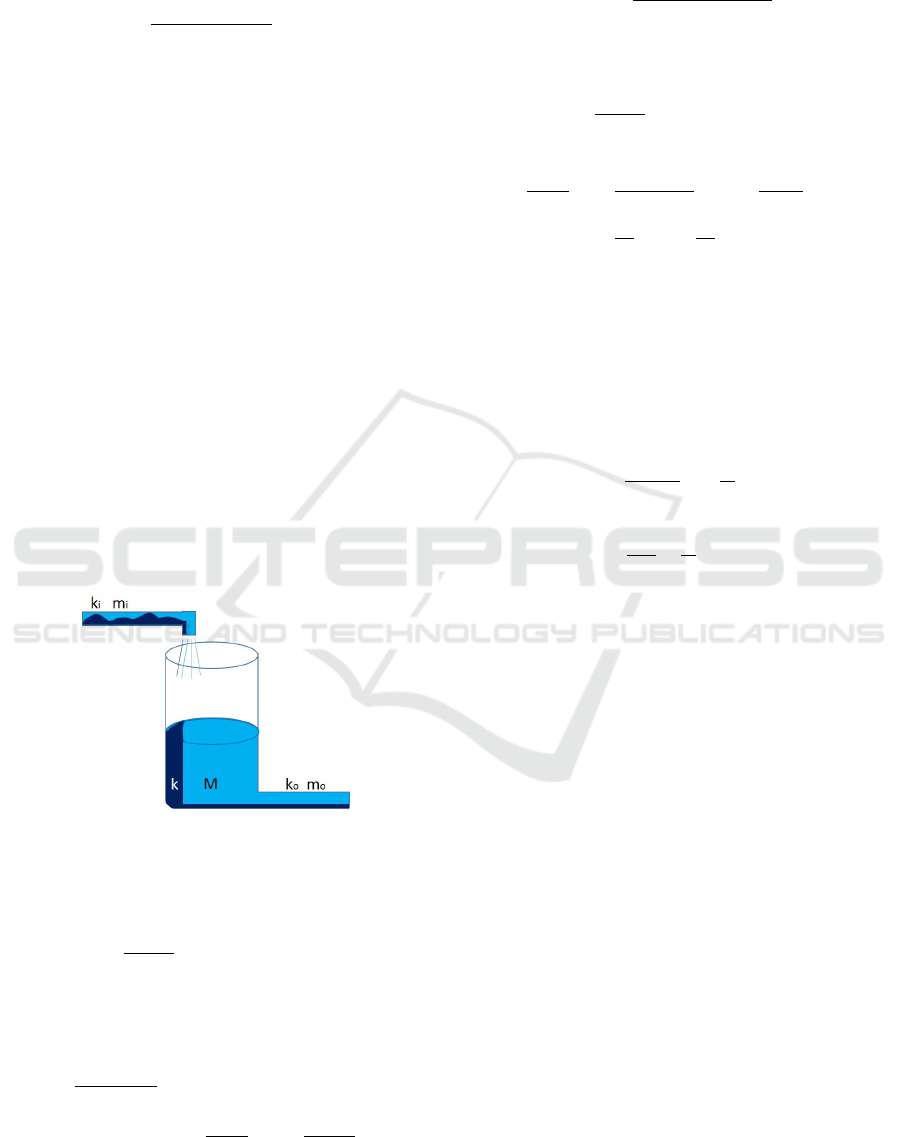
The input to the pipes is output from the buffer
tank. The tank is illustrated in Fig. 7. Tank inflow
is industrial waste water mass flow m
i
with the con-
centration k
i
, tank output is the mass outflow m
o
with
concentration k
o
.
Figure 7: Buffer tank with COD (dark blue) and Water
(light blue).
The total mass in the tank is given by:
dM(t)
dt
= m
i
(t) − m
o
(t) (6)
where M is mass of fluid in the tank.
The COD mass balance is :
dM(t)k(t)
dt
= m
i
(t)k
i
(t) − m
o
(t)k(t)
= M(t)
dk(t)
dt
+ k(t)
dM(t)
dt
(7)
where k is COD concentration in the tank defined
as
k =
kg COD in tank
mass in tank
(8)
Combining equation 6 and 7 and linearizing gives
a model for the MPC
d
ˆ
M(t)
dt
= ˆm
i
(t) − ˆm
o
(t) (9)
d
˙
ˆ
k(t)
dt
= −
¯m
i
(
¯
k
i
−
¯
k)
¯
M
2
ˆ
M(t) +
¯
k
i
−
¯
k
¯
M
ˆm
i
(t)
+
¯m
i
¯
M
ˆ
k
i
(t) −
¯m
i
¯
M
ˆ
k(t) (10)
where ¯· is the operating point and the small signal
value ˆ· is the deviation from the operating point. To
simplify the notationˆis ignored in the succeeding.
The linearised equations 9 and 10 are formulated
in a state space description.
Using the state vector [
ˆ
M(t)
ˆ
k(t)]
T
gives
"
˙
ˆ
M(t)
˙
ˆ
k(t)
#
=
"
0 0
−
¯m
i
(
¯
k
i
−
¯
k)
¯
M
2
−
¯m
i
¯
M
#
ˆ
M(t)
ˆ
k(t)
+
1 0 −1
¯
k
i
−
¯
k
¯
M
¯m
i
¯
M
0
ˆm
i
(t)
ˆ
k
i
(t)
ˆm
o
(t)
(11)
The input matrix is divided : B
i
acting on the in-
dustrial flow and concentration to the tank and B
o
act-
ing on the output flow from the tank ˆm
o
. This output
flow ˆm
o
is the controlled signal.
"
˙
ˆ
M(t)
˙
ˆ
k(t)
#
= A
ˆ
M(t)
ˆ
k(t)
+ B
i
ˆm
i
(t)
ˆ
k
i
(t)
+ B
o
ˆm
o
(t) (12)
On discrete form
ˆ
M(t + T
s
)
ˆ
k(t + T
s
)
= A
d
ˆ
M(t)
ˆ
k(t)
+ B
id
ˆm
i
(t)
ˆ
k
i
(t)
+ B
od
ˆm
o
(t)
(13)
The two equation systems 5 and 13 are combined
in series giving a new state space system where the
output is the tank mass
ˆ
M(t) and the concentration
ˆ
k
out
(t).
X(t + T
s
) = AX(t)+ B
id
ˆm
i
(t)
ˆ
k
i
(t)
+ B
od
ˆm
o
(t) (14)
ˆ
M(t)
ˆ
k
out
(t)
= CX(t)
X(t) is
ˆ
M and
ˆ
k in the tank combined with a num-
ber of states from the second order system combined
with the delays T
di f
.
ICINCO 2022 - 19th International Conference on Informatics in Control, Automation and Robotics
226

The Household Flow and Concentration
Using MPC for optimisation of the COD flow inlet
to the WWTP necessitates prediction of the house-
hold flow. There is no on-line measurements avail-
able. Fredericia WWTP has measured flow and COD
concentration at the inlet to the WWTF during Octo-
ber 2017, Fig. 1. This flow is a combination of house-
hold waste water, industrial waste water and rain. The
industrial outlet is not periodic but it is known that the
average industrial flow is approximately 50 % of the
inlet to the WWTP during dry periods. Rain raises the
flow and lower the concentration. In the network the
household flow has different time delays from differ-
ent parts of the town. Adding waste water from the
inhabited areas these delays have to be taken into ac-
count when estimating the total flow from the house-
holds to the WWTP. In (Nielsen and T. S. Pedersen,
2020) it is shown that it is possible to find a model of
the total the household flow based on the frequency
spectrum for a large number of measurements. A
Kalman filter based on this model and on-line mea-
surements are able to give a prediction of the flow.
Due to the lack of measurements in the sewer-net
it is chosen to use filtered and scaled 24-hour vari-
ations of the total flow and concentration measured
at the inlet to the WWTP as typical average house-
hold waste water values. The optimisation is based
on small signal values, therefore the mean value of
flow and concentration are subtracted. Test sequences
including e.g. weather forecast information can be
added to the mentioned average flow. The small sig-
nal values of the household flow is ˆm
h
and the con-
centration is
ˆ
k
h
.
6 CONTROL OF THE BUFFER
TANK OUTPUT
The aim of the optimisation is to minimise the varia-
tion of the COD-inlet flow to the WWTP.
The total discrete linearised inlet flow
ˆ
Y to the
WWTP at time j is
ˆ
Y ( j) =
¯
k
out
ˆm
o
( j) + ¯m
o
ˆ
k
out
( j) +
¯
k
h
ˆm
h
( j + T
d
− 1)
+ ¯m
h
ˆ
k
h
( j + T
d
− 1) − ˆµ (15)
where
¯
k
h
is the average household concentration
and ˆm
h
is the household flow variation, ¯m
h
is the av-
erage household flow and
ˆ
k
h
is the household concen-
tration variation. ˆµ is the mean value variation.
For the discretised and linear system dynamics,
the MPC problem can be formulated as
min
m
o
J =
H
p
−1
∑
j=0
(
¯
k
out
ˆm
o
( j) + ¯m
o
ˆ
k
out
( j) +
¯
k
h
ˆm
h
( j +T
di f
− 1)
+ ¯m
h
ˆ
k
h
( j +T
di f
− 1) − ˆµ)
2
+ (W
M
ˆ
M( j))
2
(16)
subject to :
x( j + 1) = A
d
x( j) +B
d
m
o
( j) (17)
W
M
is a weight.
The constraints are given by the buffer tank size
and the outflow capacity
0 ≤ M( j) ≤ M
max
0 ≤ m
o
( j) ≤ m
o,max
(18)
Future values for ˆm
o
,
ˆ
k, ˆm
h
and
ˆ
k
h
is part of the
performance. The mean value µ is ˆµ + ¯µ where ˆµ
typically is 0, ¯µ is
¯µ =
∑
H
p
j=1
k
h
( j + T
di f
)m
h
( j + T
di f
) + k
i
( j)m
i
( j)
H
p
(19)
The pipe model includes a delay T
d− f low
repre-
sented as 14 states, eq. (1). The off-line use of the op-
timisation makes it possible to to streamline the opti-
mization code by reducing the pipe model order using
time shifting. The tank out flow is shifted T
d− f low
in
relation to the household sequences. This shifting is
done for both flow and concentration. The additional
industrial concentration delay T
di f f
is included in the
model.
The performance function is now
J =
H
p
−1
∑
j=0
(
¯
k ˆm
o
( j) + ¯m
o
ˆ
k( j) +
¯
k
h
ˆm
h
( j) + ¯m
h
ˆ
k
h
( j) − ˆµ)
2
+ (W
M
ˆ
M( j))
2
(20)
The optimisation problem is solved in (Nielsen.
and Pedersen, 2021) using the technique mentioned
in (Maciejowski, 2002) and the MATLAB function
quad prog.
7 TEST OF THE OPTIMISATION
STRATEGY
Two different tests of the optimisation strategy are
tested in this section. First the concept is tested us-
ing a simple model of the sewer network where the
liquid flow from the tank to the WWTP is approx-
imated by a delay and the concentration propagation
A Planning Tool for COD Flow Optimisation to a Waste Water Treatment Plant
227
rate is approximated by a delay combined with second
order system. Secondly the optimisation algorithm is
tested using the SWMM model of the Fredericia Nord
sewer system in combination with a buffer tank (Pil-
gaard and Pedersen, 2018).
7.1 Test using a Simple Sewer Network
Model
Here the control algorithm is tested using a model of
the sewer network based on one delay for the mass
flow and another delay combined with a second order
transfer function for the COD concentration.
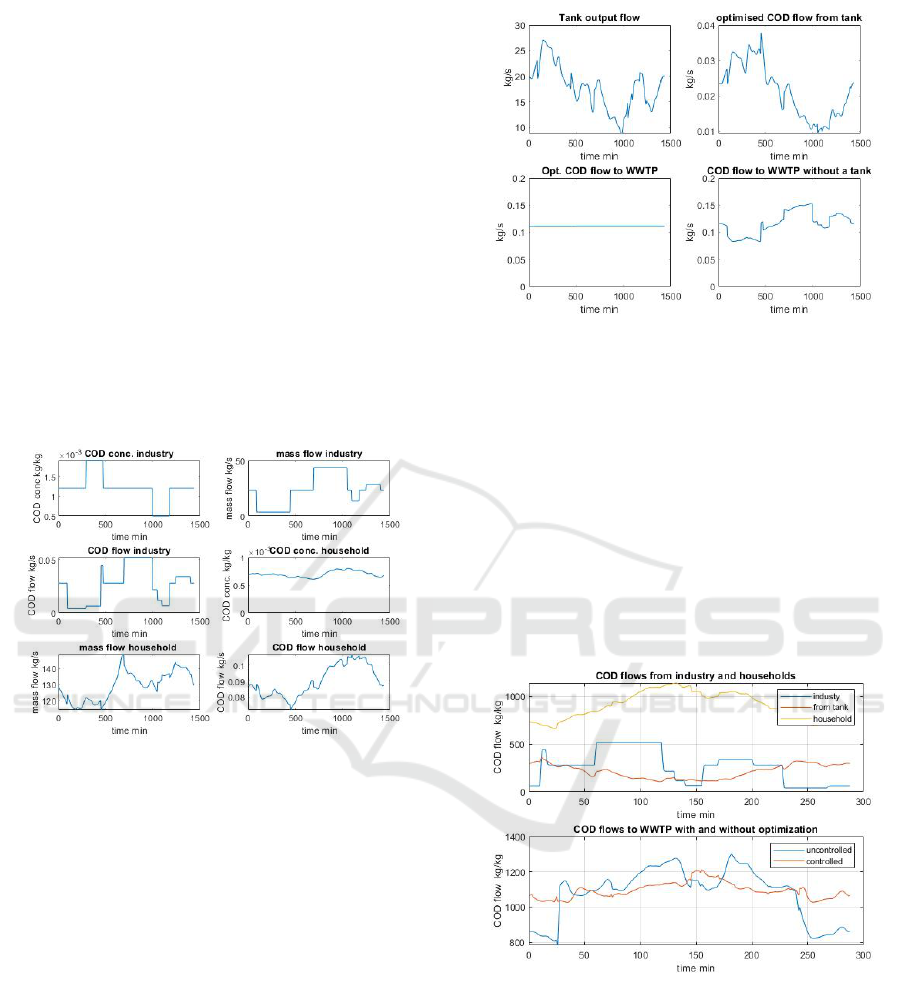
Fig. 8 shows the input sequences for the simula-
tion. The household flow and concentration is based
on measurements from Fredericia; The industrial flow
and the concentrations are constructed test signals.
COD flows are calculated.
Figure 8: Inputs to the test. Upper left is COD concentra-
tion from industry, upper right is mass flow from industry,
mid left is COD flow from industry, mid right is COD con-
centration from households, lower left is mass flow from
households and lower right is COD flow from households.
The results of optimisation is shown in Fig. 9.
The upper left figure shows the outflow from the tank,
the upper right is the COD flow from the tank, the
lower left plot shows the COD flow at the inlet to the
WWTP and the lower right flow is the COD flow to
the WWTP without a tank. It is seen that the algo-
rithm is capable of smoothing changes in the inputs.
7.2 Test using EPA SWMM
At the moment no tank has been established in Fred-
ericia, therefore the control strategy is tested using
the EPA SWMM model of Fredericia Nord sewer net-
work with a tank added at the industrial area. Fig. 10
upper plot shows the COD flows from the household
(yellow) and from industry (blue). The household
COD flow is based on measured data, the industrial
Figure 9: Optimisation results. Upper left is the outflow
from the tank, upper right is the optimised COD flow the
tank, lower left is the COD inflow to the WWTP using op-
timisation and lower right is the COD inflow to the WWTP
without a tank.
input is a test sequence. Additionally the optimised
COD outflow from the buffer tank (red) is shown.
Fig. 10 lower is the COD inflows to the WWTP corre-
sponding to the wastewater flows in the upper figure.
The blue curve is the inlet to the WWTP correspond-
ing to the existing situation without a tank, the red
curve is the result of inserting a tank and optimisa-
tion of the outlet. As seen the flows is significantly
smoothened using the optimisation.
Figure 10: Upper:COD-flows from households(yellow) and
industry (blue) used in the EPA SWMM simulation. Ad-
ditionally the optimised COD outlet (red) from the tank is
shown. Lower: COD flows at the inlet to the WWTP with-
out a tank (blue) and with optimised tank outlet (red).
8 CONCLUSION
The aim of this work is to improve the purification and
bio gas production in WWTPs by securing a smooth
COD flow at the inlet. This is done by inserting a
ICINCO 2022 - 19th International Conference on Informatics in Control, Automation and Robotics
228

buffer tank in the sewer network and develop a opti-
misation algorithm for control of the tank outlet. As
a transition from manual control with few interaction
possibilities to full automation is difficult, an opera-
tor support system to assist in control of the tank is
developed. The control system tends to optimise the
output from the tank with respect to COD flow varia-
tions at the inlet to the WWTP using MPC. The MPC
is based on knowledge on average household waste
water mass flow and COD concentration, prediction
of industrial mass flow and concentration and a model
of the sewer network. Under linear assumptions it is
shown that the mass flow model results in a time delay
and the COD concentration propagation can be de-
scribed as another delay model combined with a sec-
ond order filter. The output from the MPC is the tank
outlet flow. As the result of the work is part of the
basis for building a buffer tank in Fredericia the sys-
tem is tested on a simplified network model and on a
realistic model for Fredericia Nord sewer network im-
plemented in EPA SWMM (ProtectionAgency, 2016).
Tests are showing good results for planning up to 24
hours ahead.
REFERENCES
Aastrom, K. J. and Haegglund, T. (2006). Avanced PID
contro l. ISA.
Andersen, P. (1977). Optimering af driftsbetingelser for
spildevandsanlæg gennem automatisering. Aalborg
University, Denamrk.
Crossley, A. J. (1999). C, Accurate and efficient numeri-
cal solutions for the Saint Venant equations of open
channel flow. University of Nothingham.
DHI (2017). Wats-wastewater aeronoc/anaerobic transfor-
mation in sewers, mike eco lab template. In Scientific
Description. MIKE.
frese.dk (2018). https://www.frse.dk/Fredericia-
spildevand.aspx. urldate: 2018-10-03.
Maciejowski, J. M. (2002). Predictive control: with con-
straints. Pearson education.
Marinaki, M. and Papageorgiou, M. (2005). Optimal real-
time control of sewer networks. Springer Science &
Business Media.
Michelsen, H. (1976). Ikke-stationær strømning i
delvis fyldte kloakledninger: en dimensioneringsme-
tode og en analysemetode. Afdelingen for Jord-
og Vandbygning, Den kgl. Veterinaer-og Landboho-
jskole,Denmark.
Nielsen., K. M. and Pedersen, T. S. (2021). Control of COD
Flow to a Waste Water Treatment Plant. Springer, s.
83-104 22 s. (Lecture Notes in Electrical Engineering,
Vol 793.
Nielsen, K. M. and T. S. Pedersen, C. Kallesøe, P. A. L. S.
M. P. K. M. (2020). Control of sewer flow using a
buffer tank. In Proceedings ICINCO 2020. IEEE.
Pilgaard, T. H. and Pedersen, J. N. (2018). Model Predictive
Control of a Sewer System, Master Thesis, Control
and Automation, Aalborg University. Aalborg Uni-
versity, Denmark.
ProtectionAgency, E. U. S. (2016). Storm Water
Management ModelReference Manual Volume I.
www2.epa.gov/water-research.
Schlutter, F. (1999). Numerical modelling of sediment
transport in combined sewer systems, The Hydraulics
and Coastal Engineering Group, Dept. of Civil Engi-
neering. Aalborg University.
T. Hvitved-Jacobsen, J. Vollertsen, and A. H. Nielsen
(2013). Sewer processes: microbial and chemical pro-
cess engineering of sewer networks. TCRC press.
A Planning Tool for COD Flow Optimisation to a Waste Water Treatment Plant
229
