
Political Analytics on Election Candidates and Their Parties in
Context of the US Presidential Elections 2020
Kalpdrum Passi
a
and Rakshit Sorathiya
b
School of Engineering and Computer Science, Laurentian University, 935 Ramsey Lake Rd., Sudbury, ON, Canada
Keywords: U.S. Elections 2020, Data Mining, Lexical Analysis, US Tweets, Word Tokenization, Word Cloud, Donald
Trump, Joe Biden, Electoral College, US Voting/Elections.
Abstract: The availability of internet services in the United States and rest of the world in general in the modern past
has contributed to more traction in the social network platforms like Facebook, Twitter, YouTube, and much
more. This has made it possible for individuals to freely speak and express their sentiments and emotions
towards the society. In 2020, the United State Presidential Elections saw around 1.5 million tweets on Twitter
specifically for the Democratic and Republican party, Joe Biden, and Donald Trump, respectively. The tweets
involve people’s sentiments and opinions towards the two political leaders (Joe Biden and Donald Trump)
and their parties. The study of beliefs, sentiments, perceptions, views, and feelings conveyed in text is known
as sentiment analysis. The political parties have used this technique to run their campaigns and understand
the opinions of the public. In this thesis, during the voting time for the United States Elections in 2020, we
conducted text mining on approximately 1.5 million tweets received between 15th October and 8th November
that address the two mainstream political parties in the United States. We aimed at how Twitter users
perceived for both political parties and their candidates in the United States (Democratic and Republican
Party) using VADER a sentiment analysis tool that is tailored to discover the social media emotions, with a
lexicon and rule-based sentiment analysis. The results of the research were the Democratic Party’s Joe Biden
regardless of the sentiments and opinions in the in Twitter showing Donald Trump could win.
1 INTRODUCTION
Social Media's popularity can be attributed to
allowing its users to share information and express
their opinions on specific topics. For instance, Twitter
alone has nearly 500 million tweets each day, which
equates to 6,000 tweets per second. Facebook and
Instagram can be said to have even more active users
per day than Twitter. Social Media platforms are
significant sources of Big Data and can offer
businesses insights by providing a public opinion.
The United States witnessed the 59th quadrennial
elections on 3 November 2020. The election process
involves the citizens voting for electors who
eventually vote for the president. The U.S. has 538
electors, and for one to become president, he must
accumulate half of these votes, which is 270 votes.
When an elector wins the ordinary votes, he is then
awarded all the state's electoral votes. All the electors
a
https://orcid.org/0000-0002-7155-7901
b
https://orcid.org/0000-0002-2266-9886
finally make up the Electoral college responsible for
electing the president (BBC News 2020). The
winning party headed by Joe Biden amassed 306
electoral votes and 81.2 million popular votes from
the Americans, which equated to 51.3% of the total
votes cast. The number of eligible voters in the 2020
presidential elections was approximately 239.2
million voters (Medhat W. Hassan, 2014). Those who
voted were 159.8 million Americans, increasing 23.2
million voters from the previous elections in 2016.
Apart from the Republican and Democratic parties
contesting the White House, the Green Party and
Libertarian Party gained traction in some states in the
2020 general elections. However, the most popular
candidates and remained in the news during the entire
election period where the incumbent president
Donald Trump and Joe Biden.
Political parties took their battle in the social
media platforms for further reach, sentimental
454
Passi, K. and Sorathiya, R.
Political Analytics on Election Candidates and Their Parties in Context of the US Presidential Elections 2020.
DOI: 10.5220/0011296300003269
In Proceedings of the 11th International Conference on Data Science, Technology and Applications (DATA 2022), pages 454-460
ISBN: 978-989-758-583-8; ISSN: 2184-285X
Copyright
c
2022 by SCITEPRESS – Science and Technology Publications, Lda. All rights reser ved
analysis, and users' thoughts. The tweets were
collected pre-cisely a month before the elections
because it was a period of heated campaigns. The
extracted data is semi-structured JSON data
containing multiple key-value pairs of twitter data
such as tweet_id, tweet text, etc. It is a complex
dynamic nested structure and poses challenges to
parse the required fields and store them in a structured
manner. The Paper explains how VADER was used
in analyzing social media texts.
1.1 Influence of Social Media on
Elections
Keipo's analysis places the United States in the sixth
position globally regarding its users' social media
activity (Dean B, 2020). Approximately 70% of the
population in the United States are active social
media users. Facebook and Twitter rank in first and
second positions as pertains to the number of active
users. However, Twitter is ranked as the first one for
users who are inclined to politics.
Twitter is well received among all social media
platforms by politicians and journalists because of its
potential political influence on its users. It makes
users express their views with a word limit of only
140 characters. It also must mark extensive following
verified profiles, which helps users filter out tweets
from unverified accounts. Twitter also has features
such as retweeting, which allows more extensive and
quicker reach among its users. These features make
Twitter the best platform for running campaigns by
political parties and leaders. The U.S. Presidential
elections happen after every four years, and with the
rise of internet users on social media platforms, it is
one of the generating sources of Big Data. There are
over 50 million Twitter users in the United States.
The thesis uses 1.5 million tweets collected from
15 October 2020 to 8 November 2020 to relate the
citizens' sentiment with the parties campaigning
timelines and find out if there were any patterns
hidden. This work aims to discover the political
orientation of the users of Twitter towards the leading
parties. The thesis focuses on the user tweets targeted
to Donald Trump and Joe Biden, among the running
candidates. The process is to obtain the texts' polarity
based on words, annotated with the text's weight and
sentiment. The thesis aims to use Valence Aware
Dictionary and Sentimental Reasoner (VADER) (R.
Jose and V. S. Chooralil, 2015). VADER is an
advanced lexicon rule-based sentiment analyzer
which is specialized in analyzing social media texts.
2 LITERATURE REVIEW
Sentiment analysis of tweets data is considered a
much harder problem than standard text, i.e., review
documents. The problem is the frequent use of
irregular and informal words, the limited length of
tweets, and the rapid evolution of Twitter usage. In
Twitter sentiment analysis, a significant amount of
work is carried out, followed by the feature-based
approaches.
2.1 Related Work
In this section, we discuss the related works on
predicting and analysing the result of an election
using Twitter.
Previous studies shows that analysing sentiments
and patterns generate effective results that could be
handy in determining public opinion on the
government's elections and policies (Adam
Bermingham and Alan F Smeaton. 2011). Authors
extract sentiments as emotions concerning the many
leading party candidates, supported that, and
calculated a distance measure (Tunisian, A, 2010).
The distance measure shows the proximity of the
political parties, the smaller space, the higher the
possibilities of close political connections. and show
that Twitter knowledge will help predict the election
polls and derive valuable data regarding public
opinions (O "Connor, B.; Balasubramanyan, R.;
Routledge, B. R.; and Smith, N. A., 2010).
People's social media ideas also impact people's
political parties' choices (M. Eirinaki, S. Pisal, and J.
Singh, 2012). The analyst found out that VADER
exceeds both individual human rates and machine
learning methods.
3 METHODOLOGY
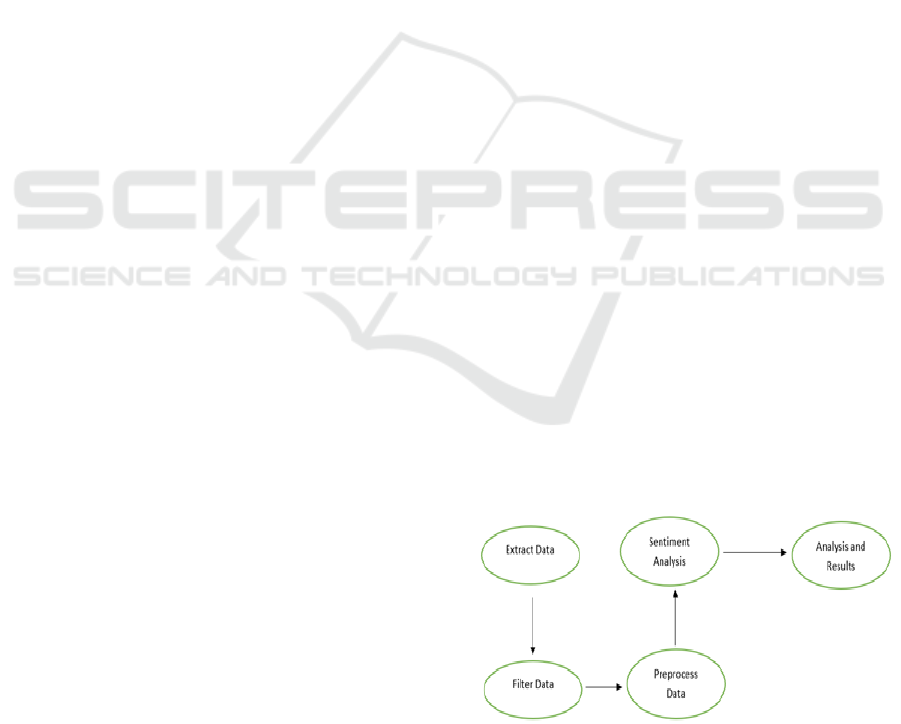
Figure 1: Flow diagram for twitter sentiment analysis.
Figure 1 shows the flow for Twitter sentiment
analysis, starting from the first extraction of tweets
Political Analytics on Election Candidates and Their Parties in Context of the US Presidential Elections 2020
455
from the source to filtering out the data, pre-
processing, sentiment analysis, and the results. The
VADER will help analyse the sentiments and identify
the tweets as either positive, negative, or neutral.
3.1 Data Collection
In this research ‘Tweepy’, a library from Python, is
used to extract the data from Twitter. In this research
Tweepy was used instead of its closest rival Twint
because Tweepy is the official Python library
authorized to access Twitter API.
Twitter API enables developers to extract the user
tweets. However, it has a limited extraction of fewer
than three months, explaining why our extraction was
only one month. The data is usually stored in JSON
format. We used a Python script to extract the
required key from the JSON schema. The list of key-
value pairs parsed out from the JSON.
The data downloaded is 1.5 million tweets that
were collected for three weeks. This research
emphasized on tweets that mentioned the two running
candidates from the Democratic and Republican
parties. The data was extracted from a JSON object
(data interchange file format), a semi-structured data
file format.
The information obtained from the JSON object
includes hashtags, URL profile image, counts of
followers, friends and statuses, tweet text and locale
among other useful variables with regards to a tweet
and the user profile.
The information below shows a list of keywords
used for extracting user tweets related to each party
and leader. We used the #(explore) to extract the
unique hashtags for the candidates.
For Donald Trump and Mike Pence (Republican
Party).
(#Republican, #DonaldTrump, #voting, #Trump,
#HarrisCounty, #MAGA2020,
#TrumpIsANationalDisgrace,
#TrumpVirusDeathToll, #Trump-Covid,
#EndTrumpChaos, #TrumpTaxReturns,
#DumpTrump2020, #TrumpLies)
For Joe Biden and Kamala Harris (Democratic
Party)
(#BidenLies, #BidenLies,
#VoteBlueToSaveAmerica, #VoteBlue,
#VoteBidenHarris2020,
#BidenHarrisToSaveAmerica)
For anything else related to elections, we used the
following keywords:
(#ExGOP, #GOPSuperSpreaders,
#AmericasGreatestMistake, #TrumpVsBiden,
#PresidentialDebate, #PresidentialDebate2020,
#Election2020, #TrumpBidenDe-bate, #Propaganda,
#USPresidentialDebate2020, #USElection2020,
#BountyGate, #BLM, #BlackLivesMatter,
#Elections, #VoteLibertarian, #Opinion, #Coun-
tryOverParty, #nhPolitics, #VoteForAmerica,
#PlatinumPlan, #Presidential-Debates2020, #Debate,
#SuperSpreader)
3.2 Data Pre-Processing
Natural Language Processing (NLP): This is part of
the study at the intersection of computer science and
linguistics. The computer uses NLP to extract
meaning from natural human language. Non-
structured data is processed using NLP steps, which
are later documented to analyze the words' polarity
using WordNet, SentiWordNet. The mechanisms
used in the extraction of information include Word
Stemming and lemmatization, stop word analysis,
word tokenization, word sense disambiguation, etc.
Natural Language Toolkit (NLTK): This is a free,
open-source Python package that provides a few tools
for building programs and classifying data. NLTK
provides an easy way to use the interface of over 50
corpora and lexical resources, which includes a group
of text processing libraries for classification,
tokenization, stemming, tagging, parsing, and
semantic reasoning.
Figure 2: Word cloud for Donald Trump and Joe Biden.
Figure 2 demonstrates the Word cloud which is a
visualization wherein the more frequent words appear
large, and therefore, the less frequent words seem to
be even smaller. It is used in identifying the
commonly used words in tweets.
VADER Sentiment Analysis: VADER is a rule-
based lexicon and sentiment analysis tool that is
exceptionally accommodating to the social media
platform's sentiments. It tells about the positivity or
negativity of a score and its positive, negative, or
neutral sentiment. VADER is available in the NLTK
DATA 2022 - 11th International Conference on Data Science, Technology and Applications
456
package and can be applied directly to unlabelled text
data.
4 RESULTS AND DISCUSSION
In this section, we will discuss regarding the results
produced after the implementation of the proposed
methodology.
We calculated each user's mean sentiment
towards the candidates considering each user's
political party and candidate's timeline. We checked
the tweet distribution in different states as well as the
overall sentiment for the two candidates. We also
checked the tweet distribution of daily sentiments for
each of the candidates.
After filtering the tweets based on the keywords
listed in the data collection section, we ended up with
1.5 million tweets. We pre-processed the data by
cleaning the raw tweets and mapping them to a
candidate as per the positive, neutral, and negative
sentiments they got as follows.
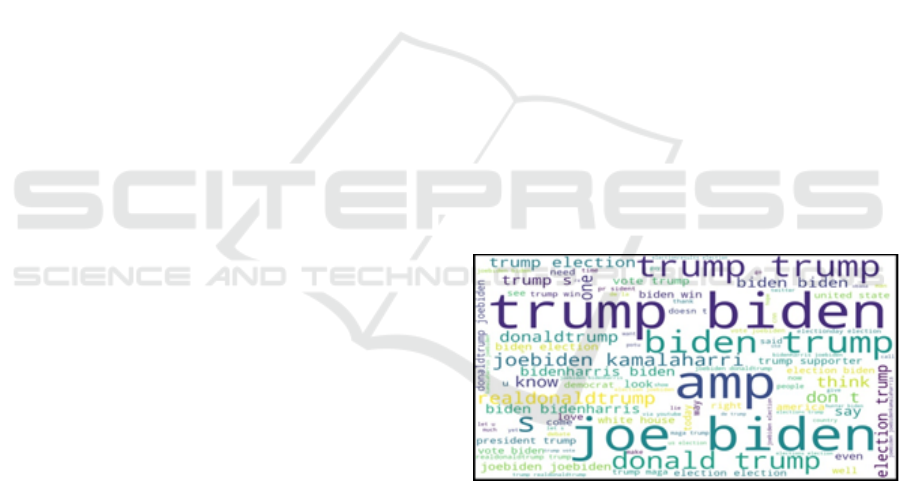
Figure 3 of the findings shows the overall
sentiments that the Twitter users had concerning the
two candidates. The users had more negative things
to tweets about Trump than Biden. The overall
negative tweets about Trump were 35%, while those
for Biden were 23%, a difference of 12%. Biden also
took the lead on the positive tweets as well as neutral
tweets. This could be attributed to Biden's running for
the first time as president, unlike Trump, who was
having a second run for the presidency. Sentiments
about Trump were evenly distributed, each taking
one-third of the total sentiments, and thus would be
difficult to predict people's general views using the
pie chart.
Figure 3: Sentiment distribution of each candidate.
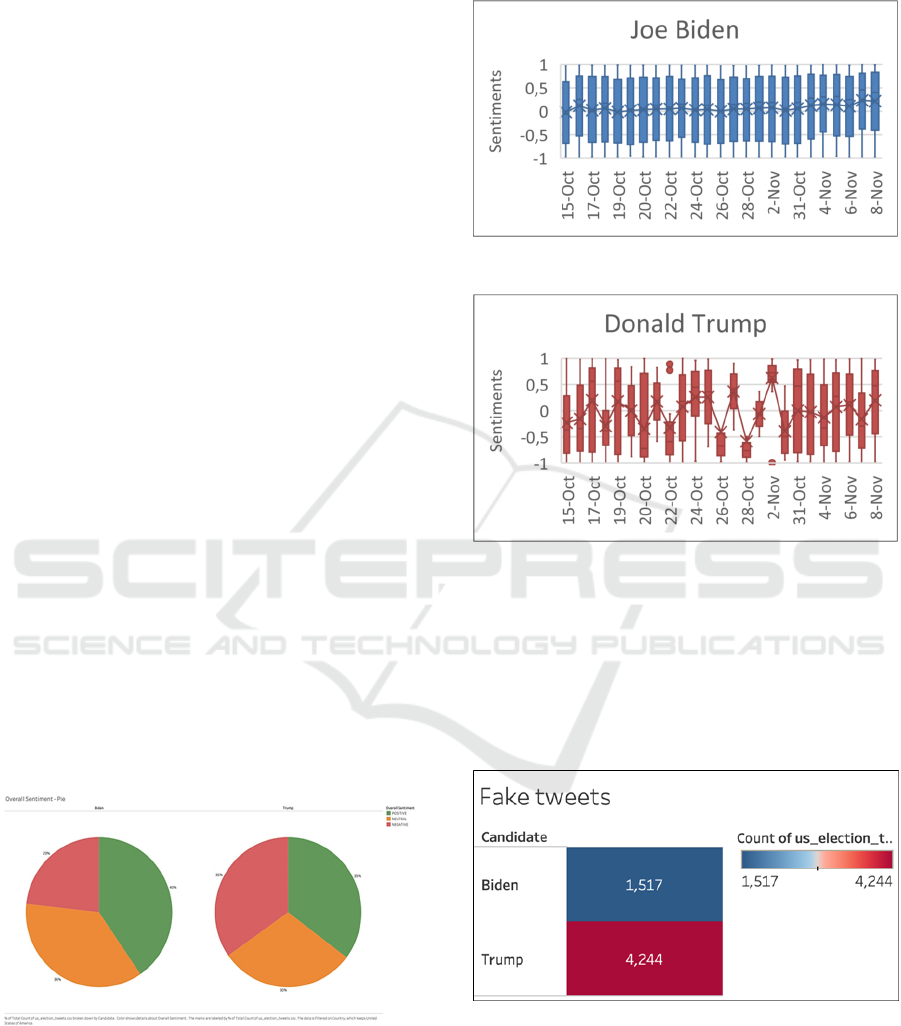
Figure 4 displays the breakdown of sentiments for
the candidate of Democratic party Joe Biden on daily
basis during the election period and campaigning
from 15th October 2020 until 8th November 2020.
There is stable sentiment observed for Joe Biden
compared to Donald Trump.
Figure 4: Daily change in sentiment for Joe Biden.
Figure 5: Daily change in sentiment for Donald Trump.
Figure 5 indicates the breakdown of sentiments
for candidate of Republican party Donald Trump. It
can be observed that there are drastic changes
observed in terms of daily sentiments for Donald
Trump compared to Joe Biden. This can be attribute
to the fact that Donald Trump was acting president
during the elections.
Figure 6: Number of tweets detected by ‘Fake’ keyword for
each candidate.
Figure 6 show the distribution of fake tweets for both
Biden and Trump. Trump had a total of 4244 fake tweets
while Biden had 1517 fake tweets. These fake tweets acted
as channels of misleading the people that the individual
candidates had traction while in real sense they did not. These
Political Analytics on Election Candidates and Their Parties in Context of the US Presidential Elections 2020
457

tweets were identified based on the keywords/hashtags in the
tweets posted and shared by users in twitter.
Figure 7: Polynomial sentiment trend of tweets for Donald
Trump and Joe Biden.
Figure 7 show the polynomial trendline indicating
the number of tweets with sentiments over the time
frame 15th October to 8th November along with
sentiments. It can be observed that even though
Democratic party and its candidate Joe Biden
received few sentiments (tweets) from public
compared to Republican party and its candidate
Donald Trump, but they were leading in terms of
positive sentiments. There was also a drastic change
observed for Democratic party and its candidate Joe
Biden in terms of positive sentiments (tweets) just
few days before the election day.
In this research, it is observed that The Republican
party who was leading in terms of sentiments in key
states namely Alaska, South Dakota and Mississippi
won the electoral votes as well by 52.8%, 61.8% and
57.5% respectively. On the contrary, it is noticed that
the three key states Florida, Texas, and Ohio where
people expressed more sentiments towards
Democratic party, but Republican party was leading
in electoral votes with 51.2%, 52.1% and 53.3%
respectively.
Table 1: Vote share comparison with Positive and Negative
sentiment.
Joe Biden Donald Trump
State
Negative
Sentiment
Positive
Sentiment
Vote
Share
Negative
Sentiment
Positive
Sentiment
Vote
Share
Arizona 44.0% 50.0% 49.3% 56.0% 50.0% 49.0%
Florida 33.0% 41.0% 47.8% 67.0% 59.0% 51.2%
Georgia 39.0% 49.0% 49.4% 61.0% 51.0% 49.2%
Michigan 34.0% 47.0% 50.2% 66.0% 53.0% 47.8%
Nevada 30.0% 46.0% 50.0% 70.0% 54.0% 47.6%
North
Carolina
33.0% 45.0% 48.5% 67.0% 55.0% 49.9%
Ohio 38.0% 48.0% 45.2% 62.0% 52.0% 53.2%
Pennsylvania 26.0% 43.0% 50.0% 74.0% 57.0% 48.8%
Wisconsin 35.0% 54.0% 49.4% 65.0% 46.0% 48.8%
Table 2: Distribution of tweet sentiments by party.
Party Positive Negative Neutral
Republican 56% 69% 55%
Democratic 44% 31% 45%
Table 3: Distribution of tweet sentiments by candidates.
Candidate Positive Negative Neutral
Donald
Trump
49% 73% 48%
Joe Biden 51% 27% 52%
Table 2 and Table 3 show that the Republican
party has more positive sentiments (56%) than its
candidate Donald Trump (35%). Also, the
Republican party still has more negative sentiments
of 69% than its candidate Donald Trump with 23%
negative tweets. The citizens are more neutral about
the Republican Party with 55% compared to
Democratic Party with 45%. In the overall
distribution of the positive, negative, and neutral
sentiments, the Republican party had more sentiments
than the Democratic Party. This is because the
Republican Party stood as the acting party during the
election.
Table 2 and Table 3 also demonstrates that the
distribution of the tweet sentiments for the individual
candidates was generally lower than that of the party.
These distributions can be interpreted to mean that the
parties are more popular in the United Stated than the
candidates that flag them. There is a wide range
between the overall tweet sentiments for the
Republican Party and its running candidate Donald
Trump. This trend is unlike the range between the
Democratic Party and the running candidate Joe
Biden which is an average of 4% differences.
The research was also conducted to identify the
sentiments by several age groups towards each
election parties in context of presidential election.
Table 4 show the distribution of votes by age group.
It can be observed that younger people (age 18-44)
voted more for democratic party whereas elder people
(age 45 and above) voted more for the Republican
party. The US citizens of age group 45-64 have the
highest ratio of participation for voting with 38%
voters, followed by the second age group of 30-44
with 23% of voters. This demonstrates that
individuals in the 30-64 age range were most likely to
use social media sites to voice their opinions on the
parties and politicians running for President of the
United States in 2020.
DATA 2022 - 11th International Conference on Data Science, Technology and Applications
458

Table 4: Distribution of votes by age group.
Democratic Party Republican Party
18-29
17% Voters
60% 36%
30-44
23% Voters
52% 46%
45-64
38% Voters
49% 50%
65 and over
22% Voters
47% 52%
Considering the sentiments in Table 4, the
Republican party was leading in terms of positive,
negative, and neutral sentiments with the fair bit of
margin than Democratic party. However, Republican
party was also leading in terms of negative sentiments
compared to positive sentiments. From Table 5, it can
be concluded, although people expressed their
sentiments more towards Republican party and its
candidate Donald Trump, but more than half of the
votes was bagged by Democratic party and its
candidate Joe Biden.
Table 5 show that out of 538 members of electoral
college, Democratic party managed to win 306
electoral votes (270 electoral votes needed to win)
and Republican party won 232 electoral votes. The
Democratic party also took a lead in terms of Senate
Votes winning 53 votes compared to Republican
party winning 47 votes. The House votes also
favoured the Democratic party to take a lead by 222
votes compared to Republican party who won 211
votes.
Table 5: Distribution of seats won by Candidates and their
parties in the US Presidential elections 2020.
Candidate Party
Electoral
Votes
Senate
Votes
House
Votes
Popular
vote
Percentage
equivalent
Joe Biden Democratic 306 53 222 81,283,098 51.3%
Donald
Trump
Republican 232 47 211 74,222,958 46.8%
5 CONCLUSION AND FUTURE
WORK
In this research, we aimed to conduct a Twitter
sentiment analysis for the 2020 U.S. presidential
elections for Donald Trump and Joe Biden and their
respective parties. We extracted user tweets from
Twitter archiver from 15 October to 8 November
2020 based on keywords and hashtags related to the
trend observed during the election period.
We used VADER to calculate the text's polarity
expressed in social media better than the traditional
dictionary-based approach that maintains WordNet
for positive, negative, and neutral polarity keywords.
It was seen that people had higher positive sentiments
for Joe Biden and his Democratic party than they did
Donald Trump. The sentiment analysis results follow
the actual election results whereby sentiments give an
indication of the voting pattern. Therefore, we can
conclude that sentiment analysis can indicate the
trend in the elections.
We visualize some future directions for this study.
Our primary focus was on classifying positive,
negative, or neutral sentiments correctly. However, it
would be interesting to discover between subjective
and objective tweets since it would be a more
effective filter. In our approach, we handle
classification for tweets based on party and
candidates' keyword. Still, a more elaborated method
could be developed where the context or even
synonyms are considered.
In this study, we concentrated on Twitter, but
more social media networks could be added. We
distinguished some changes to include completely
various types of training datasets turned to other
social networks, and more heuristic rules are present
in other area contexts. Additionally, it would be
interesting to develop datasets and trained machine
learning with a more balanced combination of tweets
from different sources.
REFERENCES
A. Das and S. Bandyopadhyay, "SentiWordNet for
Bangla," Knowledge Sharing Event-4: Task, Volume 2,
2010.
Adam Bermingham and Alan F Smeaton. 2011. On using
Twitter to monitor political sentiment and predict
election results. In Proceedings of the Workshop on
Sentiment Analysis where A.I. meets Psychology
(SAAIP 2011), pages 2–10.
BBC. (, 2020). U.S. election 2020: What is the electoral
college?. Retrieved 13 January 2021, from https://
www.bbc.com/news/world-us-canada-53558176
B. Liu, Sentiment Analysis and Opinion Mining. Morgan &
Claypool Publishers, 2012.
C. J. Hutto and E. E. Gilbert, "VADER: A Parsimonious
Rule-based Model for Sentiment Analysis of Social
Media Text. Eighth International Conference on
Weblogs and Social Media," presented at the
Proceedings of the Eighth International AAAI
Conference on Weblogs and Social Media, Ann Arbor,
MI, 2015.
D. Das and S. Bandyopadhyay, "Labeling emotion in
Bengali blog corpus - a fine-grained tagging at the
sentence level," Proceedings of the 8th Workshop on
Asian Language Resources, pp. 47–55, Aug. 2010.
Political Analytics on Election Candidates and Their Parties in Context of the US Presidential Elections 2020
459

Dean, B. (2020). How Many People Use social media in
2020? (65+ Statistics). Retrieved 13 January 2021, from
https://backlinko.com/social-media-users
D. J. S. Oliveira, P. H. de Souza Bermejo, and P. A. dos
Santos, "Can social media reveal the preferences of
voters? A comparison between sentiment analysis and
traditional opinion polls," Journal of Information
Technology & Politics, vol. 14, no. 1. pp. 34–45, 2017,
DOI: 10.1080/19331681.2016.1214094.
Kim, S., Hovy, E. Determining the sentiment of opinions.
International Conference on Computational Linguistics
(COLING'04). 2004.
Luciano Barbosa and Junlan Feng. Robust Sentiment
Detection on Twitter from Biased and Noisy Data. In
Proceedings of the international conference on
Computational Linguistics (COLING), 2010.
M. Eirinaki, S. Pisal, and J. Singh, "Feature-based opinion
mining and ranking," Journal of Computer and System
Sciences, vol. 78, no. 4. pp. 1175–1184, 2012, DOI:
10.1016/j.jcss.2011.10.007.
Medhat, W., Hassan, A., & Korashy, H. Sentiment Analysis
algorithms and applications: A survey. AinShams
Engineering Journal, 5(4), 1093-1113. 2014.
Miao, H. (2020). 2020 election sees record-high turnout
with at least 159.8 million votes projected. Retrieved 13
January 2021, from https://www.cnbc.com/2020/11/04
/2020-election-sees-record-high-turnout-with-at-least-
159pnt8-million-votes-projected.html
O "Connor, B.; Balasubramanyan, R.; Routledge, B. R.; and
Smith, N. A. 2010. From Tweets to Polls: Linking Text
Sentiment to Public Opinion Time Series. In ICWSM
Parrott, W. G. "Emotions in social psychology: Volume
overview." Emotions in social psychology: Essential
readings. Ed. W. G. Parrott. Philadelphia: Psychology
Press, 2001: 1-19.
Tunisian, A.; Sprenger, T. O.; Sandner, P.; and Welpe, I.
2010. Predicting elections with Twitter: What 140
characters reveal about political sentiment. In
Proceedings of ICWSM
VADER Sentiment Analyzer, "https://github.com/cjhutto/
vaderSentiment
R. Jose and V. S. Chooralil, "Prediction of the election
result by enhanced sentiment analysis on Twitter data
using Word Sense Disambiguation," Proc. Int’l Conf.
on Control Communication & Computing India
(ICCC), Trivandrum, 2015, pp. 638-641.
Tumasjan, A.; Sprenger, T. O.; Sandner, P. G.; and Welpe,
I. M. 2010. Predicting elections with Twitter: What 140
characters reveal about political sentiment. ICWSM
10(1):178–185.
Twitter Archive, https://archive.org/details/archiveteam-
twitter-stream-2019-05.
S. Bird, E. Klein, and E. Loper, Natural language
processing with Python: analyzing text with the natural
language toolkit. "O'Reilly Media, Inc.," 2009.
Natural Languages Toolkit NLTK toolkit, www.nltk.org
DATA 2022 - 11th International Conference on Data Science, Technology and Applications
460
