Visual RSSI Fingerprinting for Radio-based Indoor Localization
Giuseppe Puglisi
1 a
, Daniele Di Mauro
1 b
, Antonino Furnari
1 c
, Luigi Gulino
2
and Giovanni M. Farinella
1 d
1
Department of Mathematics and Computer Science, University of Catania, Catania, Italy
2
Orangedev S.r.l., Italy
Keywords:
RSSI, Indoor Localization, BLE Beacon, LSTM, Structure from Motion.
Abstract:
The problem of localizing objects exploiting RSSI signals has been tackled using both geometric and machine
learning based methods. Solutions machine learning based have the advantage to better cope with noise, but
require many radio signal observations associated to the correct position in the target space. This data collec-
tion and labeling process is not trivial and it typically requires building a grid of dense observations, which
can be resource-intensive. To overcome this issue, we propose a pipeline which uses an autonomous robot to
collect RSSI-image pairs and Structure from Motion to associate 2D positions to the RSSI values based on the
inferred position of each image. This method, as we shown in the paper, allows to acquire large quantities of
data in an inexpensive way. Using the collected data, we experiment with machine learning models based on
RNNs and propose an optimized model composed of a set of LSTMs that specialize on the RSSI observations
coming from different antennas. The proposed method shows promising results outperforming different base-
lines, suggesting that the proposed pipeline allowing to collect and automatically label observations is useful
in real scenarios. Furthermore, to aid research in this area, we publicly release the collected dataset comprising
57158 RSSI observations paired with RGB images.
1 INTRODUCTION
Being able to infer the position of an object, a person
or a robot in an environment is an important task for
many applications including tracking goods in a ware-
house, helping people to localize themselves (Furnari
et al., 2016; Battiato et al., 2009) and navigate an en-
vironment, or predicting their intent (Kamali, 2019;
H
¨
ane et al., 2017; Gupta et al., 2017; Ragusa et al.,
2020; Furnari et al., 2018). To tackle this problem,
different technologies have been used so far: GPS,
radio-wave signals, laser ranging scanners, and cam-
eras (Xiao et al., 2016). Among these approaches,
we focus on radio-wave signals, which are convenient
thanks to cheap and unobtrusive hardware solutions,
which work also in indoor settings (e.g., based on
WiFi or Bluetooth).
Localization through radio-wave signals lever-
ages the processing of RSSI values (Received Signal
Strength Indication - a measure of the power of a ra-
dio signal) observed by a beacon attached to the ob-
ject to be localized while receiving signals from a set
a
https://orcid.org/0000-0001-9458-2213
b
https://orcid.org/0000-0002-4286-2050
c
https://orcid.org/0000-0001-6911-0302
d
https://orcid.org/0000-0002-6034-0432
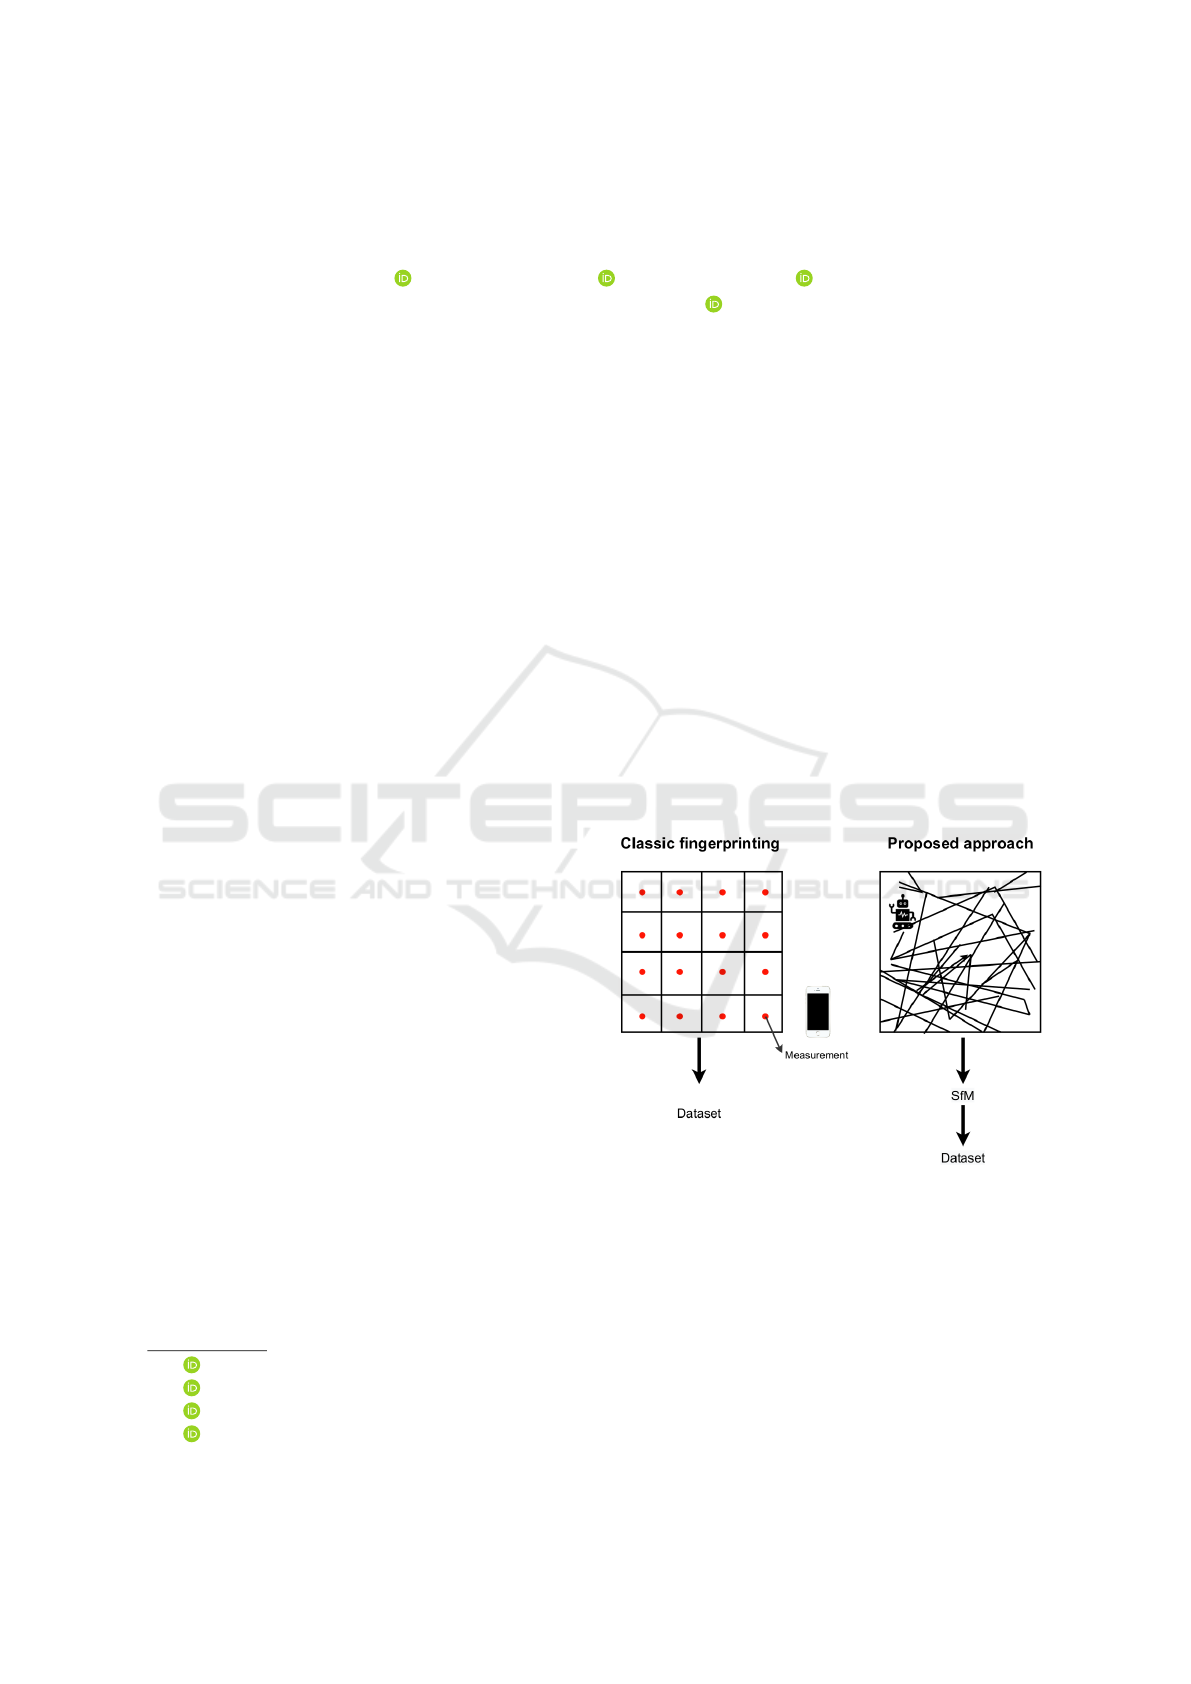
Figure 1: Classic manual fingerprinting compared to the
proposed approach.
of antennas placed at known locations (Zafari et al.,
2019). Since RSSI values can be used to estimate the
distance between the observer (the object to be local-
ized) and the signal emitter (an antenna placed at the
known location), geometric methods can be used to
estimate the target location directly.
However, the feasibility of this method is hindered
by the fact that RSSI values tend to have two main
limitations: ambiguity, i.e. two different devices at
70
Puglisi, G., Di Mauro, D., Furnari, A., Gulino, L. and Farinella, G.
Visual RSSI Fingerprinting for Radio-based Indoor Localization.
DOI: 10.5220/0011299900003289
In Proceedings of the 19th International Conference on Signal Processing and Multimedia Applications (SIGMAP 2022), pages 70-77
ISBN: 978-989-758-591-3; ISSN: 2184-9471
Copyright
c
2022 by SCITEPRESS – Science and Technology Publications, Lda. All rights reserved

the same position can measure different RSSI values
(and vice-versa), and instability, i.e., objects present
in the environment, other radio signals or external
factors (e.g. an electrical station with radio base an-
tennas) can create noise, disturb the radio signal and
make the measure less reliable. These limitations can
be partially tackled using approaches based on ma-
chine learning (Zafari et al., 2019). Such approaches
rely on a set of offline RSSI measurements associ-
ated to target positions which are used as a set of “ex-
amples” indicating the relationship between observed
values and target positions. These observations are
used to train a machine learning model such as an ar-
tificial neural network. The model is then able, at run
time, to estimate the position from newly observed
RSSI values. The main advantage of this approach is
that the trained algorithm can implicitly model sensor
noise as well as the positions of the antennas, which
hence do not need to be known beforehand. On the
downside, collecting RSSI and target position pairs
is generally a non-trivial task and often involves per-
forming measurements at known positions sampled
through a dense grid over the environment see Fig-
ure 1. This manual process is often time-consuming,
tedious, and prone to error.
In this work, we propose to leverage an au-
tonomous robot randomly moving in the target en-
vironment to densely collect RSSI observations at
various locations. Each RSSI value is associated to
an image captured from the robot’s point of view.
We then use structure from motion (SfM) to cre-
ate a 3D model of the environment. By relying on
a small set of images captured at known positions,
we recover the correct scale and orientation of the
3D model. At the end of this process, each image,
and hence each RSSI observation, is associated to a
position within the environment, which can be used
to form < RSSI,target position > pairs suitable for
model training. It is worth noting that, differently
from previous works relying on RSSI observations
manually acquired at known locations, the proposed
procedure is automatic and naturally allows to ob-
tain a large quantity of examples. Figure 1 illustrates
the proposed data acquisition pipeline, which is de-
scribed in details in Section 3. To study the suitabil-
ity of the proposed pipeline to tackle the localization
problem, we collect a dataset in an office environment
and benchmark different neural network approaches.
Results show that a model based on a set of Long-
Short Term Memory (LSTM) networks specialized on
the values coming from the different antennas obtains
best results, which is an approach made possible by
the large amount of labeled examples gathered with
the proposed pipeline.
The main contributions of this work are as fol-
lows: 1) we propose a pipeline to collect and automat-
ically label RSSI observations, exploiting a mobile
robot and structure from motion techniques, 2) fol-
lowing the proposed pipeline, we collect and release
1
a dataset suitable to study indoor localization through
RSSI values and machine learning, 3) we benchmark
different methods based on artificial neural networks
on the considered task and propose a method based
on LSTMs which achieves promising performance.
The remainder of the paper is organized as fol-
lows: Section 2 presents the state of the art in the
field, Section 3 describes the proposed pipeline and
presents the collected dataset, Section 4 presents the
proposed method, Section 5 introduces experiments
and show the results and finally Section 6 concludes
the paper.
2 RELATED WORKS
Our work is related to two research lines: localization
using radio signals and collection of datasets suitable
for localization. The following sections discuss the
relevant research works.
2.1 Localization using Radio Signals
and Machine Learning
Previous works have investigated methods to local-
ize a target in an environment using radio signals. In
this section, we focus on the approaches based on
machine learning. Two early works (Battiti et al.,
2002; Brunato and Battiti, 2005) performed indoor
localization using a Multi-Layer Perceptron, which
achieved results comparable with respect to a K
Nearest-Neighbors (KNN) algorithm in the localiza-
tion of a mobile device. The authors of (Obreja et al.,
2018) addressed the localization task leveraging a col-
lection of RSSI measurements obtained by 3 beacons.
The method used to retrieve the pose is a KNN ap-
proach which reaches an accuracy between 5 and 6
meters in an indoor environment of 98m
2
. I-KNN,
presented in (Kanaris et al., 2017), combines the BLE
Beacons technology with a radiomap created with Wi-
Fi RSSI information to improve localization. The
method obtains an average error of 2.58 meters in an
indoor environment of 160 m
2
. A feed-forward Multi-
Layer Perceptron was used in (Dai et al., 2016). The
method is divided into three stages: a transforming
stage, a denoising stage and a locating stage. Local-
1
The dataset is available at the following URL:
https://iplab.dmi.unict.it/VisualRSSI
Visual RSSI Fingerprinting for Radio-based Indoor Localization
71

RSSIs
FRAMES
VISUAL RSSI FINGERPRINTING
STRUCTURE FROM MOTION
5 ANTENNAS RSSIs & 2D POSES
A B C D E
…
…
o
0
o
n
x y
A B C D E x y
Figure 2: Method used to collect the dataset automatically.
ization was tackled as a classification task by divid-
ing an environment of 144 m
2
using grids of 1 m
2
,
1.5 m
2
and 2 m
2
. Other works (Chen et al., 2015;
Deng et al., 2015; Lipka et al., 2019; R
¨
obesaat et al.,
2017; Paul and Wan, 2009) used the Kalman filter to
denoise the observed RSSI values. In (Subedi et al.,
2016), an algorithm called Weighted Centroid Local-
ization (WCL) was proposed. The algorithm takes as
input a mobile average of ten RSSI samples and ap-
plies Kalman filter. The importance of each beacon
is hence weighed based on its distance from the RSSI
point, in order to calculate the coordinates of the de-
vice to be located. Due to the temporal nature of the
observed radio signals, recurrent units are suitable to
tackle the localization task from the RSSI values. The
authors of (Hoang et al., 2019) estimated the target
trajectory using a large amount of RSSI values col-
lected with mobile devices. The authors of (Xu et al.,
2019) used a LSTM to track a moving target through
decentralized sorting of RSSI values and using a GPU
to increase computation speed. The authors of (Ishi-
hara et al., 2017) propose to use both RSSI signals and
image content to improve smartphone localization.
Differently from the aforementioned works, we
propose a pipeline to collect a large amount of RSSI
values leveraging a mobile robot and structure from
motion techniques. We hence propose an approach
based on LSTMs which shows how this large amount
of labeled data can be effectively used to tackle the
localization problem.
2.2 Image-based Localization Datasets
Our research is also related to previous works focus-
ing on the creation of datasets for image-based local-
ization. In (Kendall et al., 2015) the Cambridge land-
mark dataset was introduced. The dataset includes 5
different outdoor scenes and contains approximately
12,000 images tagged with 6 degrees of freedom
(6DOF) camera poses. Rome16k and Dubrovnik6k
were proposed in (Li et al., 2009) with 16,179 and
6,844 outdoor images downloaded from Flickr. The
pose information in both datasets was obtained using
Structure From Motion (Wu, 2013). In some cases,
especially for indoor environments, the use of dedi-
cated hardware is preferred over SfM. For example,
the “7 scenes” dataset (Shotton et al., 2013), which
contains images from 7 indoor environments such as
“Office” and “Stairs” includes a total of 43,000 la-
beled frames, was captured using a handheld Kinect
RGBD sensor. An indoor dataset covering an entire
floor of a building with a total area of 5,000 m
2
is
described in (Walch et al., 2017). The dataset was ac-
quired using a mobile system equipped with six cam-
eras and three laser rangefinders and contains 1,095
high resolution images. The authors of (Sun et al.,
2017) collected a dataset for indoor localization in
a shopping mall covering an area of 5,575 m
2
using
DSLR cameras for the train set, while the test set con-
sists of 2,000 photos collected with mobile phones by
different users. To estimate camera poses, the authors
used a 3D-2D fit algorithm based on a 3D model ob-
tained with a high-precision LiDAR scanner.
Similarly to the aforementioned works, we col-
lect a dataset of images and use structure from mo-
tion techniques to attach camera poses to the images.
However, differently from those, we aim to create
a high-quality dataset of RSSI values associated to
ground truth positions. Hence, the collected images
are used mainly as a means to automatically obtain a
ground truth signal in our work.
3 PROPOSED DATA
ACQUISITION PIPELINE AND
COLLECTED DATASET
The proposed automatic data acquisition and labeling
pipeline is depicted in Figure 2. The pipeline goes
through the following steps:
1. Visual RSSI Fingerprinting, in which we collect
SIGMAP 2022 - 19th International Conference on Signal Processing and Multimedia Applications
72

Figure 3: Environment used for collecting the data. The
positions of the antennas placed in the environment are de-
noted by the “A” letters.
different RSSI values and associate them to visual
observations in the form of RGB images;
2. Structure From Motion, which is used to associate
3D poses to each image, and hence to each RSSI
value;
3. Projection of the 3D poses to the 2D floor-plan
and exportation of the associated RSSI values use-
ful for training machine learning algorithms for
localization via radio signals.
The rest of this section details how we implemented
this pipeline in an indoor environment in order to gen-
erate a dataset suitable to study the localization prob-
lem.
RGB images with a resolution of 1280 x 720
and RSSI signals were collected in the environment
shown in figure 3. We have installed 5 antennas in or-
der to completely cover the environment. The chosen
space has a maximum length of 17.75m and a max-
imum width of 12.65m. The total area is approxi-
mately 160 m
2
. The environment is close to a power
plant, which introduces RSSI noise.
In order to have a high resolution map of the en-
vironment, we performed a dense sampling of RSSI
values using a Sanbot-Elf mobile robot
2
to which we
attached a RealSense D435 camera
3
and three Blue-
tooth Low Energy (BLE) beacons. We use three bea-
cons to have three different frequencies, obtaining a
more realistic setting and adding variability to the
dataset. The RealSense camera allows to capture and
stream video. Furthermore its good autofocus speed
enables capturing images without blur which are to
be preferred for good SfM results. BLE beacons are
a suitable class of devices to transmit RSSI values
because of the low energy consumption profile and
2
http://en.sanbot.com/product/sanbot-elf/design
3
https://www.intel.com/content/www/us/en/architecture-
and-technology/realsense-overview.html
Table 1: Dataset statistics.
Statistic #
Total images/payloads 64478
Total images used for SfM 58872
Total points to localize 57158
Total RSSI values in Train-set 36295
Total RSSI values in Validation-set 9665
Total RSSi values in Test-set 18485
Total seconds of recordings 12889
Total missing values covered with linear interpolation 2622
good working distances. The camera is connected to
a Raspberry PI 4
4
device attached to a powerbank.
The setup of the robot is shown in Figure 4.
Using the autonomous navigation capabilities
based on the on-board sensors of the robot, we let it
move randomly in all directions to cover all possible
positions in the environment. Apart from the three
beacons placed on the robot, the environment con-
tains seven additional beacons, which contribute to
increase the RSSI noise, and hence to reproduce a re-
alistic setup. At every second, the described platform
was used to collect images and receive signals from
the five antennas placed in the environment through
the three beacons.
We have collected the dataset during seven record-
ing sessions, each one lasting thirty minutes in or-
der to increase the variability of external and inter-
nal factors, such as RSSI noise by changing the time
of acquisition. Following this procedure, we gathered
64.478 images, each associated to the related RSSI
payloads.
To assign a set of coordinates to each image and
hence to the corresponding RSSI data, we built a
3D model using COLMAP (Sch
¨
onberger and Frahm,
2016), a widely used Structure From Motion tool.
To recover the metrical scale of the environment, we
aligned the reconstructed model through the Manhat-
tan world alignment procedure included in COLMAP
using a small set of images captured at known posi-
tions. For each image, collected using the RealSense
camera, registered to the model, we exported 3D spa-
tial labels and projected them to the 2D plan corre-
sponding to the floor, thus obtaining two degrees of
freedom (2DoF) camera poses.
All the statistics of the created dataset are shown
in Table 1. The dataset was split into train, testing
and validation sets using 70%, 20% and 10% of the
data respectively, as shown in Table 1. Specifically,
sessions 1-4 have been used for training, session 5 for
validation and sessions 6-7 for testing.
4
https://www.raspberrypi.org/
Visual RSSI Fingerprinting for Radio-based Indoor Localization
73
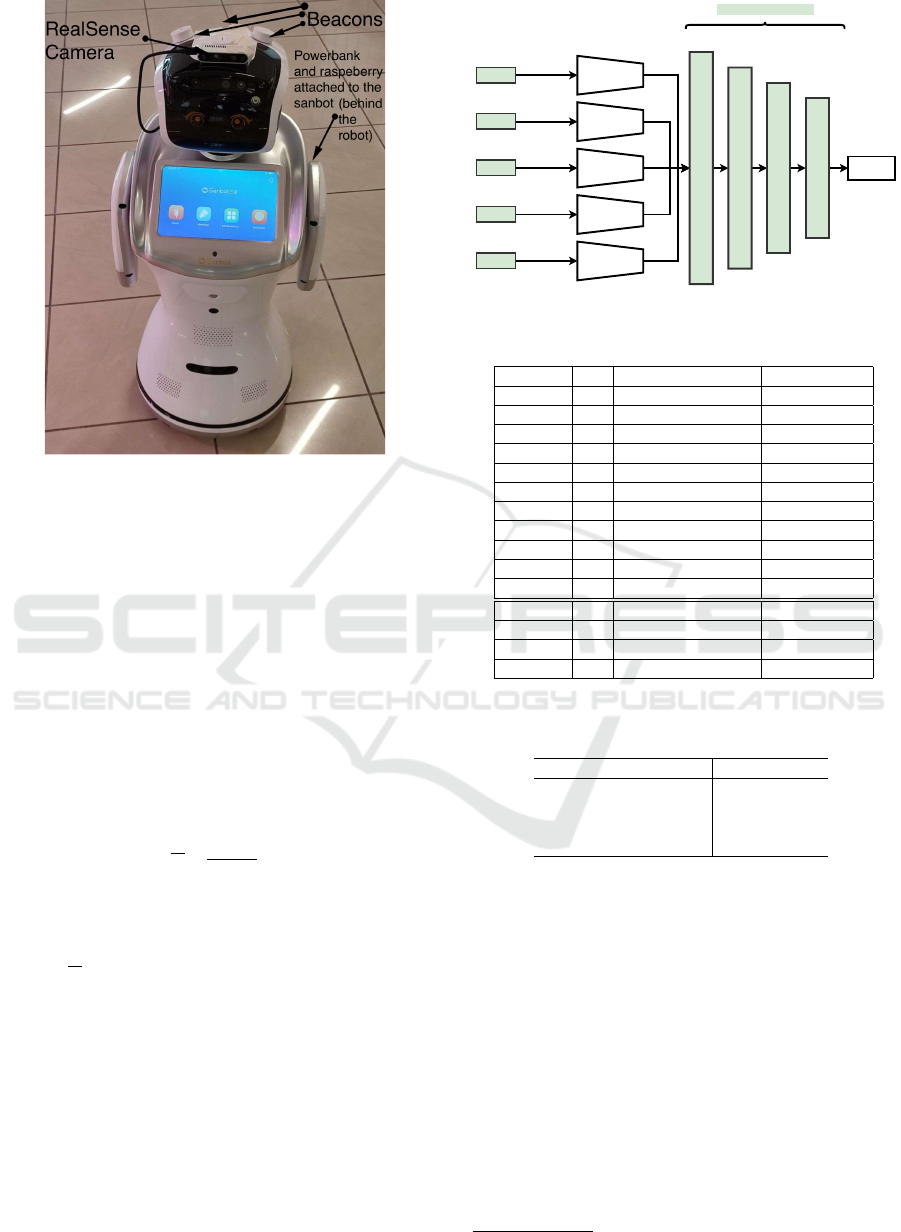
Figure 4: Proposed robotic platform based on Sanbot robot
with three beacons. A Realsense camera, a Raspberry PI,
and a powerbank.
4 METHOD
We process RSSI data using a sliding window of one
second: at every second we collect the RSSIs infor-
mation of the five antennas dislocated in the environ-
ment. In several cases, RSSI values of a given antenna
were missing in the considered temporal window. We
filled these missing values using linear interpolation.
To mitigate noise and signal instability, we normal-
ized data to have 0 mean and standard deviation equal
to 1 using the formula:
x
i
=
x
i
− µ
i
σ
i
(1)
where x
i
is the i-th feature (i.e., the value of the i-th
antenna), µ
i
and σ
i
are the mean and standard devi-
ation values of the features computed on the training
set, and x
i
is the i-th normalized feature.
We hence propose a neural network architecture to
exploit the temporal nature of the data and the differ-
ent contribution of each antenna, which is illustrated
in Figure 5. Specifically, we design an architecture
composed by 5 LSTMs, one for each antenna, to pro-
cess in parallel features related to the different anten-
nas. At each training step, every LSTM takes as input
a sequence containing the RSSI signals of the last 20
seconds measured with respect to each correspond-
ing antenna. The 128-dimensional hidden vectors of
the different LSTMs are then concatenated in a sin-
gle vector and fed to a Multi Layer Perceptron (MLP)
Antenna 1
Antenna 2
Antenna 3
Antenna 4
Antenna 5
LSTM
LSTM
LSTM
LSTM
LSTM
Multi Layer Perceptron
X,Y
128
128
128
128
128
Linear Layer
Linear Layer
Linear Layer
Linear Layer
Figure 5: Schema of the proposed model.
Table 2: Comparison of our method against baselines.
Method FC Temporal Window Mean error
KNN - / 1.99 m
MLP 3 3s 1.80 ± 1.25 m
RNN 2 20s 1.32 ± 0.91 m
GRU 1 15s 1.35 ± 0.94 m
GRU 2 15s 1.31 ± 0.93 m
GRU 3 15s 1.28 ± 0.95 m
LSTM 1 20s 1.64 ± 1.07 m
LSTM 2 20s 1.29 ± 0.88 m
LSTM 3 20s 1.25 ± 0.90 m
BiGRU 3 20s 1.84 ± 1.02 m
BiLSTM 3 20s 1.60 ± 0.98 m
OURs 1 20s 2.18 ± 1.45 m
OURs 2 20s 1.44 ± 0.99 m
OURs 3 20s 1.22 ± 0.93 m
OURs 4 20s 1.17± 0.90 m
Table 3: Average error of the proposed method for varying
training set size.
Portion of training set Error
25% 2.01 ± 1.33 m
50%
1.46 ± 1.03 m
75% 1.30 ± 0.92 m
100% 1.17 ± 0.90 m
made of 4 fully connected layers to regress the final
2D pose.
To train the model, we used the smoothed L1 loss
function (Girshick, 2015), which is closely related to
Huber-Loss. We choose this loss because it is less
sensitive to outliers compared to Mean Squared Error
in a regression task. We used a learning rate of 10
−4
,
which is halved every 100 epochs. We used the Adam
optimizer (Kingma and Ba, 2014) to train the model
because it can handle sparse gradients on noisy prob-
lem. All experiments have been performed using the
PyTorch
5
framework.
5
https://pytorch.org/
SIGMAP 2022 - 19th International Conference on Signal Processing and Multimedia Applications
74

5 EXPERIMENTS
We compare our method against different baselines
based on KNN, MLP and general RNN approaches
which are summarized in the following.
• KNN: location is determined form the input vec-
tor of 5 RSSI values by looking at a database of
offline observations paired with ground truth loca-
tions. We found that K = 10 gave the best results,
hence we use this value in our experiments;
• MLP: RSSI values sampled in the last 3 seconds
are concatenated in a 15-dimensional vector. Lo-
cation is directly regressed from the input vector
using a Multi-Layer Perceptron with three hidden
layer of dimensionality 32, 64, 128;
• RNN: Due to the sequential nature of the input
data, we investigate the use of Recurrent Neural
Networks (RNN) (Rumelhart et al., 1985; Jordan,
1997). In this case, the input is a sequence of 20
vectors of 5 RSSI values, sampled in the 20 sec-
onds preceding the observation. The hidden size
of the RNN cell is 128. The output of the RNN is
hence passed through 2 fully connected layers of
dimensionality 64;
• GRU: We also assess the performance of a Gated
Recurrent Unit (GRU) as a recurrent neural net-
work. In this case, we use a hidden size of 128
consider a sequence of 15 5-dimensional vectors
and experiment with 1, 2 and 3 fully connected
layers with hidden size of sizes ranging from 32
to 128;
• LSTM: Similar to the GRU experiment, but
Long-Short Term Memory (LSTM) (Hochreiter
and Schmidhuber, 1997) cells are used instead.
An input sequence of 20 seconds is consider and
similar hidden size dimensions apply;
• BiGRU, BiLSTM: Same as before, but with bidi-
rectional recurrent units used instead;
Table 2 reports the results of our experiments. For
each method we report the mean error with the related
standard deviation in meters.
The simple KNN baseline reaches an average er-
ror of 1.99 meters. This large error is probably due
to the inability of the algorithm to model the temporal
nature of observations. The MLP baseline achieves a
slightly better result than KNN, with an average error
of 1.80 meters. Note that while the MLP can model
more complex input-output relationships than KNN,
it can not truly leverage the temporality of observa-
tions. The models based on recurrent neural networks
obtain better results compared to KNN and MLP. We
believe that such increase in performance depends di-
rectly from the ability to model the sequential na-
ture of the observations. A general trend (which can
be seen in results Table 2) is that models with in-
creased capacity (more FC layers) tend to perform
better (e.g., the GRU with 3 FC layers obtains an aver-
age error of 1.28± 0.95 meters vs the GRU with 1 FC
layer which obtains an average error of 1.35 ± 0.94
meters). LSTMs, being more flexible, perform bet-
ter than GRUs and vanilla RNNs. Indeed, the best
results are obtained using a LSTM with a temporal
window of 20 seconds as input, reaching an error of
1.25 ± 0.90 meters. Using bidirectional LSTMs and
GRUs does not bring significant improvements to per-
formance. Our method was developed starting from
this result, with a set of five LSTM to exploit the con-
tributions of each antenna. The best overall result
is achieved by our method with an average error of
1.17± 0.90 meters obtained with four fully connected
layers, and 20 seconds temporal window as input. As
shown in the REC curve reported in Figure 6, the pro-
posed method achieves an error under 1m of 54.55%
of times, and under 1.5m in 73.9% of the cases.
The importance of having a large quantity of data,
which is one of the contributions of our pipeline, is
highlighted in Table 3, which shows performance of
the best model when different portions of our dataset
are used for training. As can be observed, using 100%
of the data is fundamental to achieve a more accurate
localization.
6 CONCLUSION
In this work we have considered the problem of in-
door localization of BLE beacons using RSSI-Data.
We propose to overcome the expensive procedure of
manual fingerprinting to collect data using an au-
tonomous robot and structure from motion to create a
3D model of the environment for gathering the 2DoF
poses. Following this procedure, we collected over
64000 images from almost 4 hours of video. To test
the goodness of the data, we performed several ex-
periments using various machine learning approaches
and we presented a method which exploits both the
temporal nature of the data as the quantitative nature
of the features. We believe that the pipeline described
and the released dataset can help the research in this
topic.
Visual RSSI Fingerprinting for Radio-based Indoor Localization
75
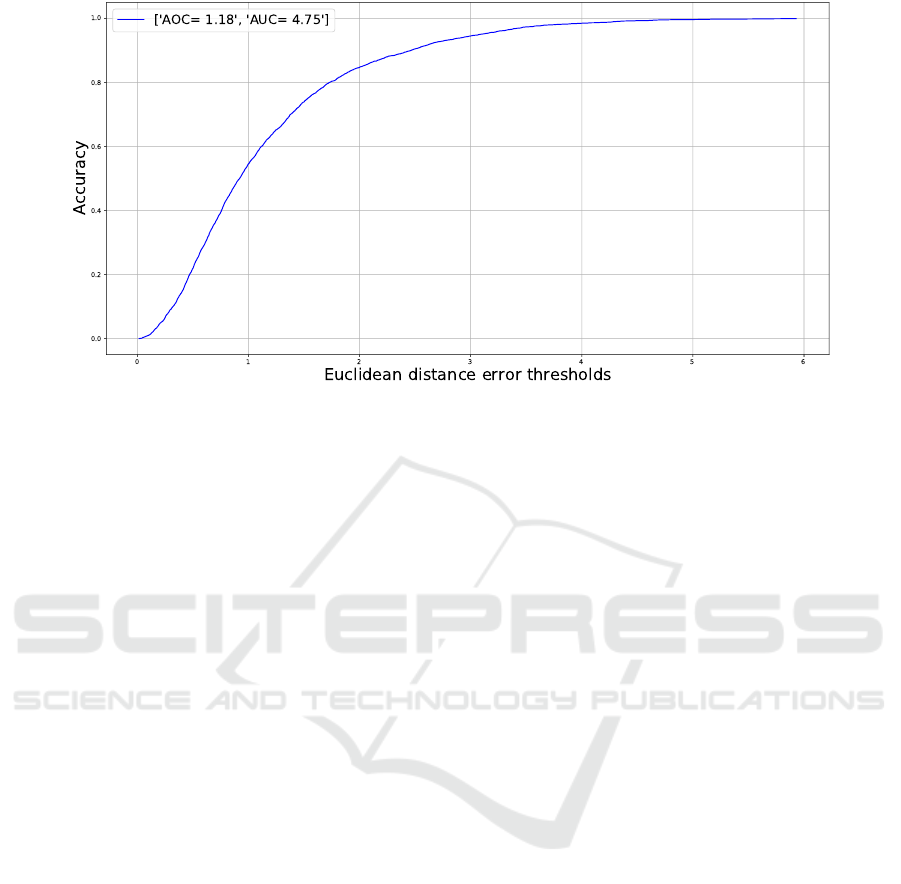
Figure 6: REC curve of the proposed method computed based on the Euclidean distance.
ACKNOWLEDGEMENT
This research is supported by the project MEGABIT
- PIAno di inCEntivi per la RIcerca di Ateneo
2020/2022 (PIACERI) – linea di intervento 2, DMI
- University of Catania.
REFERENCES
Battiato, S., Farinella, G. M., Gallo, G., and Rav
`
ı, D.
(2009). Spatial hierarchy of textons distributions for
scene classification. In International Conference on
Multimedia Modeling, pages 333–343. Springer.
Battiti, R., Villani, A., and Le Nhat, T. (2002). Neural net-
work models for intelligent networks: deriving the lo-
cation from signal patterns. Proceedings of AINS.
Brunato, M. and Battiti, R. (2005). Statistical learning the-
ory for location fingerprinting in wireless lans. Com-
puter Networks, 47(6):825–845.
Chen, Z., Zou, H., Jiang, H., Zhu, Q., Soh, Y. C., and Xie, L.
(2015). Fusion of wifi, smartphone sensors and land-
marks using the kalman filter for indoor localization.
Sensors, 15(1):715–732.
Dai, H., Ying, W.-h., and Xu, J. (2016). Multi-layer neu-
ral network for received signal strength-based indoor
localisation. IET Communications, 10(6):717–723.
Deng, Z.-A., Hu, Y., Yu, J., and Na, Z. (2015). Extended
kalman filter for real time indoor localization by fus-
ing wifi and smartphone inertial sensors. Microma-
chines, 6(4):523–543.
Furnari, A., Battiato, S., and Farinella, G. M. (2018). Lever-
aging uncertainty to rethink loss functions and eval-
uation measures for egocentric action anticipation.
In European Conference on Computer Vision Work-
shops, pages 389–405. Springer.
Furnari, A., Farinella, G. M., and Battiato, S. (2016). Tem-
poral segmentation of egocentric videos to highlight
personal locations of interest. In International Work-
shop on Egocentric Perception, Interaction and Com-
puting (EPIC) in conjunction with ECCV, The Nether-
lands, Amsterdam, October 9, volume 9913 of Lecture
Notes in Computer Science, pages 474–489. Springer
Lecture Notes in Computer Science.
Girshick, R. (2015). Fast r-cnn. In Proceedings of the IEEE
international conference on computer vision, pages
1440–1448.
Gupta, S., Davidson, J., Levine, S., Sukthankar, R., and Ma-
lik, J. (2017). Cognitive mapping and planning for
visual navigation. In IEEE Conference on Computer
Vision and Pattern Recognition, pages 2616–2625.
H
¨
ane, C., Heng, L., Lee, G. H., Fraundorfer, F., Furgale, P.,
Sattler, T., and Pollefeys, M. (2017). 3d visual per-
ception for self-driving cars using a multi-camera sys-
tem: Calibration, mapping, localization, and obstacle
detection. Image and Vision Computing, 68:14–27.
Hoang, M. T., Yuen, B., Dong, X., Lu, T., Westendorp,
R., and Reddy, K. (2019). Recurrent neural networks
for accurate rssi indoor localization. IEEE Internet of
Things Journal, 6(6):10639–10651.
Hochreiter, S. and Schmidhuber, J. (1997). Long short-term
memory. Neural computation, 9(8):1735–1780.
Ishihara, T., Vongkulbhisal, J., Kitani, K. M., and Asakawa,
C. (2017). Beacon-guided structure from motion for
smartphone-based navigation. In 2017 IEEE Win-
ter Conference on Applications of Computer Vision
(WACV), pages 769–777. IEEE.
Jordan, M. I. (1997). Serial order: A parallel distributed
processing approach. In Advances in psychology, vol-
ume 121, pages 471–495. Elsevier.
Kamali, A. (2019). Smart warehouse vs. traditional
warehouse-review. Automation and Autonomous Sys-
tems, 11(1):9–16.
SIGMAP 2022 - 19th International Conference on Signal Processing and Multimedia Applications
76

Kanaris, L., Kokkinis, A., Liotta, A., and Stavrou, S.
(2017). Fusing bluetooth beacon data with wi-fi ra-
diomaps for improved indoor localization. Sensors,
17(4):812.
Kendall, A., Grimes, M., and Cipolla, R. (2015). Posenet: A
convolutional network for real-time 6-dof camera re-
localization. In Proceedings of the IEEE international
conference on computer vision, pages 2938–2946.
Kingma, D. P. and Ba, J. (2014). Adam: A
method for stochastic optimization. arXiv preprint
arXiv:1412.6980.
Li, Y., Crandall, D. J., and Huttenlocher, D. P. (2009). Land-
mark classification in large-scale image collections. In
2009 IEEE 12th International Conference on Com-
puter Vision, pages 1957–1964.
Lipka, M., Sippel, E., and Vossiek, M. (2019). An extended
kalman filter for direct, real-time, phase-based high
precision indoor localization. IEEE Access, 7:25288–
25297.
Obreja, S. G., Aboul-Hassna, T., Mocanu, F. D., and Vulpe,
A. (2018). Indoor localization using radio beacon
technology. In 2018 International Symposium on
Electronics and Telecommunications (ISETC), pages
1–4. IEEE.
Paul, A. S. and Wan, E. A. (2009). Rssi-based indoor
localization and tracking using sigma-point kalman
smoothers. IEEE Journal of selected topics in signal
processing, 3(5):860–873.
Ragusa, F., Furnari, A., Battiato, S., Signorello, G., and
Farinella, G. M. (2020). EGO-CH: Dataset and fun-
damental tasks for visitors behavioral understanding
using egocentric vision. Pattern Recognition Letters,
131:150–157.
R
¨
obesaat, J., Zhang, P., Abdelaal, M., and Theel, O.
(2017). An improved ble indoor localization with
kalman-based fusion: An experimental study. Sen-
sors, 17(5):951.
Rumelhart, D. E., Hinton, G. E., and Williams, R. J. (1985).
Learning internal representations by error propaga-
tion. Technical report, California Univ San Diego La
Jolla Inst for Cognitive Science.
Sch
¨
onberger, J. L. and Frahm, J.-M. (2016). Structure-
from-motion revisited. In Conference on Computer
Vision and Pattern Recognition (CVPR).
Shotton, J., Glocker, B., Zach, C., Izadi, S., Criminisi, A.,
and Fitzgibbon, A. (2013). Scene coordinate regres-
sion forests for camera relocalization in rgb-d images.
In Proceedings of the IEEE Conference on Computer
Vision and Pattern Recognition, pages 2930–2937.
Subedi, S., Kwon, G.-R., Shin, S., Hwang, S.-s., and Pyun,
J.-Y. (2016). Beacon based indoor positioning sys-
tem using weighted centroid localization approach.
In 2016 Eighth International Conference on Ubiq-
uitous and Future Networks (ICUFN), pages 1016–
1019. IEEE.
Sun, X., Xie, Y., Luo, P., and Wang, L. (2017). A dataset
for benchmarking image-based localization. In Pro-
ceedings of the IEEE Conference on Computer Vision
and Pattern Recognition, pages 7436–7444.
Walch, F., Hazirbas, C., Leal-Taixe, L., Sattler, T., Hilsen-
beck, S., and Cremers, D. (2017). Image-based local-
ization using lstms for structured feature correlation.
In Proceedings of the IEEE International Conference
on Computer Vision, pages 627–637.
Wu, C. (2013). Towards linear-time incremental structure
from motion. In 2013 International Conference on
3D Vision-3DV 2013, pages 127–134. IEEE.
Xiao, J., Zhou, Z., Yi, Y., and Ni, L. M. (2016). A survey on
wireless indoor localization from the device perspec-
tive. ACM Comput. Surv., 49(2).
Xu, B., Zhu, X., and Zhu, H. (2019). An efficient in-
door localization method based on the long short-
term memory recurrent neuron network. IEEE Access,
7:123912–123921.
Zafari, F., Gkelias, A., and Leung, K. K. (2019). A survey
of indoor localization systems and technologies. IEEE
Communications Surveys & Tutorials, 21(3):2568–
2599.
Visual RSSI Fingerprinting for Radio-based Indoor Localization
77
