
Automated Neoclassical Vertical Canon Validation in Human Faces with
Machine Learning
Ashwinee Mehta
1 a
, Maged Abdelaal
2 b
, Moamen Sheba
2 c
and Nic Herndon
1 d
1
Department of Computer Science, East Carolina University, Greenville, U.S.A.
2
School of Dental Medicine, East Carolina University, Greenville, U.S.A.
Keywords:
Vertical Canon, One Thirds, Facial, Dental Reconstruction, Anthropometric Landmarks, Machine Learning.
Abstract:
The proportions defined by the neoclassical canons for face evaluation were developed by artists and
anatomists in the 17
th
and 18
th
centuries. These proportions are used as a reference for planning facial or
dental reconstruction treatments. However, the assumption that the face is divided vertically into three equal
thirds, which was adopted a long time ago, has not been verified yet. We used photos freely available on-
line, annotated them with anthropometric landmarks using machine learning, and verified this hypothesis.
Our results indicate that the vertical dimensions of the face are not always divided equally into thirds. Thus,
this vertical canon should be used with caution in cosmetic, plastic, or dental surgeries, and reconstruction
procedures.
1 INTRODUCTION
The face is one of the most important factors affect-
ing the physical appearance of a person. Different
facial proportions can be used for measuring the fa-
cial attractiveness, for recommending hairstyles, fash-
ion jewelry, eyeglasses, etc. The measurement of fa-
cial attractiveness is also applicable in cosmetics, or-
thodontics and plastic surgery. Dental practitioners
take into consideration the different facial proportions
in order to create a denture of suitable shape, size, and
position.
The neoclassical canons used for proportional
evaluation of the face were developed in the 17
th
and
18
th
centuries. These canons were based on the as-
sumption that certain fixed ratios existed between dif-
ferent parts of a human face. They are still used to
define the proportions between various areas of the
head and face. One of these eight defined neoclassi-
cal canons is the vertical canon, which states that the
face is divided into three equal sections. The first sec-
tion is from the top of the forehead (Trichion), to the
bridge of the nose (Glabella), as shown in Figure 1,
the second section is from the bridge of the nose to
a
https://orcid.org/0000-0002-7167-2563
b
https://orcid.org/0000-0002-7414-423X
c
https://orcid.org/0000-0003-1188-2080
d
https://orcid.org/0000-0001-9712-148X
the base of the nose (Subnasale), and the third sec-
tion is from base of the nose to the chin (Menton).
Trichion, Glabella, Subnasale and Menton are the an-
thropometric landmarks that are identified before tak-
ing the measurements of the facial thirds. The vertical
canon is widely used in facial surgeries and dental re-
construction procedures.
Farkas et al. (1985) first investigated the appli-
cability of the neoclassical facial canons in young
North American Caucasian adults. Following this, the
canons were also validated on several other popula-
tion groups including Nigerians, African-Americans,
Turkish, Vietnamese, Thai, and Chinese individuals.
These studies were performed by adopting the stan-
dard anthropometric methods and the measurements
were obtained using anthropometric tools like milli-
metric compass, sliding calipers, etc. Some studies
have used images pre-annotated with the anthropo-
metric landmarks.
Missing teeth with age causes a person’s face to
collapse. While fixing the patient’s teeth, it is also im-
portant to consider restoring the patient’s facial shape.
With a collapsed face, only the bottom one third of
the face, i.e., from Subnasale to Menton is affected
and needs to be restored. This facial restoration also
needs some reference for comparing the facial shape
proportions to convert the collapsed face into normal
facial shape. Inclusion and evaluation of facial aes-
thetics is important while planning for facial or den-
Mehta, A., Abdelaal, M., Sheba, M. and Herndon, N.
Automated Neoclassical Vertical Canon Validation in Human Faces with Machine Learning.
DOI: 10.5220/0011300200003269
In Proceedings of the 11th International Conference on Data Science, Technology and Applications (DATA 2022), pages 461-467
ISBN: 978-989-758-583-8; ISSN: 2184-285X
Copyright
c
2022 by SCITEPRESS – Science and Technology Publications, Lda. All rights reserved
461
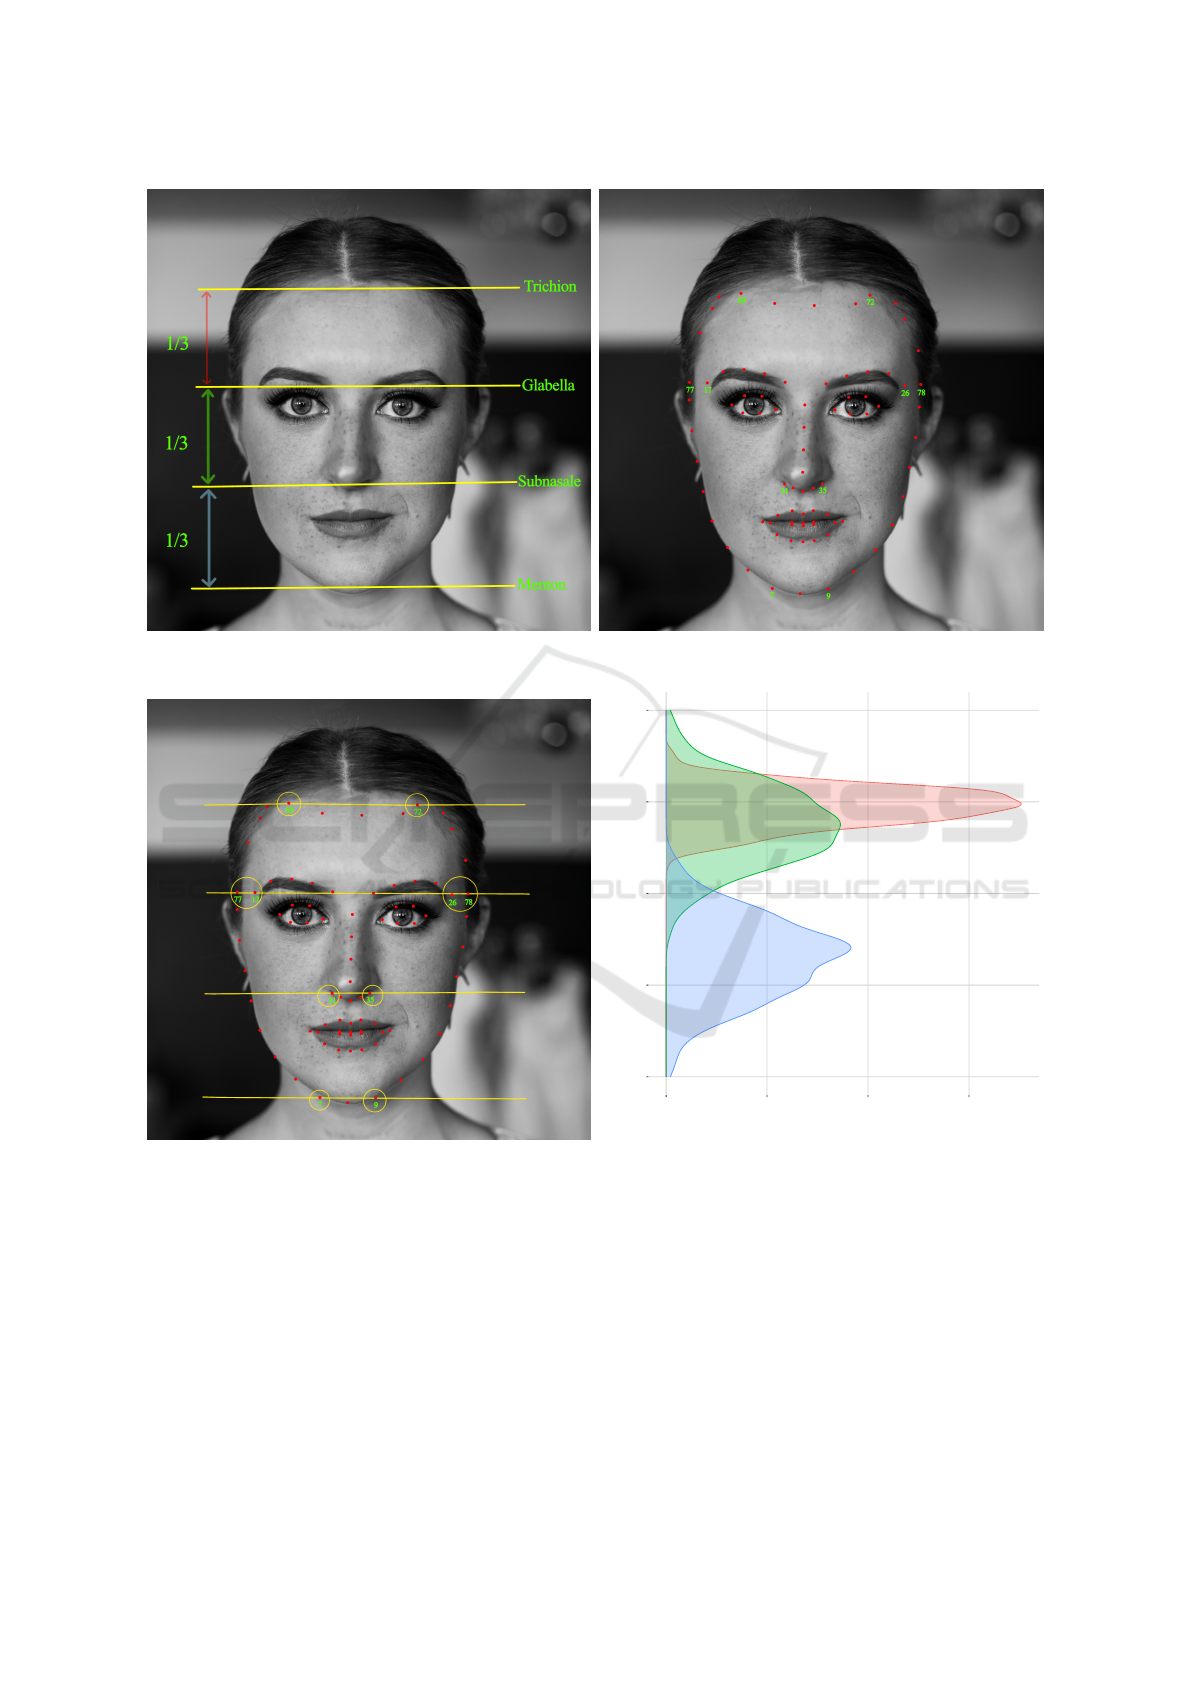
(a) The neoclassical vertical canon states that the face is di-
vided into three equal thirds.
(b) To test this hypothesis we used the Dlib-81 library to auto-
matically place facial landmarks on an image.
(c) Out of the landmarks generated by the Dlib-81 library we
used the ten circled landmarks to place the four lines.
Trichion to Glabella
Glabella to Subnasale
Subnasale to Menton
0.25
0.30
0.35
0.40
0.45
0 10 20 30
Frequency
Normalized Distances
(d) The density distributions of the three distances using anno-
tated images from LFW, MUCT, and CUHK datasets seem to
invalidate this hypothesis.
Figure 1: Facial landmarks are used to automatically place the lines for Trichion, Glabella, Subnasale, and Menton. These
lines were used in one of the neoclassical canons, the vertical canon, to surmise that each face is divided into three equal
sections. However, evidence shows that these distances are not equal.
tal reconstruction treatment. Many clinical textbooks
and journal articles recommend to use these neoclas-
sical canons for evaluating the aesthetics. However,
before blindly applying these recommended neoclas-
sical formulae, it is important to validate them. With
the advancements in technology, it is no longer re-
quired to use the traditional anthropometric tools to
take measurements from the human face. We can
use machine learning to train a model to automati-
cally identify the different anthropometric landmarks
of the human face and thus avoid the need for direct
contact with patients. The objective of this study is to
DATA 2022 - 11th International Conference on Data Science, Technology and Applications
462

verify the vertical canon by using machine learning to
eliminate the need to take the measurements manually
using different anthropometric tools.
All the canon validation methods that have been
proposed have used different physical instruments (Le
et al., 2002; Bozkir et al., 2004; Al-Sebaei, 2015;
Eboh, 2019) and software applications for taking
measurements of the face (Burusapat and Lekdaeng,
2019). Some of the proposed techniques have used a
ready-made database that had images with the anthro-
pometric landmarks annotated (Schmid et al., 2008;
Pavlic et al., 2017). However, none of the techniques
have used automated tools for getting the measure-
ments and validating this canon. These techniques are
discussed in Section 4.
Our proposed method used large volume of pho-
tos available online, annotated them with automated
tools, and verified this hypothesis. We have per-
formed the automatic validation of the vertical canon
by annotating the images from three freely available
image databases using machine learning. By using
the proposed method, one can validate the vertical
canon automatically without the need to use tradi-
tional anthropometric tools or instruments directly on
the patient.
2 MATERIALS AND METHODS
We tested the applicability of the vertical neoclassi-
cal canon on the facial images collected from three
freely available datasets: Labeled Faces in the Wild
(LFW) face database (Huang et al., 2007), the Milbor-
row / University of Cape Town (MUCT) face database
(Milborrow et al., 2010), and the Chinese Univer-
sity of Hong Kong student database (Wang and Tang,
2009). The LFW is a database of face photographs
designed for studying the problem of unconstrained
face recognition. The data set contains 13,233 facial
images of 5749 individuals collected from the web.
All the images in the LFW database have a resolution
of 250 × 250 pixels. The MUCT face database con-
sists of 3,755 facial images of 276 individuals. The
individual were sampled from students, parents at-
tending graduation ceremonies, high school teachers
attending a conference, and employees of the univer-
sity at the University Of Cape Town campus in De-
cember 2008. This diverse population includes a wide
range of subjects, with approximately equal numbers
of males and females, and a cross section of ages and
races. All the images in the MUCT database have a
resolution of 480 × 640 pixels. The CUHK database is
for research on face sketch synthesis and face sketch
recognition, and consists of 188 facial images of 188
individuals. All the images in the CUHK database
have a resolution of 1024 × 768 pixels. All the fa-
cial images were not labeled with any anthropometric
landmarks.
Our proposed workflow had the following steps:
1. Annotation: The first step was to annotate
these images with facial anthropometric landmarks.
We initially evaluated the Dlib’s 68-point facial land-
mark detector (King, 2009), the most popular facial
landmark detector. It can find 68 different facial land-
mark points including chin and jaw line, eyebrows,
nose, eyes and lips. In our preliminary work we de-
termined that this library does not provide facial land-
marks for the forehead. Therefore, we used an ex-
tended version of this library, 81 Facial Landmarks
Shape Predictor, which provides 13 additional land-
marks that delineate the forehead. Not all the land-
marks generated are needed to get the measurements
of the thirds of the face. Out of all the 81 landmarks,
we used only the following landmarks, as shown in
Figure 1c:
• 69 and 72, for the left- and right-forehead, respec-
tively. These landmarks were used for the place-
ment of the Trichion line.
• 77, 17, 26, and 78, for the left-temple, left-
exterior eyebrow, right-exterior eyebrow, and
right-temple, respectively. These landmarks were
used for the placement of the Glabella line. This
is the only line for which we used four landmarks,
since none of the 81 landmarks are placed at the
position for the bridge of the nose. Therefore, we
used the mid-vertical distance between landmarks
77 and 17, along with the mid-vertical distance
between landmarks 26 and 78, as the anchors for
the Glabella line.
• 31 and 35, for the left- and right-base of the nose,
respectively. These landmarks were used for the
Subnasale line.
• 7 and 9, for the left- and right-side of the chin,
respectively. These landmarks were used for the
Menton line.
2. Assess the Annotation: The second step was
to visually inspect the placement of the four lines
mentioned above, on all the images from the three
datasets. During this manual inspection we noticed
that the predictor placed the landmarks in the cor-
rect positions in images that had eyeglasses, beard,
bald heads, hats, as well as for people of different age
groups and races, and to different background colors
and patterns. However, some of the lines were not
correctly placed for images that did not have a front
profile view. For some of these images, the 81 Facial
Landmarks Shape Predictor misplaced some of the
Automated Neoclassical Vertical Canon Validation in Human Faces with Machine Learning
463

landmarks, which led to the incorrect placement of
the Trichion, Glabella, Subnasale and Menton lines,
as shown in Figure 2.
3. Select Images: Therefore, to get a correct and
unbiased measurement of the thirds of the face, in the
third step we planned to select about 500 images, that
had correctly positioned landmarks. We identified
464 images from the LFW dataset, 86 images from
the MUCT dataset, and 29 images from the CUHK
dataset (for a total of 579 images), that had the cor-
rect automatic placement of the four lines.
4. Calculate Distances: We used these images, in
the fourth step to calculate the three facial distances:
between Trichion and Glabella, between Glabella and
Subnasale, and between Subnasale and Menton. The
initial distance measurements were taken in number
of vertical pixels between each two lines. Since we
used images from all the three image databases, we
had to take into consideration the fact that the images
were provided with different resolutions. Therefore,
we performed normalization of all the three distance
values using Equation 1.
d
0
i
=
d
i
3
∑
j=1
d
j
(1)
where d
0
i
is the normalized distance of d
i
, and d
j
is
one of the three distances.
5. Plot Density Distributions of These Dis-
tances: In the final step we used these normalized dis-
tances to generate density plots for the three distances.
These are shown in Figure 1d for the 579 combined
images, and in Figures 3b, 3d, and 3f, for the 464 im-
ages from the LFW database, the 86 images from the
MUCT database, and the 29 images from the CUHK
database, respectively.
3 RESULTS AND DISCUSSION
Figure 1d shows the distribution of the three distances
across the selected images from the three databases.
These density plots show that the forehead, the dis-
tance between Trichion and Glabella, varies between
about a fourth and a third of the face, with the mean
around 30%. The nose, between Glabella and Sub-
nasale, has a wider distribution, with length values be-
tween about 25% and 38% of the vertical length of the
face, and a mean closer to one third. The mouth, be-
tween Subnasale and Menton, seems to be the longest
of the three distances, with lengths between about
32% and 45% of the vertical length of the face, and
a mean of about 38%.
One of the confounding factors of these varia-
tions is the resolution of the images in our analysis.
For images with lower resolution the misplacement
of the landmarks has a bigger influence of the dis-
tances, since 1 or 2 extra pixels could increase or
decrease a distance by about 4%. For images with
higher resolution such a misplacement would have a
lesser impact on the normalized distances. To eval-
uate this impact we plotted the density distributions
for each dataset separately, as shown in Figure 3.
While there doesn’t seem to be significant differences
in the lengths of forehead and nose, across the three
datasets, the length of the mouth, the distance be-
tween Subnasale and Menton, seems to have more
variance for images with lower resolution, than for
images with higher resolution.
One thing that is common across these density
plots is the fact that these distances are not equal,
with about 1/3 for forehead, 1/3 for nose, and 1/3 for
mouth, as stated in the neoclassical canon, but rather
that they have a range of values, with longer length for
mouth than for nose and forehead. Thus, they suggest
that this canon is not valid, and therefore it should be
used with caution in cosmetic, plastic, or dental surg-
eries, and reconstruction procedures.
This analysis would require further evaluation,
as many groups were not well represented in these
datasets. For example, there are very few children,
very few people over the age of 80, and a relatively
small proportion of women. In addition, many eth-
nicities have very minor representation or none at all.
In addition to creating a new dataset that has a wider
representation, we also recommend collecting meta-
data about the images, which should include the de-
tails about each individual, such as age, race, etc., as
well as whether they have all teeth or if they have den-
tures (which is difficult to determine from these im-
ages). Furthermore, the images should include a side
profile view for each person, in addition to the frontal
view.
Another alternative to a new image database, that
is worth exploring, is to collect and annotate three-
dimensional scans. These have the potential to en-
able better localization of the four lines, as with two-
dimensional front views it is difficult to determine the
position of the Trichion and Glabella.
4 RELATED WORK
Bozkir et al. (2004) have performed the validation of
vertical and horizontal neoclassical facial canons in
Turkish young adults. They used a millimetric com-
pass to take the measurements manually. The mea-
DATA 2022 - 11th International Conference on Data Science, Technology and Applications
464
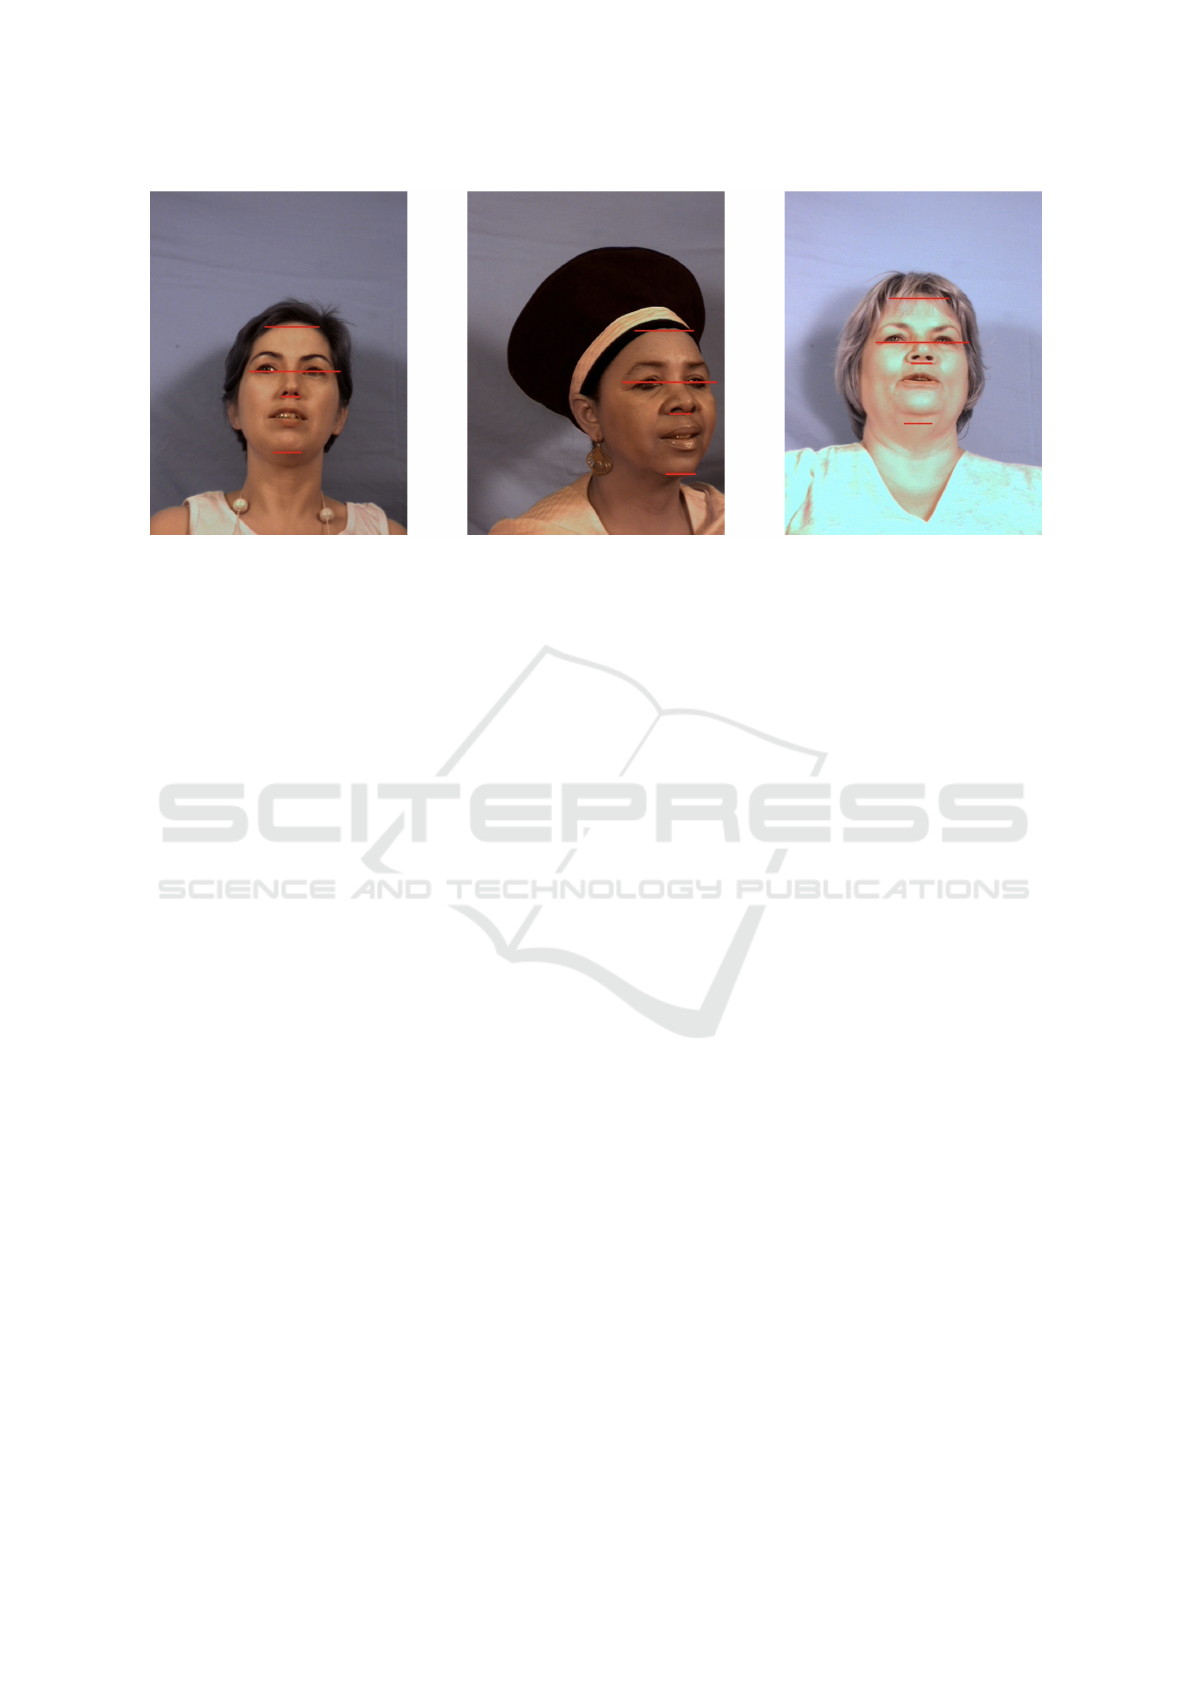
Figure 2: Incorrect placement of landmarks on some images from the MUCT database due to shift in face positions. The left
and middle images have the Glabella line misplaced, and the right image has the Glabella and Menton lines misplaced.
surements were taken manually twice by the same in-
vestigators by filling out a form for recording the val-
ues. Based on their measurements, it was observed
that only one male face had an equally divided facial
profile. It was observed that the neoclassical canons
were not valid in the majority of the population and
the canons vary among races and also countries.
Al-Sebaei (2015) have performed the validation of
the vertical canon, the orbital canon and the orbito-
nasal canon in young adults originating from the
Arabian Peninsula. They measured the neoclassical
canon using a caliper and analyzed the measurements
using Student’s t-test, general linear modeling, and
pairwise comparison of means. The results indicated
that all the three canons had variations in measure-
ments. It was found out that the lower and upper
thirds were longer than the middle thirds, the intercan-
thal distance was wider than eye fissure length and the
nasal width was wider than the intercanthal distance.
Eboh (2019) has performed a study of young
adults in South-South Nigerian Ethnic Groups, Izon
and Urhobo, to determine if there is a variation in
length among the upper, middle and lower thirds of
the face. The measurements of the thirds were taken
in millimeters by using a sliding caliper. They per-
formed data analysis with SPSS 23 by using descrip-
tive and inferential statistics. In conclusion, it was
found out that the three thirds of the face varied in
lengths. The mean lengths of the upper and lower
thirds were significantly longer in the Izon than the
Urhobo, while the mean height of the middle third
was significantly longer in the Urhobo than the Izon.
The mean height of the male lower third was sig-
nificantly longer in the Izon than the Urhobo, while
Urhobo females had significant longer middle third
than the Izon.
Schmid et al. (2008) have developed a model to
predict the attractiveness of the face based on neo-
classical canons, symmetry and golden ratios. They
used the feature point database that consists of the lo-
cations of the feature points for the faces from the
FERET database and the faces of famous people.
Neoclassical canons were one of the many predictors
of attractiveness. One of these neoclassical canons
used was the vertical canon where forehead height =
nose length = lower face height. From the experiment
results, it was found out that the vertical canon had
a significant relationship with attractiveness. It was
also found out that the attractiveness scores decreased
significantly as the proportions of the face deviated
from the proportions defined by the canons.
Pavlic et al. (2017) have explored the presence
of neoclassical canons of facial beauty among young
people in Croatia and checked for any possible
psychosocial repercussions occurring in those who
demonstrate deviations in relation to the canons. Nine
neoclassical canons of facial beauty were analyzed on
a sample of 249 people with face and profile pho-
tographs taken in Natural Head Position. Calculations
were performed in the statistical software MedCalc
14.8.1 and based on previously published data. One
of the 9 canons analyzed is the three portion facial
profile canon where trichion – nasion (tr – n) = nasion
– subnasale (n – sn) = subnasale – gnathion (sn – gn).
All analyses were performed in the software Audax-
Ceph. Significant deviations from neoclassical facial
beauty canons were found in 55–65% of adolescents
and young adults and gender and age showed no rela-
tion to deviations. Most of the deviations from canons
that affected the quality of life were the ones related
to proportions of facial thirds.
Le et al. (2002) have performed the validation of
Automated Neoclassical Vertical Canon Validation in Human Faces with Machine Learning
465
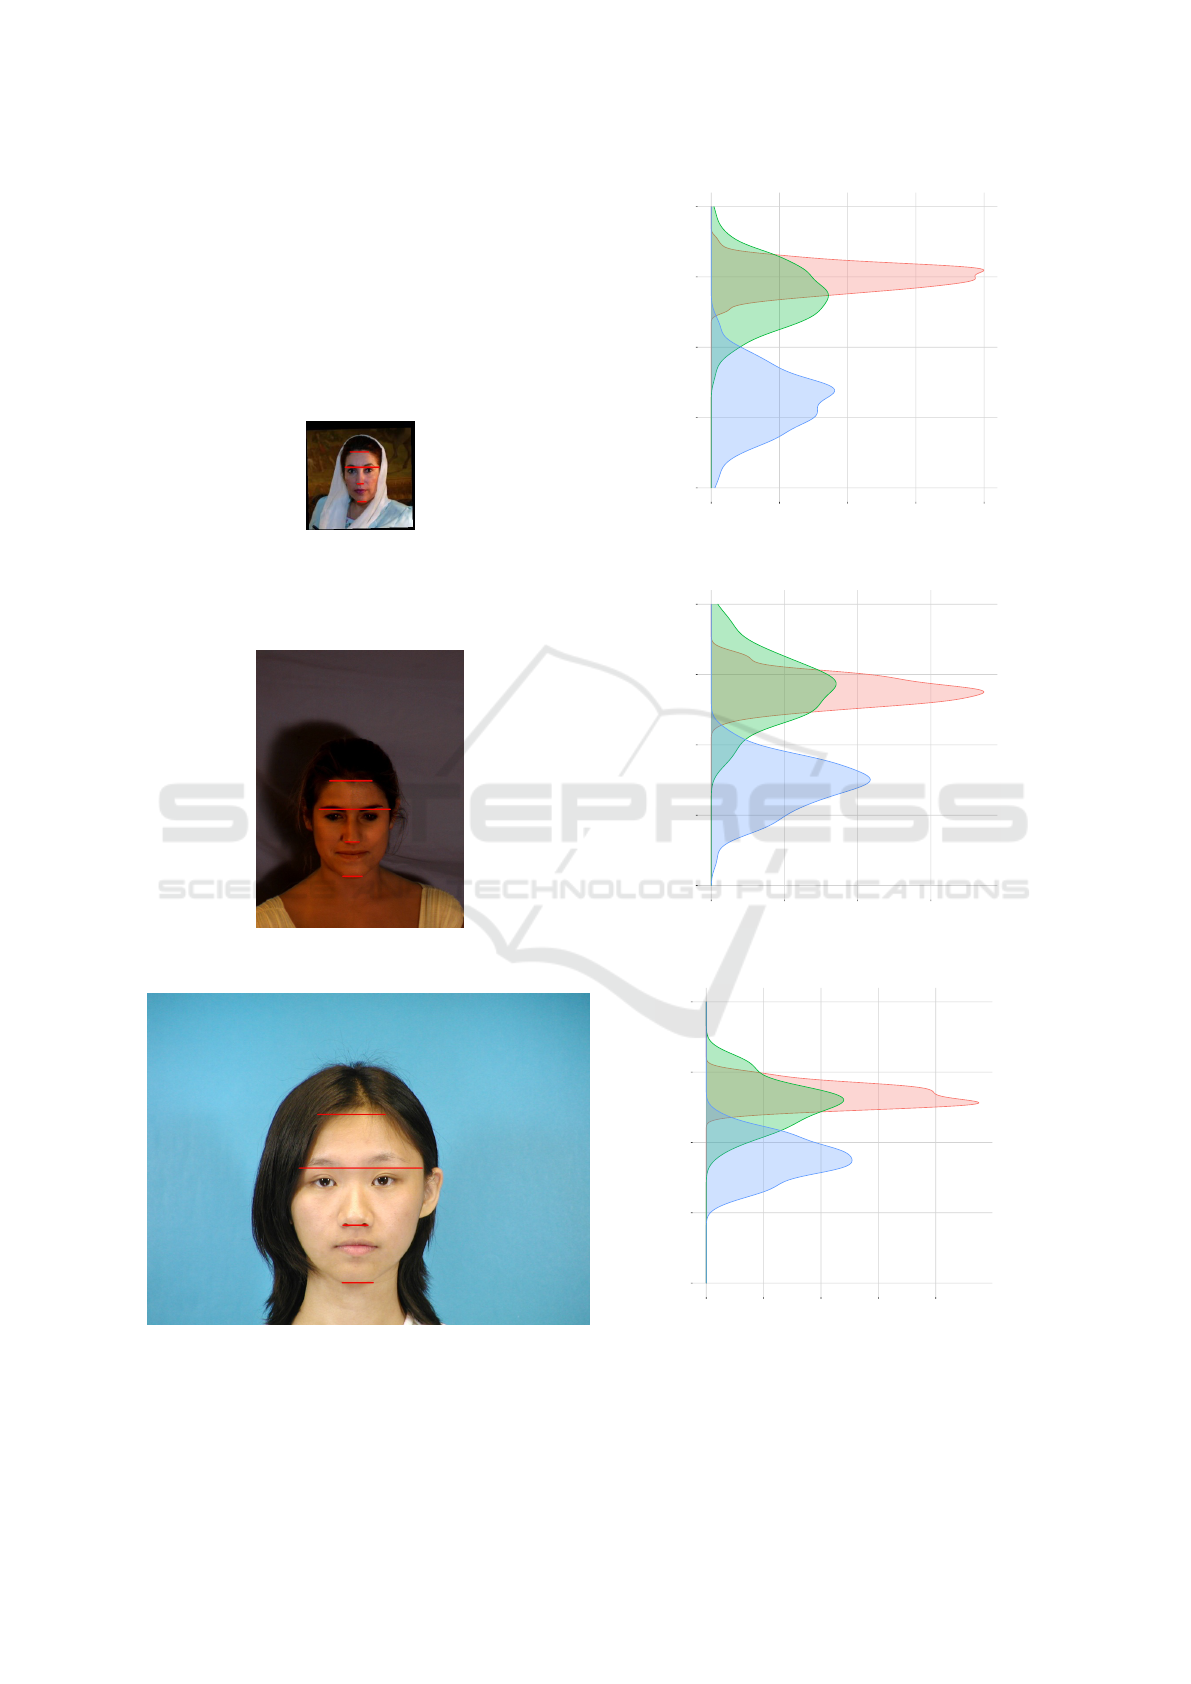
(a) Sample image from the LFW dataset. The images in this
dataset have a size of 250 × 250 pixels.
Trichion to Glabella
Glabella to Subnasale
Subnasale to Menton
0.25
0.30
0.35
0.40
0.45
0 10 20 30 40
Frequency
Normalized Distances
(b) The density distributions of the three distances for the
464 images used from the LFW dataset.
(c) Sample image from the MUCT dataset. The images in
this dataset have a size of 480 × 640 pixels.
Trichion to Glabella
Glabella to Subnasale
Subnasale to Menton
0.25
0.30
0.35
0.40
0.45
0 10 20 30
Frequency
Normalized Distances
(d) The density distributions of the three distances for the
86 images used from the MUCT dataset.
(e) Sample image from the CUHK dataset. The images in
this dataset have a size of 1024 × 768 pixels.
Trichion to Glabella
Glabella to Subnasale
Subnasale to Menton
0.25
0.30
0.35
0.40
0.45
0 10 20 30 40
Frequency
Normalized Distances
(f) The density distributions of the three distances for the 29
images used from the CUHK dataset.
Figure 3: Examples of images used in this analysis, shown to scale, from the following datasets: LFW, MUCT, and CUHK,
along with their corresponding distance distributions. The distributions for each dataset indicate that the neoclassical vertical
cannon is not valid.
DATA 2022 - 11th International Conference on Data Science, Technology and Applications
466

six neoclassical canons among healthy young adult
Chinese, Vietnamese and Thais by taking nine pro-
jective linear measurements. The nine projective lin-
ear measurements were taken by the authors by us-
ing standard anthropometric methods. These nine
measurements corresponded to six neoclassical facial
canons. It was found out that in neither Asian nor
Caucasian subjects were the three sections of the fa-
cial profile equal.
Burusapat and Lekdaeng (2019) have performed a
comparative study among sixteen Miss Universe, six-
teen Miss Universe Thailand, neoclassical canons and
facial golden ratios to find out the most beautiful fa-
cial proportion in the 21st century by using twenty-
six facial proportion points. Acrobat Reader was used
to measure the distances and angles and the data was
recorded in Microsoft Excel to compare the facial pro-
portions. From the results, it was found out that the
three-section proportion was longer in Miss Universe
Thailand than in Miss Universe group.
Amirkhanov et al. (2020) have proposed a solu-
tion for integrating aesthetics analytics into the func-
tional workflow of dental technicians. They have pre-
sented a teeth pose estimation technique that can gen-
erate denture previews and visualizations that helps
the dental technicians for designing the denture by
considering the aesthetics and choosing the most aes-
thetically fitting preset from a library of dentures, in
identifying the suitable denture size, and in adjusting
the denture position. In one of the use cases that are
demonstrated in this paper, it is stated that the den-
tal technician uses the facial and dental proportions to
identify the correspondence between the denture and
the face which means that it is important to have the
facial proportions correct for the denture to fit well on
a patient.
5 CONCLUSIONS
The neoclassical canons were used to define the dif-
ferent proportions between various areas of the head
and the face. These facial canons have been rec-
ommended in various textbooks about orthodontics,
prosthodontics, plastic and dental reconstructive surg-
eries for planning the treatment procedure. We tested
the hypothesis of the face being vertically divided
equally into thirds using machine learning. Our re-
sults indicate that the vertical dimensions of the face
are not always divided equally into thirds. Thus, this
vertical canon should be used with caution in cos-
metic, plastic or dental surgeries or any reconstruction
procedures.
REFERENCES
Al-Sebaei, M. O. (2015). The validity of three neo-classical
facial canons in young adults originating from the ara-
bian peninsula. Head & face medicine, 11(1):1–7.
Amirkhanov, A., Bernhard, M., Karimov, A., Stiller, S.,
Geier, A., Gr
¨
oller, M. E., and Mistelbauer, G. (2020).
Visual analytics in dental aesthetics. In Computer
Graphics Forum, volume 39, pages 635–646. Wiley
Online Library.
Bozkir, M., Karakas, P., and Oguz,
¨
O. (2004). Vertical and
horizontal neoclassical facial canons in turkish young
adults. Surgical and Radiologic Anatomy, 26(3):212–
219.
Burusapat, C. and Lekdaeng, P. (2019). What is the most
beautiful facial proportion in the 21st century? com-
parative study among miss universe, miss universe
thailand, neoclassical canons, and facial golden ra-
tios. Plastic and Reconstructive Surgery Global Open,
7(2).
Eboh, D. E. O. (2019). Horizontal facial thirds of young
adults in two south-south nigerian ethnic groups.
Anatomy & Biological Anthropology, 32(4):115–119.
Farkas, L. G., Hreczko, T. A., Kolar, J. C., and Munro, I. R.
(1985). Vertical and horizontal proportions of the face
in young adult north american caucasians: revision
of neoclassical canons. Plastic and Reconstructive
Surgery, 75(3):328–338.
Huang, G. B., Ramesh, M., Berg, T., and Learned-Miller,
E. (2007). Labeled faces in the wild: A database for
studying face recognition in unconstrained environ-
ments. Technical Report 07-49, University of Mas-
sachusetts, Amherst.
King, D. E. (2009). Dlib-ml: A machine learning toolkit.
Journal of Machine Learning Research, 10:1755–
1758.
Le, T. T., Farkas, L. G., Ngim, R. C., Levin, L. S., and
Forrest, C. R. (2002). Proportionality in asian and
north american caucasian faces using neoclassical fa-
cial canons as criteria. Aesthetic plastic surgery,
26(1):64–69.
Milborrow, S., Morkel, J., and Nicolls, F. (2010). The
MUCT Landmarked Face Database. Pattern Recog-
nition Association of South Africa. http://www.milbo.
org/muct.
Pavlic, A., Zrinski, M. T., Katic, V., and Spalj, S. (2017).
Neoclassical canons of facial beauty: do we see the
deviations? Journal of Cranio-Maxillofacial Surgery,
45(5):741–747.
Schmid, K., Marx, D., and Samal, A. (2008). Computa-
tion of a face attractiveness index based on neoclas-
sical canons, symmetry, and golden ratios. Pattern
Recognition, 41(8):2710–2717.
Wang, X. and Tang, X. (2009). Face photo-sketch synthesis
and recognition. IEEE Transactions on Pattern Anal-
ysis and Machine Intelligence, 31(11):1955–1967.
Automated Neoclassical Vertical Canon Validation in Human Faces with Machine Learning
467
