
COVID-19 Cell-cell Communication Imputation based on Single-cell
RNA-sequencing Data Reveals Novel Immune Signals
Dongqing Li
Scripps Institution of Oceanography, Universityof California, Sandiego, La Jolla, CA, U.S.A.
Keywords: COVID-19, Scrna-Seq, Cell-Cell Communication.
Abstract: Since its outbreak, the COVID-19 global pandemic had become one of the most serious diseases existed in
the human history. Millions of people had been infected, and the pandemic is currently affecting the whole
world in various fields such as public health, economy, and society. As a result, a better understanding of such
disease is imminently needed to effectively control the ongoing pandemic. Cell-cell communications
regulated by ligand-receptor pairs are crucial in coordinating diverse gene expression pathways. In a previous
study, researchers implemented the single-cell RNA-sequencing technology on samples collected from
COVID patients and healthy controls to obtain their cell-level RNA expression profiles. In this study, we
statistically analyzed scRNA-seq data from a COVID patient and a healthy control generated by the previous
study, and compared various gene expression between the samples with packages Scanpy and CellPhoneDB.
Various plots were created to provide a comprehensive representation and comparison between the samples
about gene expressions. The results showed numerous distinctions between the two sample in the overall gene
expression level, the expression level of several immune-related ligand-receptor pairs across different cell
type pairs, and the expression level of specific types of gene in different cell types. This study provided
computational and statistical evidences related to COVID-19 pathology, which can be further pursued through
biological experiments to obtain a better understanding of the global pandemic. The statistical analysis method
used in this study showed an alternative way that can be potentially used to better understand the SARS-CoV-
2 virus.
1 INTRODUCTION
On 31 December 2019, a novel coronavirus disease
(COVID-19) was first reported in Wuhan city, China
(Li 2020). As time passed by, more than 80,000 cases
had been found from more than 30 provinces in
People’s Republic of China, and thousands of people
around the world were died from such disease (Li
2020). The genes in ORF1 downstream region
enables COVID-19 virus to replicate itself, forming
nucleocapsid and glycoprotein spikes that allows the
viruses to attach and enter the host cells (Shereen
2020). After successfully entered the host’s cell, the
SARS-CoV-2 will release and translate the genome
RNA into pp1a and pp1ab, which are viral replicase
polyproteins, and finally turn to viral proteins due to
subgenomic mRNAs produced through discontinuous
transcription (Shereen 2020).
Single-cell RNA-sequencing (scRNA-seq) is a
technology that solves the long-existing challenge of
using genotypes to infer the phenotypes, and
therefore it can be used to obtain a better
understanding of the dynamics of the organism’s
tissues and the complex relationships between diverse
cell types (Hwang 2018). The technology enables
researchers to establish valuable insights by
examining information such as the population
distribution of cells and regulatory relationship
between genes (Hwang 2018). However, since the
technology is still new, certain challenges exist and
the technology can be furtherly improved. For
example, currently it is hard to distinguish the 0
values in the data as either undetected or unexpressed,
and the current clustering of cells may be conceiving
due to the lack of reliable reference systems
(Lähnemann 2020). While further improvement of
the technology may bring deeper insights, the current
scRNA-seq technology can still provide valuable
information that can help researchers learn about cell-
cell communications through analysis and
examination of databases (Jin 2021).
Li, D.
COVID-19 Cell-cell Communication Imputation based on Single-cell RNA-Sequencing Data Reveals Novel Immune Signals.
DOI: 10.5220/0011312700003443
In Proceedings of the 4th International Conference on Biomedical Engineering and Bioinformatics (ICBEB 2022), pages 889-896
ISBN: 978-989-758-595-1
Copyright
c
2022 by SCITEPRESS – Science and Technology Publications, Lda. All rights reserved
889

Cell-cell communication regulated by ligand-
receptor complex plays a critical role in coordinating
various biological processes such as the development
and death of cells (Jin 2021). By analyzing the gene
expression information obtained through scRNA-seq,
such intercellular communications can be inferred to
establish diverse biological discoveries (Jin 2021).
CellPhoneDB (Efremova 2020) is a Python package
that was developed to statistically analyze the
database generated by the scRNA-seq. CellPhoneDB
uses permutation tests to create null distributions that
maps ligand-receptor interactions to understand
cellular behaviors and responses to neighboring cells
(Efremova 2020). With the analysis between ligand-
receptor pairs in different cells in each given
database, a better understanding of cell-cell
communication network can be constructed with the
detailed visual presentations in the Python package
CellphoneDB. In this study, we developed a pipeline
that utilized the CellphoneDB to find cell-cell
communication patterns and discover biologically
meaningful signals out of COVID scRNA-seq data.
2 METHOD
In a recent study, researchers collected heart, kidney,
and lung tissue specimens from 19 individuals died
from COVID-19 and 7 control at New York
Presbyterian Hospital and Columbia University
Medical Center. They then analyzed the samples
using single-nucleus RNA sequencing and generated
the gene expression matrices. The data was filtered
and normalized to remove the background noise and
control the quality of the data (Li 2020). More details
including the filtering and normalization methods can
be found in their paper. One COVID patient (l07) and
one normal control (c52) counts and meta data
generated through the experiment are further
analyzed with two Python packages Scanpy and
CellPhoneDB.
Firstly, to draw the box plots that show the
percentage in total counts within a cell for the top 20
genes with the highest gene expression, we applied
the function pl.highest_expr_genes in the Python
package Scanpy. Then, to draw the violin plot that
shows the number of genes expressed in each cell and
the total counts per cell, we applied the pl.violin
function in Scanpy. Next, we applied the pl.scatter
function to draw scatter plots where the x-axis
represents the total counts of expressed genes in each
cell and the y-axis represents the number of genes
expressed in each cell. The x-axis was specified as
total_counts, and the y-axis was specified as
n_genes_by_counts. Finally, to create violin plots
that compare the expression levels of some highly
variable genes across each different cell type between
this two conditions, we again implemented the
pl.violin function.
To obtain a more thorough understanding, we also
used CellphoneDB (Efremova 2020) to create dot
plots and heatmaps to describe the cell-cell
communications and interactions between different
ligand-receptor pairs in the samples. CellPhoneDB is
a Python package that analyzes scRNA-seq data using
the permutation test. The input data of the package
should be scRNA-seq count data and an annotation of
cell-types. A null distribution that describes the
specificity between a ligand-receptor pair, which is
represented by the average mean of expression level
between ligand-receptor cell pairs, can be generated
by randomly permuting clusters of all cell-types. The
P value of the null distribution is based on the
proportion of gene expression means that have as
high or higher gene expression level than the actual
mean. The specificity between a ligand-receptor pair
can thus be inferred based on the overall amount of
significant P values across the cell-type. Smaller P
value means a more significant relativity between the
ligand-receptor pair. In the end, different ligand-
receptor pairs can be ranked based on their relativity,
and the result can then be visually represented
through functions that generate various graphs. To
obtain the significant ligand-receptor pairs, we used
the function statistical_analysis in CellphoneDB.
Then, we applied the function dot plot in Cellphone
DB to create a dot plot where the x axis represents the
ligand-receptor cell types, and the y axis represents
the ligand-receptor pairs in these cells. In the end, we
used the function heatmap plot to create heatmaps
showing the number of significant ligand-receptor
pairs between each cell type pairs.
3 RESULTS
Through the data and plots obtained, it can be clearly
observed that there are many differences between the
heathy control and the COVID patient.
Table 1: Cell type proportions in the healthy control and the
COVID patient.
Healthy Control COVID Patient
Cell Type Proportion Cell Type Proportion
T cells 0.040762 T cells 0.040762
Myeloid 0.118742 Myeloid 0.118742
Epithelial
cells
0.652193 Epithelial
cells
0.652193
B cells 0.002215 B cells 0.002215
ICBEB 2022 - The International Conference on Biomedical Engineering and Bioinformatics
890
Fibroblasts 0.101019 Fibroblasts 0.101019
Neuronal
cells
0.009304 Neuronal
cells
0.009304
Mast cells 0.005760 Mast cells 0.005760
Endothelial
cells
0.062915 Endothelial
cells
0.062915
APC-like 0.007089 APC-like 0.007089
Table 1 represents the proportion of different
types of cells in the sample of the healthy control and
the COVID patient. In the healthy control, the
proportion of Epithelial cells is the greatest, but in the
COVID patient T cells are significantly more than in
the healthy control. The pattern is the same for other
immune cells like B cells and mast cells, which
suggests the potential role that immune cells play in
patients with COVID-19.
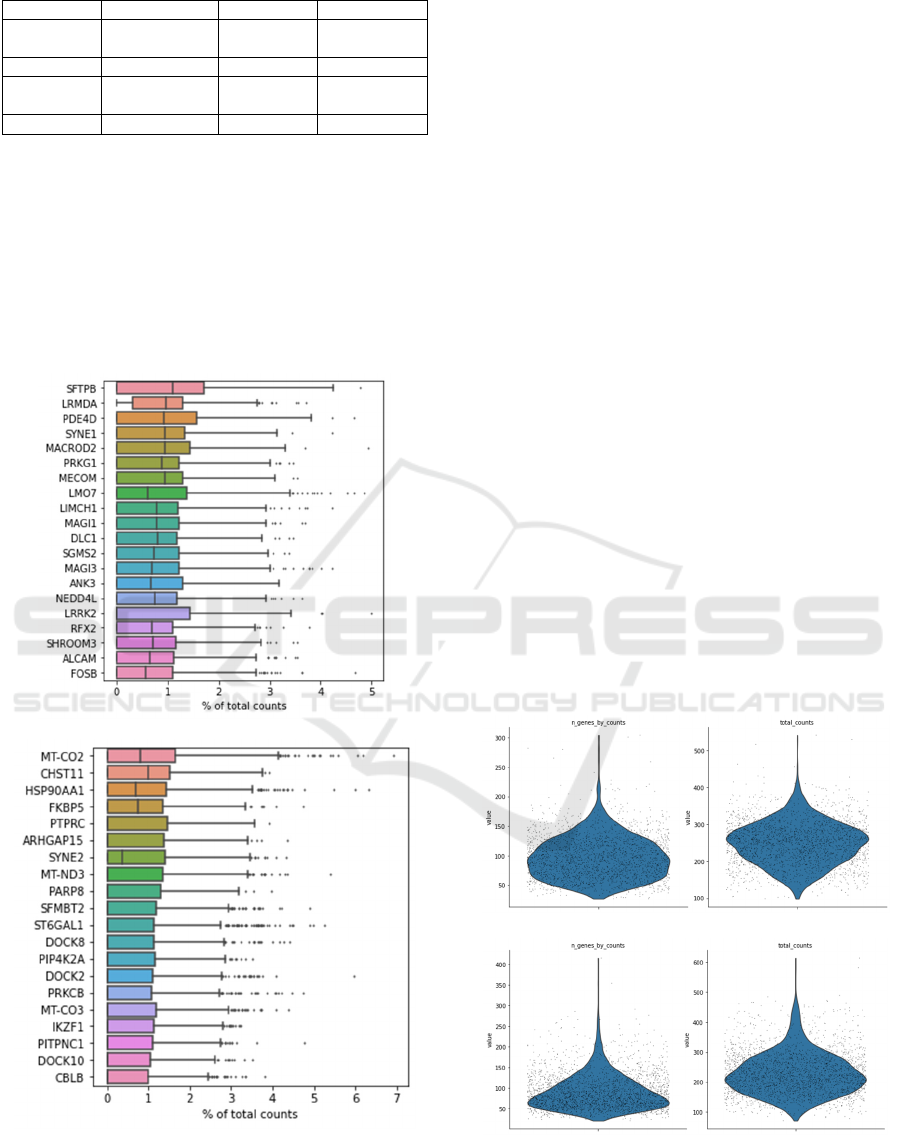
A
B
Figure 1: Box plots of highest expression genes in healthy
control (A) and COVID patient (B).
Figure 1 are box plots that represent the
percentage of different genes in each cell across all
cells in the normal control and COVID patient. By
comparing the two plots, it can be observed that the
most enriched genes between the COVID patient and
the healthy control are distinct. Many genes that were
not enriched in the normal control turned out to be
dominant in COVID patient. For example, CHST11
is more dominant in the COVID patient than in the
normal control. Previous study had shown that the
increase in expression of chondroitin
sulfotransferases like CHST11 may Lead to COVID
progression of respiratory disease (Bhattacharyya
2020). At the same time, FKBP5 in COVID patient is
also more enriched than in normal control. FKBP5
has been known as an elite gene related to
schizophrenia and depression, and the alteration in its
expression is associated with autism, and this implies
the potential impact that COVID-19 has on
neuropsychiatric disorders (Melms 2021). Last but
not least, the HSP90AA1 is also enriched in the
COVID patients. HSP90AA1 is “a highly-conserved
molecular chaperone protein” (Wauters 2021) and
has been proved to be involved in wide ranges of virus
infections and replications (Geller 2012). Previous
study had shown that HSP90AA1 has positive
correlation with the viral RNA and high level of
expression in cells with SARS-CoV-2, also known as
COVID-19, while the level is not high in SARS-CoV-
1, which implies the potential role it plays in the
COVID-19 viral infection progress (Wauters 2021,
Wyler 2021).
A B
C D
Figure 2: Total number of genes expressed and the gene
expression level in each cell in normal control (A, B) and
COVID patient (C, D).
COVID-19 Cell-cell Communication Imputation based on Single-cell RNA-Sequencing Data Reveals Novel Immune Signals
891
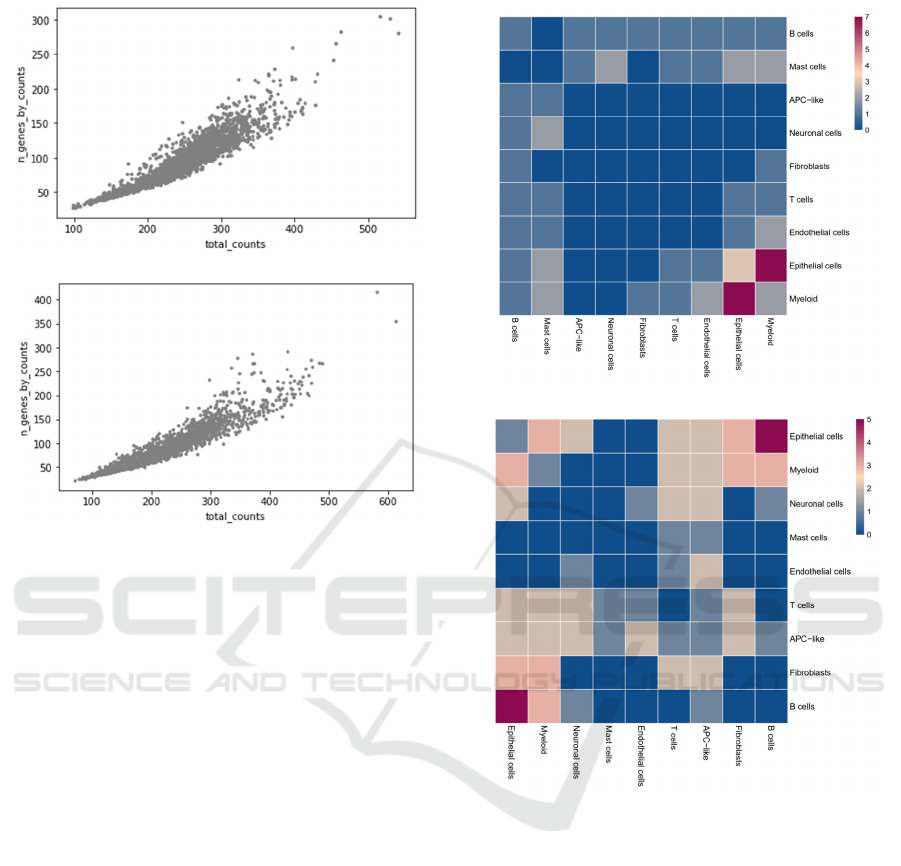
A
B
Figure 3: Scatter plot of gene expression in healthy control
A and COVID patient B.
Figure 2 and figure 3 suggest overall suppression
of gene expression across different cell types in the
COVID patient. Figure 2A represents the total
amount of expressed genes in cells of the normal
control, and figure 2B represents the gene expression
level in each cell of the COVID patient. By
comparing the plot with that of the COVID patient,
the suppression can be observed. Through the
comparison of figure 2A and figure 2C, it can be
observed that the average total amount of gene
expressed in the patient is less than that of the healthy
control. Meanwhile, by comparing figure 2B and
figure 2D, the similar observation can also be made
on the gene expression level in cells of the COVID
patient. The scatter plots in figure 3 provides deeper
insights of the observation. It clearly shows that there
are higher extreme expressions in the COVID patient,
where the outliers for figure 3B are more extreme
than the ones in figure 3A. At the same time, the
ranges of the distributions in figure 3B are also
broader than in 3A.
A
B
Figure 4: Heatmap plot of gene relativity between ligand-
receptor cell pairs in healthy control A and COVID patient
B.
Figure 4 represents the overall gene relativity
between ligand-receptor cell pairs in the healthy
control and COVID patient. Figure 4 is a heatmap
plot, and the color in each square represents the gene
relativity/number of significant ligand-receptor pairs
between the corresponding ligand-receptor cell pairs.
Due to the overall gene expression suppression
showed by figure 2 and 3, the overall amount of
significant ligand-receptor pairs decreased, which is
why the maximum amount significant ligand-
receptor cell pairs in figure 4B (5) is less than that of
figure 4A (7). By comparing figure 4A and figure 4B,
it can be clearly observed that the communications
between Epithelial cells and B cells are more
significant in the COVID patients, as the color
ICBEB 2022 - The International Conference on Biomedical Engineering and Bioinformatics
892
changed from light blue to red. Previous studies had
shown that the airway epithelial-immune cells
interactions can cause heightened harm to airway
system, including lung injury, tissue inflammatory
damage, and even respiratory failure (Chua 2020).
This result further implies the potential role that B
cells play in interacting with epithelial cells in
patients with COVID 19. At the same time, the cell
type relationships between B cells and Myeloid cells
are also stronger in the COVID patients, as the color
changed from gray to pink. Previous study has shown
that the decreased interaction between Epithelial and
myeloid may be caused by the depletion of epithelial
cells upon COVID infection (Stanford 2012). This
result implies the potential role that B cells play in
interacting with Myeloid in COVID patients and adds
new potential evidence to the previous study.
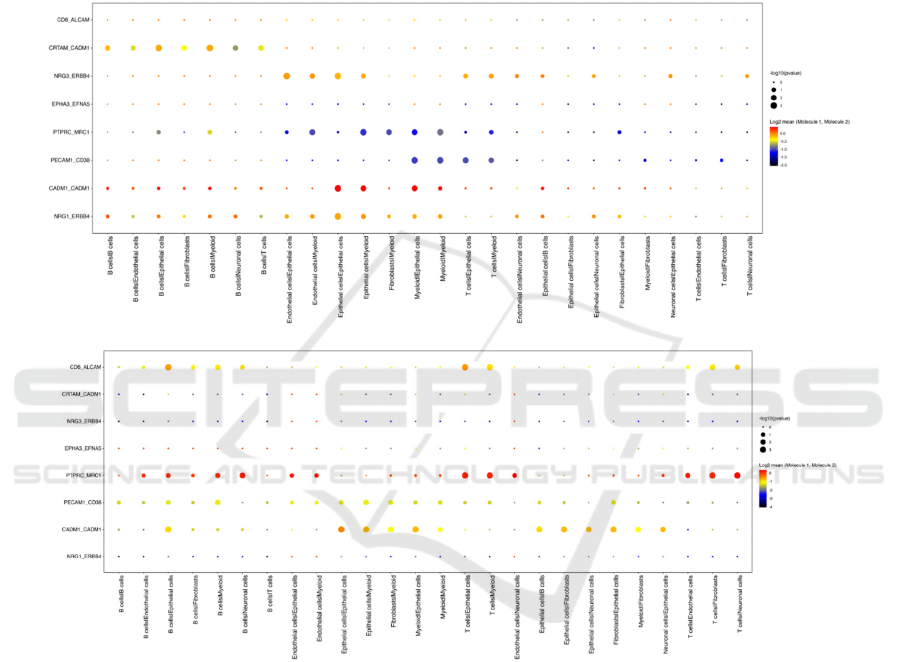
A
B
Figure 5: Dot plot of gene relativity between ligand-receptor cell pairs in healthy control A and COVID patient B.
Figure 5A and 5B provide further analysis of the
gene relativity between ligand and receptor cells by
representing specific gene pairs’ interactions between
different ligands-receptors pairs. The color of the dot
shows the mean value of the expression level. The
higher the expression level, the stronger the
interaction is, and the color will be closer to red. The
size of the dot represents the negative log p-value, and
it shows how statistically significant the relationship
is. The larger the dot means smaller the p value, which
means more statistical significance of the result
regarding the relativity between the ligand-receptor
pair. By comparing figure 5A and 5B, it can be
observed that there is significantly heightened
relativity between PTPRC and MRC1 genes in the
COVID patient. The large red dots in plot B shows
significant interactions between B/T cells and.
endothelial/epithelial/myloid/fibroblasts/neuronal
cells. B cells and T cells are both immune cells, and
the result shows the strong interaction within immune
cells or between immune cells and non-immune cells
with the PTPRC-MRC1 pathway. At the same time,
CD6-ALCAM pathway also had strong expression
between B/T immune cells and
endothelial/epithelial/myloid/fibroblasts/neuronal
cells in COVID patients. Previous studies showed
COVID-19 Cell-cell Communication Imputation based on Single-cell RNA-Sequencing Data Reveals Novel Immune Signals
893
that CD6-ALCAM pathway is responsible for T cell
activation and migration (Ampudia 2020). Through
interacting with its ligand activated leukocyte cell
adhesion molecule (ALCAM), CD6 promotes
immune synapse formation (Ampudia 2020). The
result shown in figure 5 provides further support to
the previous study, pointing out the potential
involvement of this pathway on B cells and non-
immune cells in the COVID patients. Last but not
least, the PECAM1-CD38 pathway also had stronger
expression in the COVID patient compared to healthy
control. PECAM1 is known as the ligand of CD38,
and in a previous study the potential correlation
between PECAM1 and CD38 expression in patients
with B-cell chronic lymphocytic leukemia (B-CLL)
was suggested (Ibrahim 2003). The result in figure 5
implies the potential role that PECAM1-CD38
gateway plays in patients with COVID 19, adding
another topic to be further investigated besides the
unsolved topic in the previous study.
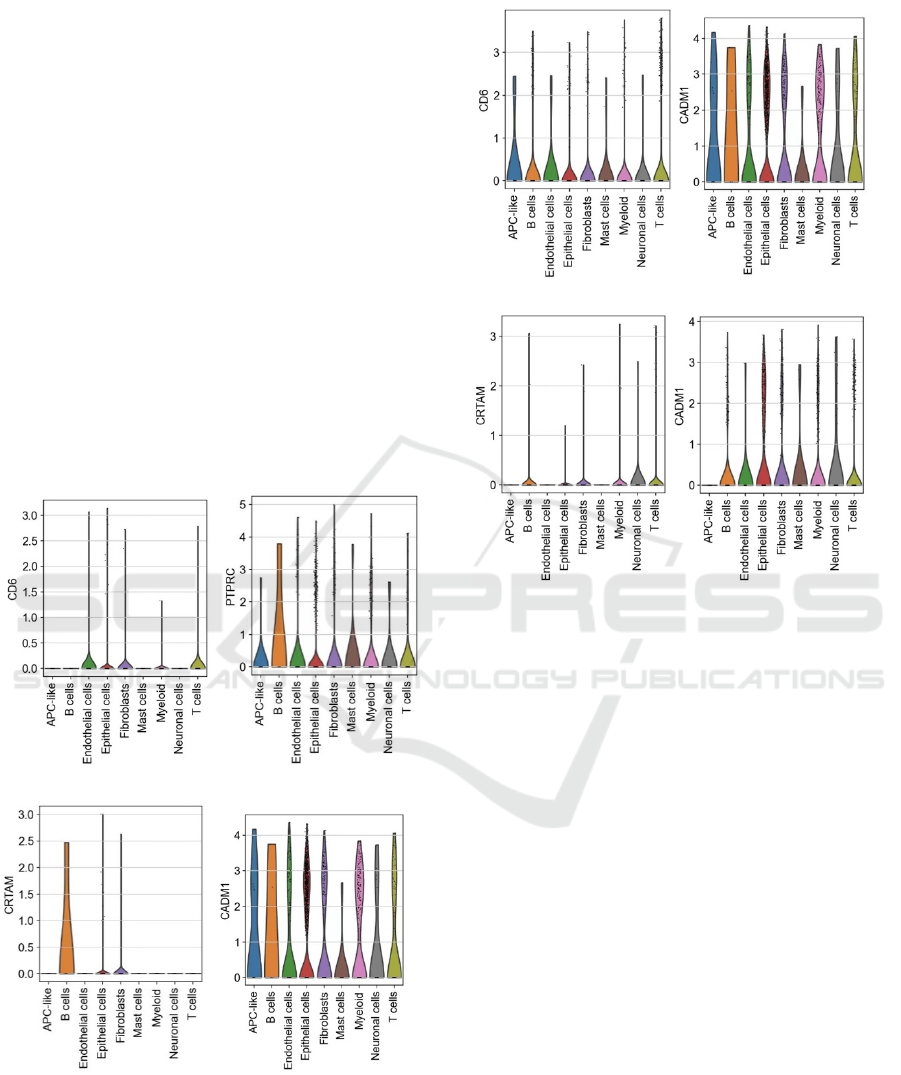
A B
C D
E F
G H
Figure 6: Violin plots that shows expression of different
genes in different cells in healthy control (A,B,C,D) and
COVID patient (E,F,G,H).
Figures on the top and figures on the bottom
represent the expression of some significant genes in
different cells of the normal control and the COVID
patients. By comparing figure 6A and 6E, it can be
observed that gene CD6 overall has higher expression
in most type of cells in the COVID patient, especially
for APC like cells, B cells. Both APC like cells and B
cells are immune cells, and previous studies have
shown the involvement of CD6 in regulating immune
responses and in contacts between cells (Consuegra-
Fernández 2018). The result in this study supports the
previous result and implies the potential role it plays
in COVID patients. At the same time, the comparison
between figure 6B and 6F shows that PTPRC gene
expression overall is significantly heightened in
various cell types of the COVID patient. Previous
studies have shown the important role that PTPRC
plays in regulating the immune functions of B cells
and T cells (Chen 2021, Shereen 2020). The result
indicates altered immune functions in cell types such
as T cells and B cells in COVID patients. In contrast,
the expression level of CRTAM is significantly lower
in COVID patients comparing to the normal control.
ICBEB 2022 - The International Conference on Biomedical Engineering and Bioinformatics
894

Previous studies had showed that CRTAM can
generate cytotoxic T cells and clear viruses in mice
(Kusnadi 2021). The result in figure 6 adds on to the
previous study, implying that COVID may have
disrupted the immune system in the COVID patients.
Thus, the expression level of some immune related
genes is down regulated in B cells. Moreover, the
CADM1 gene in immune cells of the COVID patient
is also significantly lower than in the healthy control.
CADM1 helps adhesion of cell, delivering cell
signals through contact, and plays an import role in
establishing immune responses for immune cells by
acting as the scaffolding molecule (Quincozes-Santos
2021, Sawada 2020). The result in this study shows
the potential role that CADM1 plays in B cells as its
expression largely decreased in the COVID patient.
4 CONCLUSIONS
This study statistically analyzes and compares the
data obtained from the sample of the COVID patient
and healthy control through single-cell RNA-
sequencing. Using various statistical methods, results
were generated to provide a comprehensive and
detailed comparison between the gene expression of
the healthy control and COVID patient. Through the
comparison between the samples, many significant
differences can be observed. While the gene that is
responsible for major gene expression is different in
the two samples, the overall gene expression and
number of genes expressed decayed in the COVID
patient. At the same time, genes have higher
expression in immune cells like B cells and T cells of
the COVID patient, and the communications between
non-immune cells and immune cells also increased.
All these are evidence of the immune cells’ roles in
different part of human body. By further analyzing
the different gene pathways of ligand-receptor pairs,
more detailed interactions and correlation were
understood. The result also provided new topics that
require further research to gain more insights. Since
this study only analyzes two of samples, possible
errors may exist due to the limit data. At the same
time, direct corrections between genes and proteins
produced are assumed in this study. The input of
Cellphone DB (Efremova 2020) is mRNA-level data,
but the conclusions are inferred based on protein
interactions. This can be solved through further
analysis of more samples, and the result obtained can
be more accurate. However, the study can act as a
starting point and provide a novel way to analyze data
and better understand the effect of COVID-19 on
patients.
REFERENCES
Ampudia, J. et al. 2020. CD6-ALCAM signaling regulates
multiple effector/memory T cell functions. The Journal
of Immunology. 204, 1 Supplement (May 2020), 150.13
LP-150.13.
Bhattacharyya, S. et al. 2020. Increased expression of
chondroitin sulfotransferases following AngII may
contribute to pathophysiology underlying Covid-19
respiratory failure: Impact may be exacerbated by
decline in arylsulfatase B activity. bioRxiv. (2020).
DOI:https://doi.org/10.1101/2020.06.25.171975.
Chen, G. et al. 2021. Differential immune responses in
pregnant patients recovered from COVID-19. Signal
Transduction and Targeted Therapy. (2021).
DOI:https://doi.org/10.1038/s41392-021-00703-3.
Chua, R.L. et al. 2020. COVID-19 severity correlates with
airway epithelium–immune cell interactions identified
by single-cell analysis. Nature Biotechnology. (2020).
DOI:https://doi.org/10.1038/s41587-020-0602-4.
Consuegra-Fernández, M. et al. 2018. Clinical and
experimental evidence for targeting CD6 in immune-
based disorders. Autoimmunity Reviews.
Efremova, M. et al. 2020. CellPhoneDB: inferring cell–cell
communication from combined expression of multi-
subunit ligand–receptor complexes. Nature Protocols.
(2020). DOI:https://doi.org/10.1038/s41596-020-0292-
x.
Geller, R. et al. 2012. Broad action of Hsp90 as a host
chaperone required for viral replication. Biochimica et
Biophysica Acta - Molecular Cell Research.
Hwang, B. et al. 2018. Single-cell RNA sequencing
technologies and bioinformatics pipelines.
Experimental and Molecular Medicine.
Ibrahim, S. et al. 2003. Clinical relevance of the expression
of the CD31 ligand for CD38 in patients with B-cell
chronic lymphocytic leukemia. Cancer. (2003).
DOI:https://doi.org/10.1002/cncr.11264.
Jin, S. et al. 2021. Inference and analysis of cell-cell
communication using CellChat. Nature
Communications. (2021).
DOI:https://doi.org/10.1038/s41467-021-21246-9.
Kusnadi, A. et al. 2021. Severely ill COVID-19 patients
display impaired exhaustion features in SARS-CoV-2-
reactive CD8+ T cells. Science Immunology. (2021).
DOI:https://doi.org/10.1126/SCIIMMUNOL.ABE478
2.
Lähnemann, D. et al. 2020. Eleven grand challenges in
single-cell data science. Genome Biology.
Li, H. et al. 2020. Coronavirus disease 2019 (COVID-19)
in Zhejiang, China: an observational cohort study.
International Journal of Antimicrobial Agents. 55, 5
(2020), 105951.
Melms, J.C. et al. 2021. A molecular single-cell lung atlas
of lethal COVID-19. Nature. (2021).
DOI:https://doi.org/10.1038/s41586-021-03569-1.
Quincozes-Santos, A. et al. 2021. COVID-19 impacts the
expression of molecular markers associated with
neuropsychiatric disorders. Brain, Behavior, &
COVID-19 Cell-cell Communication Imputation based on Single-cell RNA-Sequencing Data Reveals Novel Immune Signals
895

Immunity - Health. (2021).
DOI:https://doi.org/10.1016/j.bbih.2020.100196.
Sawada, Y. et al. 2020. The role of cell adhesion molecule
1 (CADM1) in cutaneous malignancies. International
Journal of Molecular Sciences.
Shereen, M.A. et al. 2020. COVID-19 infection: Origin,
transmission, and characteristics of human
coronaviruses. Journal of Advanced Research.
Stanford, S.M. et al. 2012. Regulation of TCR signalling by
tyrosine phosphatases: From immune homeostasis to
autoimmunity. Immunology.
Wauters, E. et al. 2021. Discriminating mild from critical
COVID-19 by innate and adaptive immune single-cell
profiling of bronchoalveolar lavages. Cell Research.
(2021). DOI:https://doi.org/10.1038/s41422-020-
00455-9.
Wyler, E. et al. 2021. Transcriptomic profiling of SARS-
CoV-2 infected human cell lines identifies HSP90 as
target for COVID-19 therapy. iScience. (2021).
DOI:https://doi.org/10.1016/j.isci.2021.102151.
ICBEB 2022 - The International Conference on Biomedical Engineering and Bioinformatics
896
