
An Information System for Air Quality Monitoring using Mobile Sensor
Networks
Pedro Mariano
1 a
, Susana Marta Almeida
2 b
, Alexandre Almeida
3 c
, Carolina Correia
2 d
,
Vânia Martins
2 e
, José Moura
3 f
, Tomás Brandão
1 g
and Pedro Santana
1 h
1
ISTAR, Instituto Universitário de Lisboa (ISCTE-IUL), Lisboa, Portugal
2
Centro de Ciências e Tecnologias Nucleares, Instituto Superior Técnico, Lisboa, Portugal
3
IT, Instituto Universitário de Lisboa (ISCTE-IUL), Lisboa, Portugal
Keywords:
Mobile Sensor Network, Software Engineering, Air Quality Monitoring.
Abstract:
Engineering the information system that runs a heterogeneous mobile sensor network is a complex task. In
this paper we present the solution that was developed in the context of the ExpoLIS project. The goal of this
project is to deploy a network of mobile (low-cost) sensors in city buses. Besides the software that needs to
transfer, process, and store sensor data, we also developed a mobile application to increase awareness on air
pollution, and a tool that allows scientists to subscribe to sensor data. We present the engineering solutions
that form the backbone of the information system, and the structure and design of developing supporting tools.
We discuss our choices regarding how sensor data are processed in order to make these data available for the
common citizen. We mention possible future directions for the software that we have developed.
1 INTRODUCTION
Industrial nations around the world have witnessed
an increase in air pollution due to increased traffic,
and industrial activities. Natural events such as fires
and dust storms also degrade air quality. This has led
to the deployment of air monitoring stations. Mea-
surements made by these stations are used by differ-
ent agencies to check pollution levels, to warn citi-
zens when levels are dangerous, and to follow the re-
sults of environmental policies. While air monitoring
stations provide highly accurate measurements, their
high costs hinder their dissemination. As a result, they
have low spatial coverage.
With the advent of Low Cost Sensors (LCS), there
has been an increase in the deployment of sensor net-
works to monitor several air parameters (Becnel et al.,
2019; Weissert et al., 2020; Hasenfratz et al., 2015;
a
https://orcid.org/0000-0003-3813-1009
b
https://orcid.org/0000-0002-8506-6679
c
https://orcid.org/0000-0002-4813-6164
d
https://orcid.org/0000-0002-5904-2104
e
https://orcid.org/0000-0003-2465-5880
f
https://orcid.org/0000-0002-3516-8781
g
https://orcid.org/0000-0002-8603-9795
h
https://orcid.org/0000-0002-4357-1546
Lin et al., 2020). Their low cost, small size, and mo-
bility allows greater dissemination and thus increased
measurements and spatial coverage. As a result, we
can accurately track the impact of human activities.
The ExpoLIS project (Santana et al., 2021) aims to
develop an air quality exposure sensing system, com-
posed by a network of sensor nodes, and deploy it on
public transportation (buses) to obtain the real-time
air pollution distribution in urban areas. Gathered
data will be used to raise awareness of citizens (Teles
et al., 2020) and will be made available for environ-
mental scientists. These data can be used to train pol-
lution prediction models (Mariano et al., 2021).
Several research projects often present a high level
description of their information system, either focus-
ing on semantics (Calbimonte et al., 2014), or truthful
sensing (Radanovic and Faltings, 2015). In this pa-
per, we will describe the engineering approach in the
ExpoLIS project to build the information system that
collects sensor data, stores sensor information, and al-
lows users to consult the data. Compared to other pa-
pers (Esquiagola et al., 2018; Kersting et al., 2017),
we complement them by offering a detailed descrip-
tion of the technical challenges and learned lessons on
designing a novel information system, which supports
the above referred functionalities.
238
Mariano, P., Almeida, S., Almeida, A., Correia, C., Martins, V., Moura, J., Brandão, T. and Santana, P.
An Information System for Air Quality Monitoring using Mobile Sensor Networks.
DOI: 10.5220/0011320400003271
In Proceedings of the 19th International Conference on Informatics in Control, Automation and Robotics (ICINCO 2022), pages 238-246
ISBN: 978-989-758-585-2; ISSN: 2184-2809
Copyright
c
2022 by SCITEPRESS – Science and Technology Publications, Lda. All rights reserved
This paper is organised as follows. The informa-
tion system is presented in Section 2. Then, a discus-
sion regarding the developed work and possible lines
of future work is provided in Section 3. Finally, some
conclusions are drawn in Section 4.
2 INFORMATION SYSTEM
The information system that comprises ExpoLIS con-
tains a database server where sensor and processed
data are stored, a route planner server, a web server
targeted at the scientific community where they can
subscribe to sensor data, and a mobile application for
citizens which displays air quality information and
provides an interface for the route planner. The back-
bone of this information system is the database where
sensor readings are stored. We will start by describing
a list of requirements that guided the development of
this collection of applications. This will serve to in-
troduce the data model, after which we will describe
the main components of each application.
The database was implemented in PostgreSQL as
it contains PostGIS
1
, a spatial plugin that provides
geographical objects and queries. The route planner
server was implemented using Open Source Routing
Machine (OSRM)
2
a routing service that uses Open-
StreetMap (OSM) data (Luxen and Vetter, 2011). Be-
sides a database where sensor data are stored, there
is a second database where OSM data are imported
using the osm2pgsql tool. The mobile application
was developed in Java and was targeted for the An-
droid operating system. Apache was the chosen web
server. Our LCS use MQTT (MQTT, 2019) to com-
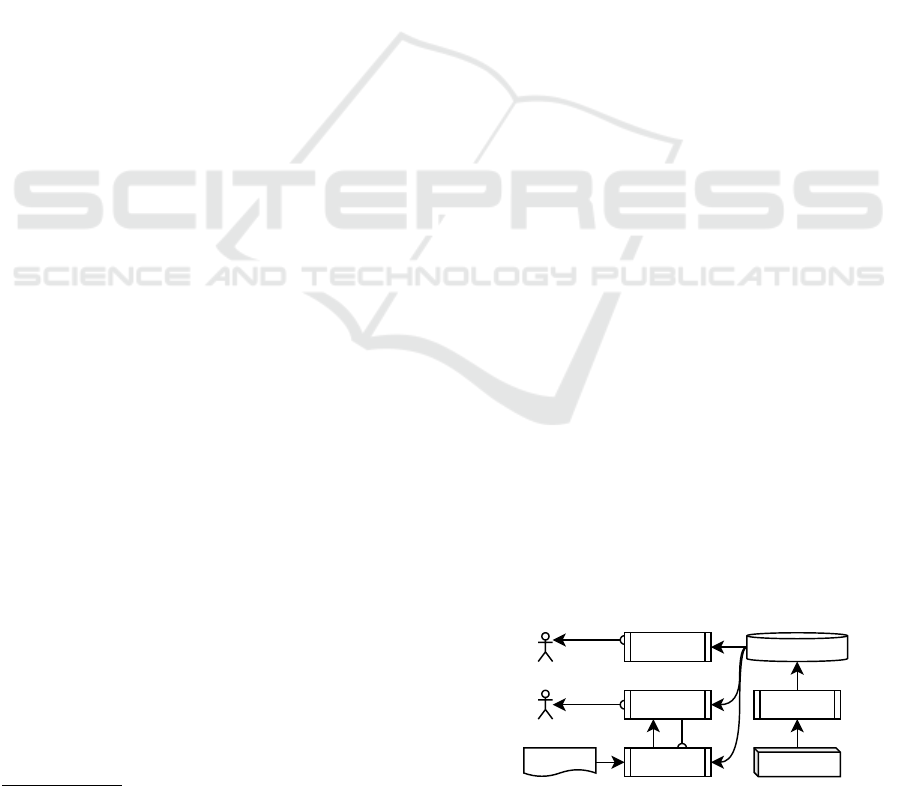
municate data to the sensor database. Figure 1 shows
an overview of the ExpoLIS information system with
major applications, hardware and actors.
2.1 Requirements
In the beginning of the ExpoLIS project we tested dif-
ferent LCS to check their reliability, accuracy, and
available software libraries. We decided to moni-
tor the following set of air quality parameters: PM1,
PM2.5, PM10, NO
2
, CO, temperature, pressure, and
humidity. Since we had no sensor data of our own at
the beginning of the project, we had to rely on pub-
lic available data to test the developing software. We
decided to use the data available from the OpenSense
project (Maag et al., 2018), in particular the air qual-
ity parameters number of particles, particle diame-
1
For more information see https://postgis.net/.
2
For an example see http://project-osrm.org/.
ter and LDSA. This last parameter, an acronym for
Lung Deposited Surface Area, is a proxy for the quan-
tity of particulate matter that can be deposited in the
lung (Kuuluvainen et al., 2016).
The first requirement derived from the fact that we
had heterogeneous sensor data. That is to say, two
data collecting hardware equipment could have dif-
ferent sensors.
Since we are aiming for a mobile LCS network,
every sensor reading would have a geo-location, in-
dependently of the hardware. A timestamp is also
required for data analysis. Therefore, the second re-
quirement was the need for precise date and location.
Contrary to air quality monitoring stations that
provide hourly data, LCS tend to provide data with
higher temporal resolution. This tends to increase sig-
nificantly the amount of data that is acquired. More-
over, LCS are less accurate, which may increase the
number of outliers. Given these factors, the third re-
quirement was to aggregate sensor data both periodi-
cally and geographically. Plots and analysis would be
based on these aggregated data.
Despite the high spatial resolution provided by the
sensor network, it is interesting to obtain a predic-
tion of air quality in zones where the sensors can-
not reach. This can be achieved by interpolating sen-
sor data. Typically, interpolating algorithms use data
from a specific time period and generate a mesh of
values with a specific resolution. As such, the fourth
requirement is the ability to store interpolated data.
2.2 Data Model
2.2.1 Database Model
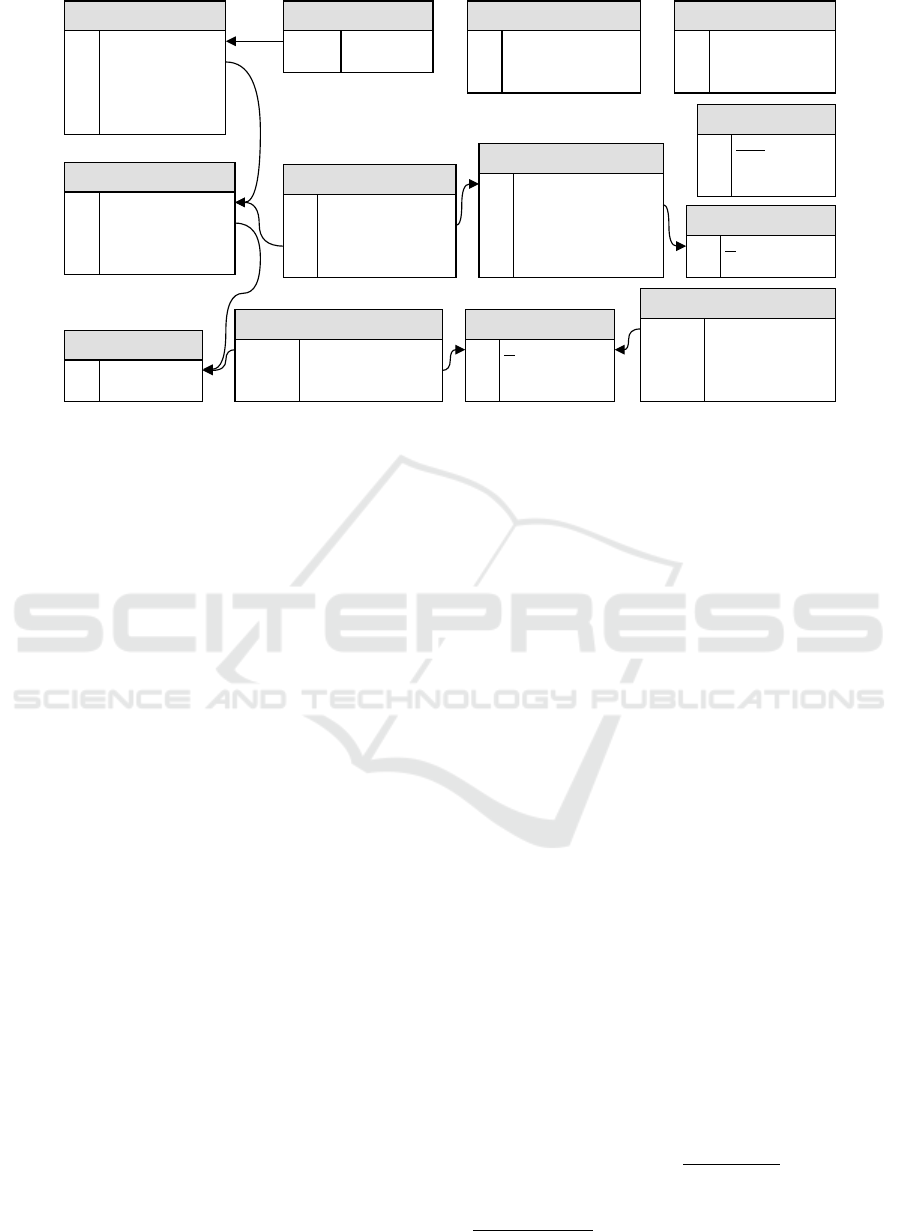
Given the requirements described in the previous sec-
tion, we elaborated the database model shown in Fig-
ure 2. This model shows the tables and foreign keys
that are present in the database. Sensor readings
are stored in table measurement_properties and in
a collection of tables that in figure are represented
by table measurement_data_D where letter D rep-
resents a physical sensor measure. Table measure-
ment_properties stores the timestamp and the geo-
location (attributes when and location). Since the
sensor node
data server
web server
mobile app
sensor database
OSRM data
route planner
citizen
scientist
Figure 1: Overview of the ExpoLIS information system and
use cases. Arrow connectors represent information flow,
while round connectors represent calls.
An Information System for Air Quality Monitoring using Mobile Sensor Networks
239

GPS sensor provides an error estimate, we also store
it. With this arrangement of tables, we can han-
dle heterogeneous LCS mobile networks. Two dif-
ferent equipment can produce measurements of dif-
ferent physical quantities. Each one would generate
two different sets of entries in the table set measure-
ment_data_D.
Table aggregation_S_D_P_R represents a collec-
tion of tables that contains aggregated data. Letter
S stands for one of the three aggregation functions
used in our system: minimum, maximum, and aver-
age. The letter D represents again a physical quan-
tity measured by a sensor. Letters P and R are re-
lated to the periodicity and resolution, respectively,
used when aggregating data. Currently, we have im-
plemented hourly and daily periods, and 100 m and
1000 m spatial resolutions.
In the data model, table interpolation_M_D_P_R
represents a collection of tables that contain interpo-
lated data. Letter M stands for the interpolation al-
gorithm used, while the letters D, P, and R have the
meaning described above.
Information about the sensor hardware is rep-
resented by tables node_sensors, sensor_hardware,
sensor_specifications, and sensor_type. Of these ta-
bles, the most important is node_sensors as it rep-
resents a node of the sensor network (sensor node)
and it is referenced by sensor measurements. Its at-
tributes allow us to represent when a sensor node was
deployed and to specify its description. The other ta-
bles serve to describe the LCS that are installed in
a particular sensor node. Table sensor_type is used
to describe what physical quantity (e.g., PM1, tem-
perature) the sensor measures. Sensor specification
is stored in another table in order to cope with het-
erogeneous sensors that, although measure the same
quantity, have different accuracies and/or ranges.
As the sensor nodes are going to be deployed in
city buses, tables bus, bus_assignment, line_path, and
line are used to represent physical buses and the lines
they travel through. Entries in table bus are refer-
enced by records in table node_sensors thus indicat-
ing in which bus a node sensor is deployed.
The final table in the data model is subscrip-
tions, which stores information about user subscrip-
tions. Users will periodically get informed (through
an email) when new data are available. Currently we
support hourly and daily updates.
2.2.2 Class Diagram
The database model presented in the previous section
constitutes the core of the data model used throughout
the applications that form the ExpoLIS information
system. Applications that use the information stored
in the database, have classes that match most of the ta-
bles presented in Figure 2. There are, however, other
concepts that are not represented in this figure, but are
central to these applications. Figure 3 shows a class
diagram of these concepts.
Of particular importance are the four enumerators
Statistic, Period, Resolution, and InterpolationMethod,
which are used to process sensor data and store these
in the collection of tables aggregation_S_D_P_R and
interpolation_M_D_P_R. These enums are used to
create the table names, to specify which SQL func-
tion should be used when aggregating, the longitude
and latitude resolution to use when creating an inter-
polated mesh, the application that interpolates data,
and to generate the source code for the web server
and mobile application.
Class SensorData represents a physical quantity
measured by a LCS. Again, its attributes are used to
generate the source code for the web pages, and the
mobile app. Another attribute is used to process mes-
sages sent by the sensor node. There are a set of flag
attributes that specify if sensor data are used by the
mobile app, the routing server, or can be subscribed.
The remaining attribute is used by route planner. De-
tails about this attribute will be discussed below.
Enumerator Travel is used by the software compo-
nents that deal with the route planner. It represents the
different mediums that can be used when going from
one place to another. It is used when computing a
route that takes into consideration pollution exposure.
Travel enums are discussed below.
2.3 Data Server Scripts
The data server is where sensor information is stored.
It forms the main core of the ExpoLIS information
system. As the data server runs in the same machine
as the subscription web server and route planner, we
have decided to integrate them and make them avail-
able as a single package
3
.
The ExpoLIS information system contains a set of
scripts that are responsible for receiving sensor data,
processing them, and making them available for end-
users. There are also scripts that support the route
planner. As the mobile sensor can be heterogeneous,
and new sensors can be added to it, there is also a
script to provide this functionality.
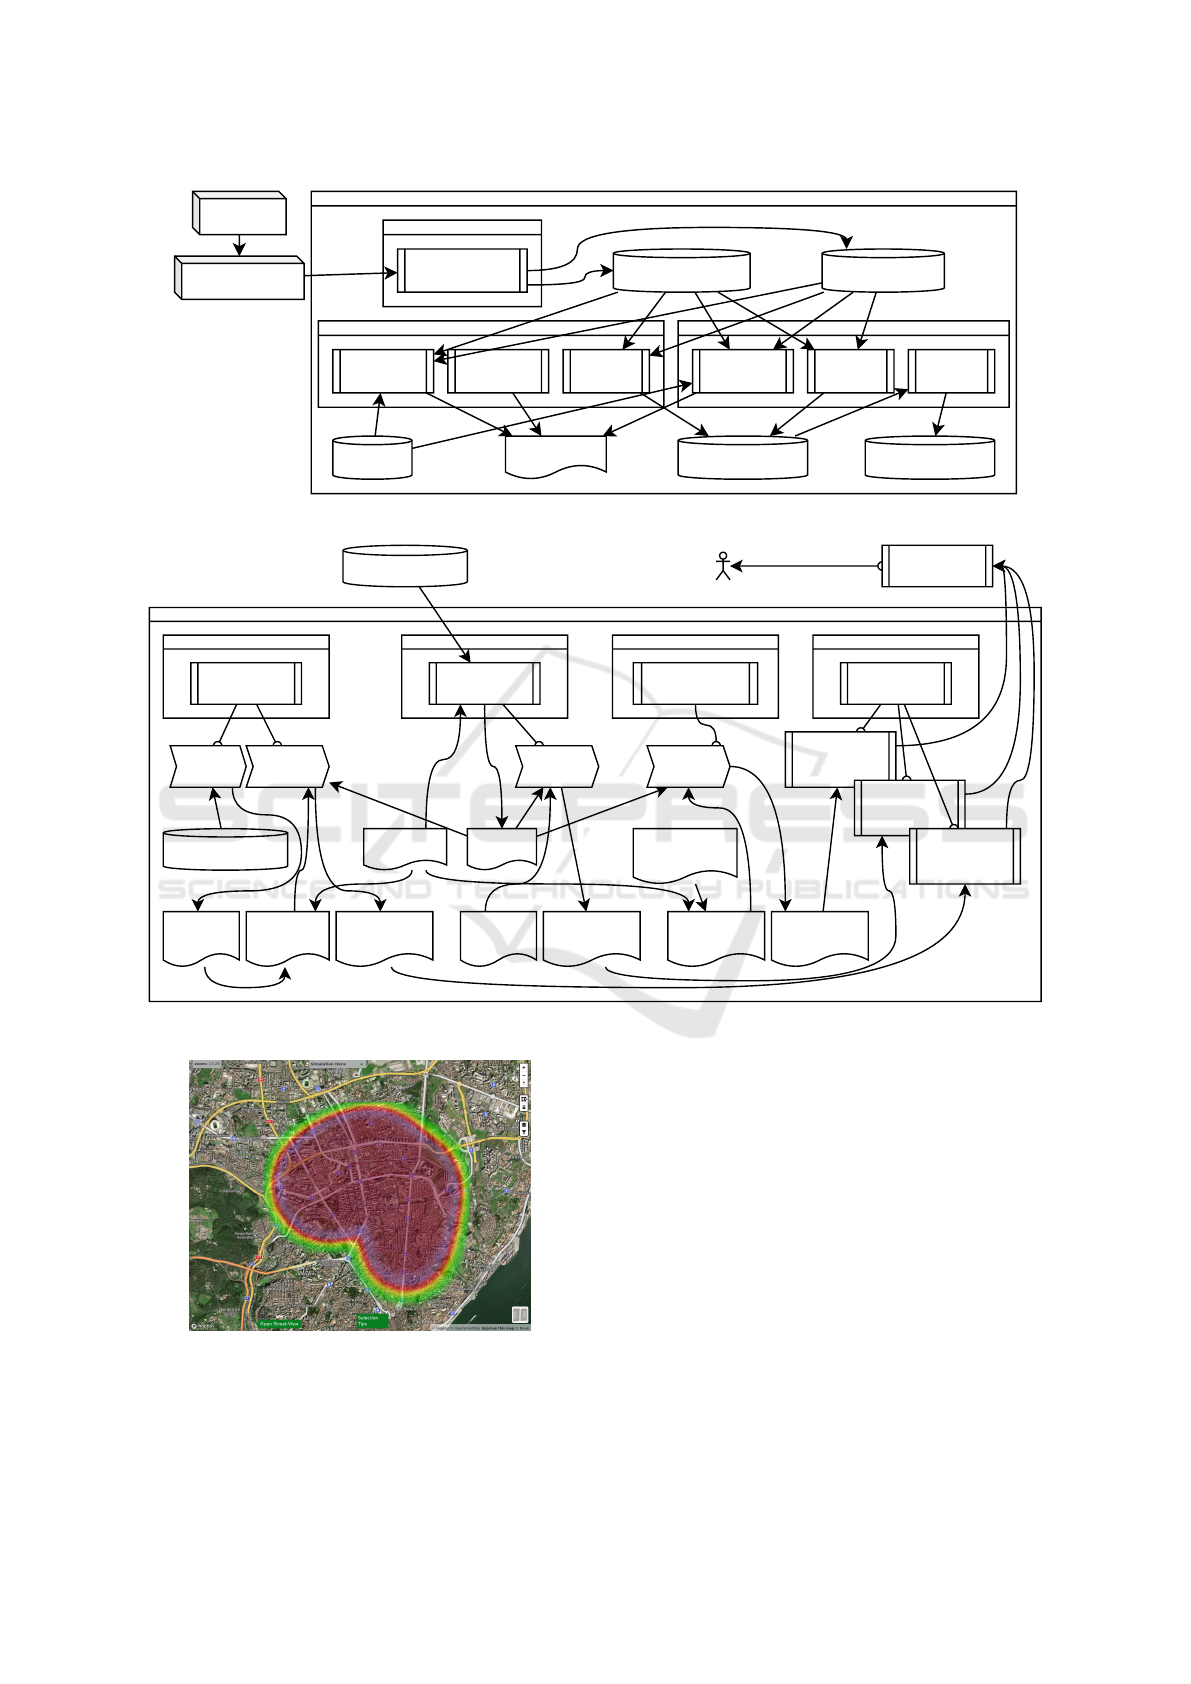
An illustration of how information sent by a sen-
sor node is processed is depicted in Figure 4. Scripts
that run on the sensor data server are represented by
rectangles. They are organised depending on whether
3
The source code and instructions for installing
these three servers are available at http://github.com/
expolis-project/expolis-server.
ICINCO 2022 - 19th International Conference on Informatics in Control, Automation and Robotics
240
measurement_data_D
refID
PK,FK
value: INTEGER
sensor_specifications
ID
PK
typeID
FK
product_description: TEXT
AK
min_value: INTEGER
max_value: INTEGER
sensor_type
ID
PK
description: TEXT
sensor_hardware
ID
PK
specificationsID
FK
nodeID
FK
serial_description: TEXT
AK
measurement_properties
ID
PK
nodeID
FK
location: GEOMETRY
when: INTEGER
gps_error: FLOAT
node_sensors
ID
PK
busID
FK
serial_description: TEXT
deployed: TIMESTAMP
line
ID
PK
number: INTEGER
description: TEXT
bus_assignment
busID
PK,FK
lineID
PK,FK
assigned: TIMESTAMP
PK
subscriptions
email
PK
salt: TEXT
period: INTEGER
bus
ID
PK
description: TEXT
AK
line_path
lineID
PK,FK
number: INTEGER
PK
order: INTEGER
PK
location: GEOMETRY
aggregattion_S_D_P_R
location: GEOMETRY
PK
when: INTEGER
PK
value: INTEGER
interpolation_M_D_P_R
location: GEOMETRY
PK
when: INTEGER
PK
value: INTEGER
Figure 2: Database model of the ExpoLIS information system.
they are running continuously waiting for events, or
are periodically run. In the latter case, they are also
organised by the periodicity. These scripts access ta-
bles in the database (represented by cylinders), and/or
files (represented by rectangles). External processes
are represented by 3D boxes.
One of the persisting scripts is responsible for sub-
scribing to MQTT messages and to process sensor
data. Whenever a new message arrives, its content is
processed. The MQTT message is an array of sensor
values. Recall that a SensorData object contains the
index where its value is stored in the previous array.
Sensor data are stored in the corresponding tables. In
turn, this is used by scripts that run periodically to ag-
gregate and interpolate data, to process subscriptions
and create CSV files with subscribed sensor data, and
to clean these CSV files.
There are other scripts related to the routing appli-
cation and the OSRM servers. These are discussed in
the following section.
2.4 Route Planner
The route planner is based on OSRM. In order to in-
stall one OSRM, one has to specify a geographical
region in OSM format. This region is processed us-
ing an OSRM tool chain that processes the roads in
the OSM region file in order to compute the weight of
edges of the graph that form the road network. When
computing the weight of a road, one can specify a
OSRM profile where the weight may be further ad-
justed. It is in this profile that we can use any sensor
reading to modify the road weight. These profiles are
written in the LUA scripting language
4
.
OSRM comes with three predefined profiles: one
for vehicles, one for bikes and a third for walking.
They automatically filter out any road that cannot be
traversed by a car, bike or person. We adapted these
profiles to add three additional profiles that adjust the
weight depending on sensor readings. The weight
of road w of these new profiles is a linear combina-
tion of the weight computed by the predefined pro-
file and a sensor-based pollution value p(w). The pa-
rameters of the linear combination are specified by
attributes weight_osrm and weight_pollution of class
OSRMRasterConfig.
In order to compute the pollution value p we use
the following OSRM functionality. In OSRM we can
query a matrix, P, that is associated to a rectangular
geographical region, to obtain the value, P
i, j
, in a par-
ticular location l within that region. This means that
matrix entry (i, j) is the one that matches geographi-
cal location l. This matrix is computed using inter-
polated data, which in turn depends on aggregated
data (table sets interpolation_M_D_P_R and aggrega-
tion_S_D_P_R, respectively). Only sensor data that
is flagged as usable by the router is used (see attribute
route_planer_flag in class SensorData in Figure 3).
The interpolated data goes through a filter to select
the pollution with the maximum concentration using
attribute pollution_limit. The value of element (i, j) in
the pollution matrix P is given by:
P
i, j
= 1 + max
d∈D
x
d
(i, j) − L
d
L
d
, (1)
where D represents the set of all route enabled sen-
4
https://www.lua.org/
An Information System for Air Quality Monitoring using Mobile Sensor Networks
241

<<enum>>
Period
HOURLY
DAILY
+ description: string
+ sql_identifier: string
+ date_trunc: string
<<enum>>
Resolution
HUNDRED_METERS
THOUSAND_METERS
+ description: string
+ sql_identifier: string
+ cell_longitude_size: float
+ cell_latitude_size: float
<<enum>>
Statistic
AVERAGE
MAXIMUM
MINIMUM
+ description: string
+ sql_function: string
+ sql_type: string
+ sql_java_identifier: string
<<enum>>
InterpolationMethod
KRIGING
+ description: string
+ sql_identifier: string
+ command_line: string
SensorData
+ description: string
+ sql_java_identifier: string
+ mqtt_message_index: int
+ mobile_app_flag: bool
+ route_planner_flag: bool
+ subscribe_flag: bool
+ pollution_limit: float
+ tableMeasurement(): string
+ tableAggregation(Statistic,Period,Resolution): string
+ tableInterpolation(InterpolationMethod,Period,Resolution): string
<<singleton>>
OSRMRasterConfig
+ region_osm_url: string
+ min_longitude: float
+ max_longitude: float
+ min_latitude: float
+ max_latitude: float
+ number_rows: int
+ number_columns: int
+ weight_osrm: float
+ weight_pollution: float
+ loadOSRMRasterConfig()
<<enum>>
Travel
FOOT
BICYCLE
CAR
+ indoor_outdoor: float
+ respiratory_rate: float
Figure 3: Class diagram showing core entities not repre-
sented in the database model.
sor data (e.g. PM1, NO
2
), x
d
(i, j) is the interpolated
data of sensor d (table set interpolation_M_D_P_R) in
the geographical location that corresponds to matrix
element (i, j), and L
d
is the maximum concentration
dose measured by sensor d considered to be health-
wise safe (e.g., the maximum PM10 value above
which human health is in jeopardise; attribute pollu-
tion_limit of class SensorData). Interpolated data are
computed using data that were aggregated using the
daily average and a resolution of 1000 m. The pollu-
tion value p(w) of road w is computed as:
p(w) = α
t
β
t
∑
(i, j)∈W
P
i, j
, (2)
where W is the set of matrix P indices that match the
geographical locations between the endpoints of road
w, α
t
is the indoor/outdoor ratio for the selected travel
medium t, and β
t
is the respiratory rate associated
with the travel medium t (e.g., car, foot). Variables
α
t
and β
t
correspond to attributes indoor_outdoor
and respiratory_rate of enumerator Travel. For each
OSRM profile, there is a corresponding enum Travel t.
Figure 5 shows how information flows between
processes and database tables. There is a script that
updates on a daily basis the matrix used by the sensor-
based OSRM profiles. Note that it uses table inter-
polation_M_D_P_R (see Section 2.3 and Figure 4).
The OSM region is updated on a weekly basis. This
triggers the update of the default OSRM graph data
(the OSRM tool chain) and the latitude and longitude
span of matrix P used in the other OSRM graph data.
The default OSRM profiles remain unchanged. There
is also an application that updates knowledge-based
OSRM graph data, which is discussed in the next sec-
tion. Finally, on operating system boot, all the OSRM
servers are launched which wait for connections from
the mobile application.
2.5 Knowledge Elicitation
During the course of the ExpoLIS project, we have
developed a tool that allows an environmental expert
to graphically represent pollution sources and diffu-
sion processes (Vital et al., 2021). The tool is capable
of generating a pollution map representing pollution
emitted by these sources. This map can be exported
as a matrix that can be used by OSRM. As illus-
trated in Figure 5, whenever the system administrator
runs the update knowledge based OSRM server script,
the knowledge-based data used by the corresponding
OSRM servers are updated.
Figure 6 shows an example of the knowledge elic-
itation tool. A single pollution source has been placed
in the centre of the map. In order to illustrate the ef-
fect of this pollution source, the matrix data generated
by the tool was introduced in the ExpoLIS informa-
tion system, and the corresponding routing data were
updated. Figure 7 shows two routes computed by our
system: one only takes into consideration road length,
while the other also considers pollution exposure.
2.6 Subscription Web Server
Scientists can use the web server to subscribe for
daily updates of sensor information. A periodic script
checks valid subscriptions, and whenever there are
new sensor data, it creates a CSV file and sends an
email (with a link to the CSV file) to the scientist .
ICINCO 2022 - 19th International Conference on Informatics in Control, Automation and Robotics
242
Public MQTT Broker
Sensor Node x
ExpoLIS information system
init scripts
MQTT Interface
measurement_properties measurement_data_D
hourly cron scripts
Manage
Subscriptions
Clean Old
Subscriptions
Output
Aggregate
Data
subscription data
aggregation_S_D_P_R interpolation_M_D_P_R
dayly cron scripts
Manage
Subscriptions
Interpolate
Data
Aggregate
Data
subscriptions
Figure 4: Information flow in the ExpoLIS information system.
ExpoLIS information system
OSM region
sensor based
matrix
sensor based
OSRM profiles
sensor based
OSRM graph data
default
OSRM profiles
default
OSRM graph data
daily cron scripts
Update OSRM
Data
interpolation_M_D_P_R
weekly cron scripts
Download OSM
Region
knowledge based
OSRM profiles
knowledge based
matrix
bin scripts
Update Knowledge
Based OSRM Server
knowledge based
OSRM graph data
init scripts
Launch OSRM
Servers
OSRM raster
config
Knowledge Based
OSRM Servers
Default
OSRM Servers
Sensor Based
OSRM Servers
compute
matrix
OSRM
tool chain
OSRM
tool chain
OSRM
tool chain
Citizen
Mobile App
OSM Regions Server
Figure 5: Information flow related to the ExpoLIS route planner.
Figure 6: An example of a pollution source created with the
knowledge elicitation tool (best seen in colour).
There is a deadline to download the CSV file, after
which the file is deleted to clear space in the ExpoLIS
disk server.
The web server also provides a search functional-
ity, where a scientist can choose a time period and a
selection of sensor data. A CSV file is created, again
with a deadline to be downloaded.
The web pages are updated whenever new sensor
data is added to the ExpoLIS information system and
it is flagged as subscribable.
2.7 Mobile App
One of the goals of the ExpoLIS project is to increase
citizen’s awareness. In (Teles et al., 2020) we have
presented a 3D game aimed at children that uses dif-
ferent visualisation techniques to present air pollution
data. The mobile app is aimed to an adult audience.
An Information System for Air Quality Monitoring using Mobile Sensor Networks
243

Figure 7: An example of the route planning ignoring (top
screenshot) and avoiding (bottom screenshot) pollution,
created by a user with the knowledge elicitation tool (best
seen in colour).
Its purpose is also to increase citizen’s awareness for
air pollution
5
. One of the consequences when devel-
oping this application is the need to commit to a set
of air pollution measures. In our case, we decided to
show temperature, humidity, CO, NO
2
, PM1, PM2.5,
and PM10 levels. If the attribute mobile_app_flag of
class SensorData is True, this causes the creation of
SQL functions that are used by the mobile app to dis-
play sensor data. This is also used to generate java
source code that runs on the mobile app to call these
SQL functions.
Figure 8 (left screenshot) shows the main screen
of the mobile app. It summarises, in the middle top,
sensor readings of currently selected sensor node us-
ing a combination of coloured graphs and simple val-
ues. We use Air Quality Index (AQI) colour coded
values
6
. In the middle bottom, there is a map showing
the latest known location of sensor nodes. The user
can select the map markers to view the corresponding
sensor node, or click the bus button on the bottom of
the screen. From the main screen the user can select,
the two left most buttons on the bottom of the screen
to view either a map or a plot with air pollution data.
The middle and right screenshots in Figure 8 show
examples of these functionalities. Screenshots of the
route planner functionality can be seen in Figure 7.
2.8 Sensor Node
The software that runs in the sensor node is responsi-
ble for querying the underlying sensor hardware and
5
The mobile app is available at http://github.com/
expolis-project/expolis-mobile-app.
6
https://www.airnow.gov/aqi/aqi-basics/.
sending the data to the public MQTT broker
7
. De-
tails about the sensor hardware are described else-
where (Santana et al., 2021).
The sensor node communicates with the
outside world through three MQTT topics:
expolis_project/sensor_nodes/sn_x used to
publish sensor data collected by sensor node number
x; expolis_project/sensor_nodes/images/sn_x
used to send images in case the sensor node
has an installed camera; expolis_project/
sensor_nodes/management/sn_x used to manage
the sensor node. The sensor node also has a private
MQTT broker used by ExpoLIS personnel to check
and debug a sensor node.
The sensor node is a Raspberry single board com-
puter running Linux. A daemon process periodically
pools the sensors, and publishes a MQTT message ev-
ery second containing the most recent sensor read-
ings. The content of the message is a text string
containing the sensor identification, message number,
timestamp and sensor values. Note that a sensor value
position in this text string must follow the specifica-
tion as represented by attribute mqtt_message_index
of class SensorData.
The daemon process also stores sensor readings
in a local (in the sensor node) CSV file. This is a
preventive measure to safeguard any data losses. Ad-
ditionally, the process keeps in memory values from
the last four hours. The message number forms a se-
quence. If the data server detects any missing mes-
sage numbers, it requests the corresponding data from
the sensor node.
As discussed in (Santana et al., 2021), the sen-
sor node uses a Kalman filter to compensate for out-
liers read by the PM sensors. The parameters of the
Kalman filter are also stored in the sensor database in
appropriate measurement_data_D tables.
3 DISCUSSION
In the previous sections we have described the engi-
neering solution for the software that forms the back-
bone of the ExpoLIS information system. We have
been using it with sensor nodes that are capable of
measuring temperature, humidity, pressure, CO, NO
2
,
PM1, PM2.5, and PM10. The current section high-
lights the major achievements of the current work and
shares its most relevant learned lessons.
One of the requirements was the ability to have a
heterogeneous mobile sensor network. This was ac-
7
The source code and instructions to install the sen-
sor node software are available at http://github.com/
expolis-project/expolis-sensor-node.
ICINCO 2022 - 19th International Conference on Informatics in Control, Automation and Robotics
244
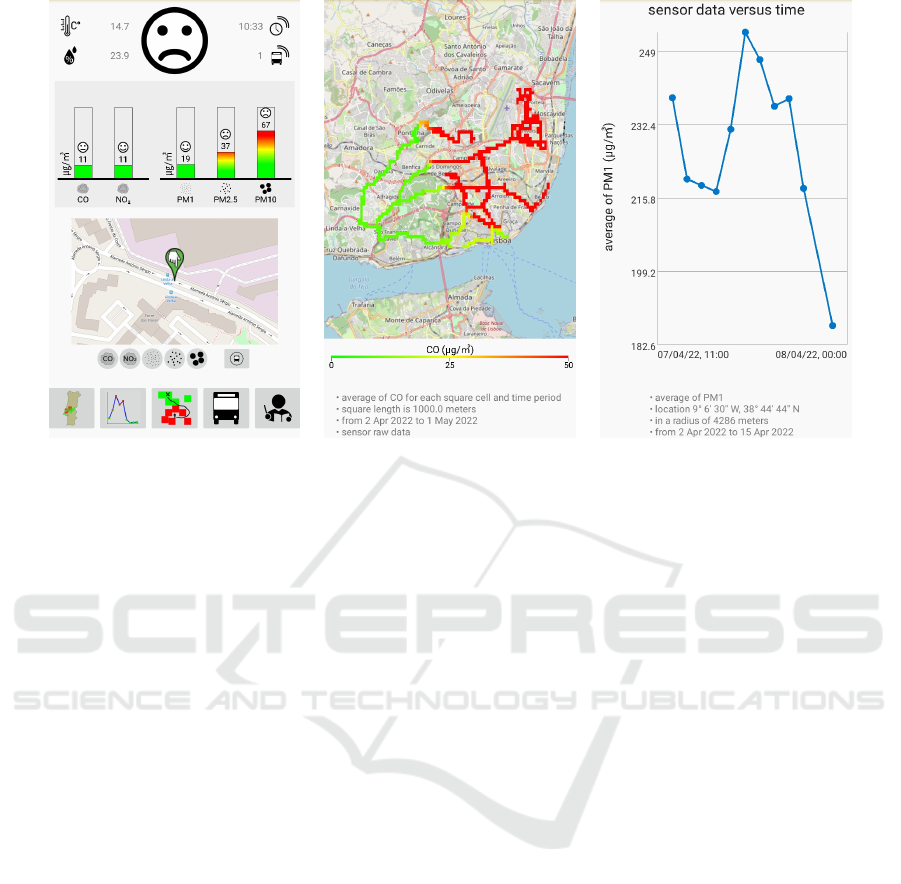
Figure 8: Screenshots of the mobile application. From left to right: online data, view map, and view plot.
complished by splitting sensor measurements in the
set of tables measurement_properties and measure-
ment_data_D. Common data collected by a sensor
data is stored in table measurement_properties while
data that depends on the hardware installed in a par-
ticular sensor node goes to the set of tables measure-
ment_data_D. While the initial goal of these tables
is to store physical quantities, they have been used to
also store parameters of the Kalman filter as described
in section 2.8. Since these parameters are not changed
very often, a better solution could be used in order to
save space on the database. A table that stores sensor
data processing parameters could be a solution.
Another possible usage of tables measure-
ment_data_D and class SensorData is to store syn-
thetic data. The knowledge elicitation tool presented
in Section 2.5 can be used by a virtual sensor node
combined with a pollution model to generate air qual-
ity readings whenever there are no available sensor
node hardware. Class SensorData can be extended
with an attribute that represents if sensor data are real
or synthetic. Moreover, we can compare readings
from real data and the pollution model to check for
accuracy.
The sensor node processes PM readings using a
Kalman filter. Both raw PM readings and PM filtered
data are stored in the database in corresponding mea-
surement_data_D tables. This means we are using
SensorData to represent filtered data. If we take into
account the possibility of having synthetic data, class
SensorData could have an attribute that specifies the
type or origin of data, an attribute whose possible val-
ues would be raw, synthetic, or processed. The lat-
ter would also work not only for filtered data using
a Kalman filter, but for data that are processed, be-
fore being analysed. As an example, the CO and NO
2
sensors output two reference values that have to be
processed to correct the CO or NO
2
measurements.
Associated to each SensorData object of processed
origin, would be a function that takes a stream of val-
ues from a sensor node at a given location and times-
tamp, and returns the sensor measure for that location
and timestamp.
Mobile sensor networks tend to produce data at
high rates. In our case we have chosen a sampling pe-
riod of one second. This tends to massively increase
the amount of data. This has led us to implement an
aggregation step. We aggregate data both spatially as
well as temporally. The choice of spatial and tem-
poral resolution depends on data usages. One of the
possible applications is to study the impact of urban
canyons on pollution dispersion. This means that spa-
tial resolution cannot be much bigger than road width,
otherwise we may risk having multiple roads in the
same aggregated grid. On the other hand, if tempo-
ral resolution is in the order of days, we may not ob-
serve cyclical patterns caused by rush hours that typ-
ically last about one to two hours. Of course having
fine grained resolution, means that we will generate
lots of data, specially in terms of interpolated data, as
we have to store a value for each grid cell that was
computed by the interpolation algorithm. This means
that we have to strike a balance between spatial and
temporal resolution. These considerations have led us
to choose the spatial and temporal resolutions men-
tioned in Section 2.4.
An Information System for Air Quality Monitoring using Mobile Sensor Networks
245

4 CONCLUSIONS
We have presented the software that forms the back-
bone of the ExpoLIS information system. We started
by listing the requirements and then proceeded with
the data model. The information system can handle a
heterogeneous mobile sensor network. We have also
presented a set of applications that use the collected
data. This has led us to select a set of air quality prop-
erties to be monitored and presented to users, either
from the general population or scientists interested
in studying and analysing air quality data. The core
database can be adapted to other geographical regions
and/or air quality measures. The data server scripts
can be easily configured to this goal. Future work has
been discussed in the previous section.
ACKNOWLEDGEMENTS
This work was supported by ExpoLIS project
(LISBOA-01-0145-FEDER-032088) funded by
FEDER, through Programa Operacional Regional
de Lisboa and national funds and FCT - Portuguese
Foundation for Science and Technology. Authors
also acknowledge the support of FCT through the
contract CEECIND/04228/2018 and the PhD grant
UI/BD/150996/2021.
REFERENCES
Becnel, T., Tingey, K., Whitaker, J., Sayahi, T., Lê, K.,
Goffin, P., Butterfield, A., Kelly, K., and Gaillardon,
P.-E. (2019). A distributed low-cost pollution mon-
itoring platform. IEEE Internet of Things Journal,
6(6):10738–10748.
Calbimonte, J.-P., Sarni, S., Eberle, J., and Aberer, K.
(2014). Xgsn: An open-source semantic sensing mid-
dleware for the web of things. In 7th International
Workshop on Semantic Sensor Networks SSN 2014, at
ISWC 2014, Riva del Garda, Italy.
Esquiagola, J., Manini, M., Aikawa, A., Yoshioka, L., and
Zuffo, M. (2018). Spiri: Low power iot solution for
monitoring indoor air quality. In Proceedings of the
3rd International Conference on Internet of Things,
Big Data and Security - IoTBDS, pages 285–290. IN-
STICC, SciTePress.
Hasenfratz, D., Saukh, O., Walser, C., Hueglin, C., Fierz,
M., Arn, T., Beutel, J., and Thiele, L. (2015). De-
riving high-resolution urban air pollution maps using
mobile sensor nodes. Pervasive and Mobile Comput-
ing, 16:268–285. Selected Papers from the Twelfth
Annual IEEE International Conference on Pervasive
Computing and Communications (PerCom 2014).
Kersting, J., Geierhos, M., Jung, H., and Kim, T. (2017).
Internet of things architecture for handling stream air
pollution data. In Proceedings of the 2nd International
Conference on Internet of Things, Big Data and Secu-
rity - IoTBDS, pages 117–124. INSTICC, SciTePress.
Kuuluvainen, H., Rönkkö, T., Järvinen, A., Saari, S., Kar-
jalainen, P., Lähde, T., Pirjola, L., Niemi, J. V.,
Hillamo, R., and Keskinen, J. (2016). Lung deposited
surface area size distributions of particulate matter
in different urban areas. Atmospheric Environment,
136:105–113.
Lin, Y.-C., Chi, W.-J., and Lin, Y.-Q. (2020). The im-
provement of spatial-temporal resolution of PM2.5
estimation based on micro-air quality sensors by us-
ing data fusion technique. Environment International,
134:105305.
Luxen, D. and Vetter, C. (2011). Real-time routing with
openstreetmap data. In Proceedings of the 19th ACM
SIGSPATIAL International Conference on Advances
in Geographic Information Systems, GIS ’11, pages
513–516, New York, NY, USA. Association for Com-
puting Machinery.
Maag, B., Hasenfratz, D., Saukh, O., Zhou, Z., Walser, C.,
Beutel, J., and Thiele, L. (2018). Ultrafine Particle
Dataset Collected by the OpenSense Zurich Mobile
Sensor Network.
Mariano, P., Almeida, S. M., and Santana, P. (2021). On the
automated learning of air pollution prediction models
from data collected by mobile sensor networks. En-
ergy Sources, Part A: Recovery, Utilization, and Envi-
ronmental Effects, 0(0):1–17.
MQTT (2019). MQTT Version 5.0. OASIS Standard.
https://docs.oasis-open.org/mqtt/mqtt/v5.0/os/mqtt-
v5.0-os.html. Latest version: https://docs.oasis-
open.org/mqtt/mqtt/v5.0/mqtt-v5.0.html.
Radanovic, G. and Faltings, B. (2015). Incentive schemes
for participatory sensing. In 14th International Con-
ference on Autonomous Agents and Multiagent Sys-
tems, Istanbul, Turkey.
Santana, P., Almeida, A., Mariano, P., Correia, C., Martins,
V., and Almeida, S. M. (2021). Air quality mapping
and visualisation: An affordable solution based on a
vehicle-mounted sensor network. Journal of Cleaner
Production, 315:128194.
Teles, B., Mariano, P., and Santana, P. (2020). Game-like
3d visualisation of air quality data. Multimodal Tech-
nologies and Interaction, 4(3).
Vital, D., Mariano, P., Santana, P., and Almeida, S. M.
(2021). A graphical tool for eliciting knowledge of
air pollution sources. In International Conference on
Graphics and Interaction – ICGI’2021.
Weissert, L., Alberti, K., Miles, E., Miskell, G., Feenstra,
B., Henshaw, G. S., Papapostolou, V., Patel, H., Poli-
dori, A., Salmond, J. A., and Williams, D. E. (2020).
Low-cost sensor networks and land-use regression:
Interpolating nitrogen dioxide concentration at high
temporal and spatial resolution in southern california.
Atmospheric Environment, 223:117287.
ICINCO 2022 - 19th International Conference on Informatics in Control, Automation and Robotics
246
