
Investigation the Influence of Marketing-mix Efforts on Brand Equity in
the Bangladesh Software Industry
Md. Tarek Hasan
1 a
, Mohasina Akter
1
, Sakib Islam Shuhrid
1
, Tanvir Ahmed Khan
1
, Farzana Sadia
2
and Mahady Hasan
1 b
1
Department of Computer Science & Engineering, Independent University, Dhaka, Bangladesh
2
Department of Computer Science & Engineering, Daffodil International University, Dhaka, Bangladesh
Keywords:
Dimension of Brand Equity, Marketing-mix Efforts, Brand Equity, Software Branding.
Abstract:
Brand equity is a vital metric for measuring a brand’s health, and monitoring it on a regular basis is an im-
portant part of efficient brand management. An already developed model is being used to examine the rela-
tionships among marketing-mix efforts (channel/place, price, promotion, and after-sales service), and three
dimensions of brand equity (brand awareness, perceived quality, and brand loyalty). The goal of our research
was to see how the marketing mix (pricing, product, place, promotion) and after-sales services affected three
aspects of brand equity. The model is tested in the context of the Bangladesh software sector. The study
focused more on the hypothesis that checks Bangladesh’s software industry perspective. It’s a descriptive
survey in which the necessary information was gathered through a questionnaire. 70 responses were selected
as sample data to analyze. The correlations between research variables have been investigated utilizing SPSS
(correlation and regression) and Amos software. Structural equation modeling is used to test the model and
research hypotheses. Cronbach’s alpha was used to confirm reliability. Perceived quality is placed as a me-
diator between the marketing mix efforts and brand equity. The results show that few of the marketing-mix
efforts and threedimensions of brand equity have significant relationships with brand equity.
1 INTRODUCTION
Brand value as gotten from the data plans may be rep-
resented by a lot of viewpoints. These angles inte-
grate brand care, brand affiliations, product quality,
and brand commitment (Aaker, 1996). Six compo-
nents of brand esteem proposes, which are organized
into four moderate levels: striking nature at the base
level, execution and image at a higher level, judgment
and feeling at the second-to-undeniable level, and res-
onation at the significant level (Keller, 2008). As de-
picted in that phrase, customer choice is heavily influ-
enced by brand esteem, and thus those in purchaser
markets are acutely aware of the need to appropri-
ately direct brand esteem (Aaker, 1991, 1996; Keller,
2008). Of course, brand esteem is fairly downplayed
in business markets due to a couple of specific pieces
of the business market exchange (Webster and Keller,
2004). The data structures of brand care and con-
stancy increases the value, buyers get from the prod-
a
https://orcid.org/0000-0002-3777-2229
b
https://orcid.org/0000-0002-9037-0181
uct by influencing their thinking, feelings, and actions
concerning the product. Thus, the product is of more
value when it is set apart than unbranded, and this
more vital worth is implied as brand esteem (Aaker,
1991, 1996). Whenever the brand value of a prod-
uct is adequately high, target buyers act decidedly to-
wards the product.
A stronger brand reputation would elicit more
confirmation of superior quality (Cretu & Brodie,
2007). For sure, even in an essentially earlier pe-
riod, for example, it was once commonly referred to:
”Purchase bosses favor IBM PCs to unbranded, high-
quality different choices.” A strong brand helps sellers
maintain their control over the social exchange with
buyers. For example, Intel really shipped off the ”In-
tel Inside” campaign, which presented to Intel a more
prominent measure of such control. Overall, brand
esteem contributes to a more grounded buyer-seller
relationship, and a more grounded relationship leads
to higher brand esteem.
Three brand-material examinations itemized were
conducted before 1990 (Cretu & Brodie, 2007).
These three examinations are based mainly on is-
152
Hasan, M., Akter, M., Shuhrid, S., Khan, T., Sadia, F. and Hasan, M.
Investigation the Influence of Marketing-mix Efforts on Brand Equity in the Bangladesh Software Industry.
DOI: 10.5220/0011337300003280
In Proceedings of the 19th International Conference on Smart Business Technologies (ICSBT 2022), pages 152-159
ISBN: 978-989-758-587-6; ISSN: 2184-772X
Copyright
c
2022 by SCITEPRESS – Science and Technology Publications, Lda. All rights reserved

sues, including the brand-naming part and its impact
on promoting practices like arranging and headway.
They don’t totally ponder the key factors that concern
(1) the traits of brand esteem in business market set-
ting, (2) promoting mix attempts, and (3) market exe-
cution.
This basic association model is definitely huge be-
cause it helps firms with understanding which dis-
plays they should embrace to foster the parts of brand
esteem that add to their market power and hence grow
their financial show. The fundamental associations
model is deeply rooted in purchaser advancing, and
data conveyed from this model is critical for compre-
hending how brand esteem is created and what it im-
plies for market execution in business markets (Yoo
and Donthu, 2001).
Among these viewpoints, three are particularly
significant. Regardless, it is often perceived that
the occupation of corporate image is greater in cur-
rent display than in customer promotion (Webster and
Keller, 2004).
2 LITERATURE REVIEW
In research study, few authors attempted to identify
beneficial determinants of consumer loyalty and se-
lection (Kavosh and Asadi, 2014). Based on the the-
ories of Baldinger and Robinson author investigated
the impact of brand image on consumer loyalty and
perceptions of public relations (Kavosh and Asadi,
2014). Customers’ risk avoidance and brand loyalty
were investigated by few authors to looked at online
purchase brand enhancement (Nakhaei, 2013). An-
other author looked at the impact of brand image on
the relationship between public perception and cus-
tomer loyalty (Aulia & Briliana, 2017). The author
from Iran, investigated the impact of brand equity on
achieving loyal clients in the food machine industry
(Sokachaee, & Babaei, 2014).
Different approaches, such as company-oriented
and customer-oriented, result in varied notions of
brand equity (Fayrene & Lee, 2011). Customer-based
Brand Equity (CBBE) is defined as the evaluation of
a customer’s perception toward a certain brand based
on customer knowledge, awareness, and associations
with respect to the brand (Tong & Hawley, 2009).
Customer-based Brand Equity has been proven as
a complicated concept with multiple dimensions (Yoo
& Donthu, 2001). Numerous studies have been con-
ducted to measure the idea of customer-based brand
equity as part of the broad literature review.
(1) Brand Awareness, (2) Brand Association, (3)
Brand Loyalty, (4) Perceived Quality, and (5) other
proprietary brand assets (e.g., patents, trademarks,
and channel partnerships) as the five dimensions to
measure the idea (Aaker, 1991). Other author created
and validated a multi-dimensional scale composed of
three dimensions of brand equity in empirical inves-
tigations of developing customer-based brand equity
(Yoo & Donthu, 2001).
Brand equity is viewed as a multidimensional no-
tion in the literature (Aaker, 1991). Author consid-
ers brand awareness and brand image to be separate
dimensions of brand equity, with more brand aware-
ness and a more positive image resulting in higher
brand equity. These factors have a beneficial impact
on brand equity (Keller, 1998).
In general, the higher the brand awareness and the
more positive the brand image of a service brand, the
higher the brand equity, higher prices boost brand eq-
uity, with perceived brand quality acting as a mediator
(Yoo, Donthu, & Lee, 2000). Advertising is an impor-
tant part of the marketing mix that may be utilized to
effectively raise brand awareness (Keller, 1998; Yoo,
Donthu, & Lee, 2000).
Despite the short-term financial gains generated
by increased sales, price bargains tend to reduce brand
equity (Yoo, Donthu, & Lee, 2000). Consumers’ per-
ceptions of brands are negatively influenced by price
deals before they even test out the goods. Consumer
interactions with a service provider have a direct im-
pact on the development of the service brand image,
which affects brand equity (Berry, 2000). As a result,
the service delivery process has an impact on the es-
tablishment of the service brand image, which in turn
has an impact on brand equity, resulting in increased
brand equity. This study show where hypotheses are
acting correctly, and our research will verify it in our
market place.
3 RESEARCH MODEL &
HYPOTHESIS
3.1 Research Model
This study investigates the effects of brand awareness,
perceived quality, and brand loyalty on brand equity.
This model (Fig:1) also shows the relationship with
place/channel, price, promotion, and after-sales ser-
vices. This model is based on Aaker (1996), and Yoo
and Donthu (2001). In this model, the marketing mix
affects brand equity directly or indirectly. Also, the
three dimensions affect the overall brand equity. In
the model, brand awareness affects perceived qual-
ity and brand loyalty. Also, perceived quality affects
Investigation the Influence of Marketing-mix Efforts on Brand Equity in the Bangladesh Software Industry
153
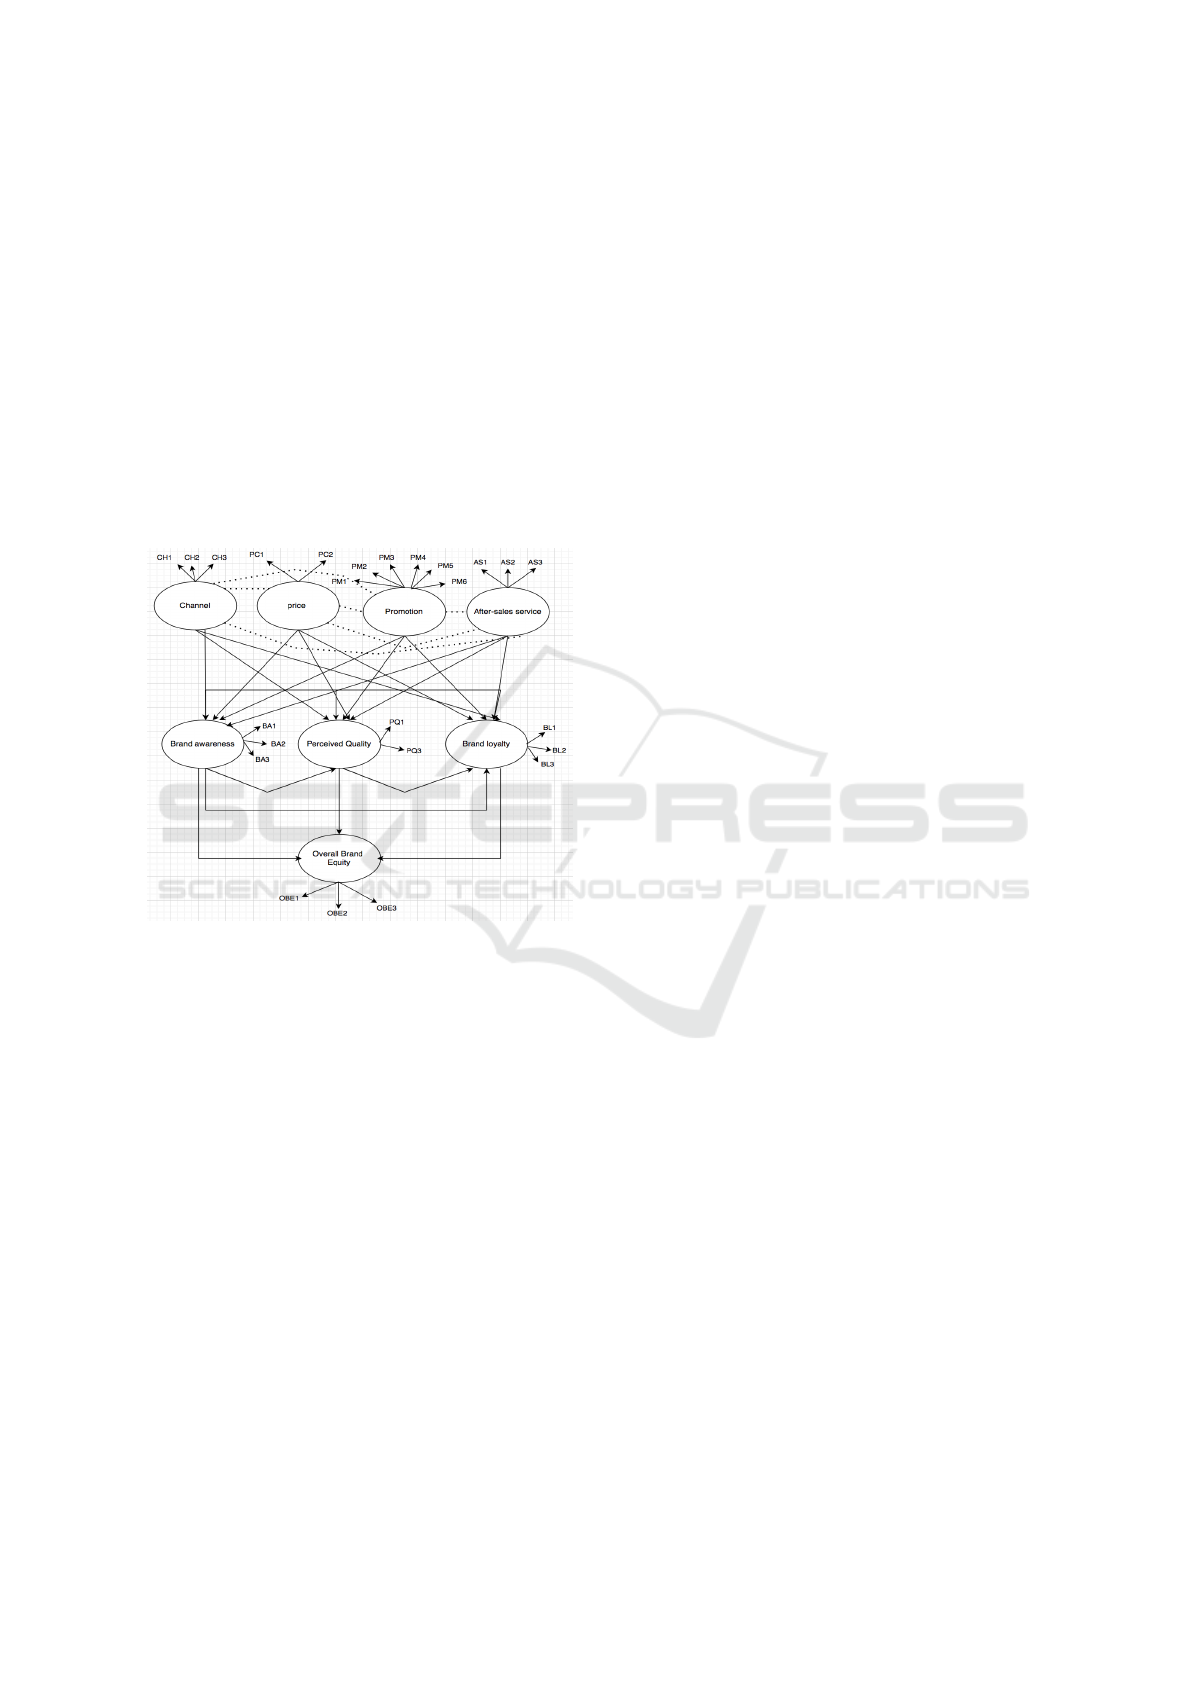
brand loyalty. In Figure 1, the author actually ob-
serves each criteria of the over-all brand equity. To
begin, Figure 1 shows how each marketing mix is in-
directly linked to the others, with the author taking
into account three channel/place attributes, two price
attributes, six promotion attributes, and three after-
sales service attributes. Then there are the three el-
ements of brand equity, which are inextricably linked
to one another and to marketing mix activities. From
then, three brand awareness attributes, two perceived
quality attributes, and three brand loyalty attributes
were taken into account. The three dimensions of
brand equity have a direct relationship with overall
brand equity, which influences the three brand equity
qualities.
Figure 1: Conceptual Model.
3.2 Brand Equity
A brand is an important part of any product. It is a
bridge between customer and company. When com-
pared to a generic alternative, brand equity refers to a
value premium that a company generates from a prod-
uct with a distinctive name. Brand equity’s perceptual
and behavioral components are important aspects of
branding that have been extensively addressed in the
marketing domain (Foroudi, Pantea, 2018). Brand eq-
uity has a great impact on customer satisfaction. As
a result of a customer’s interactions with the brand,
brand equity develops and grows. For a company that
has positive brand equity, consumers are willing to
pay more for the product. A set of dimensions can be
used to describe brand equity derived from a knowl-
edge model. These models include brand awareness,
brand associations, perceived quality, and brand loy-
alty (Aaker, 1996).
3.3 Brand Awareness
Brand awareness refers to how well your target au-
dience recognizes and is familiar with your brand.
Brands with a high level of brand awareness are re-
ferred to as ’trending,’ ’buzzworthy,’ or simply ’pop-
ular.’ A potential buyer’s capacity to recognize and
remember that a brand belongs to a specific commod-
ity class is known as brand awareness (Aaker, 1996).
Brand awareness is a tool for measuring the marketing
and advertising of a product. Brand awareness is im-
portant for the following: promotes trust, establishes
associations, builds brand equity
3.4 Perceive Quality
Basically, perceived quality is customers’ thoughts or
judgments of any product. What does one think of the
product or the services that the company provides?
It can also be interpreted as a general appraisal of a
brand’s desirability or superiority (Aaker, 1996). Per-
ceived quality is based on brand loyalty, and higher
levels of perceived quality can boost brand loyalty. In
truth, perceived quality is the customer’s mental ap-
praisal of a product or service, which provides value
to customers and gives them a reason to buy by dis-
tinguishing a brand from its competitors (Shamami,
Roya, and Bahram 2019).
3.5 Brand Loyalty
Brand loyalty is one of the major elements of brand
equity. Consumers’ positive associations with a prod-
uct or brand are referred to as ”brand loyalty.” Be-
cause loyal customers to a brand require fewer promo-
tional activities than other customers, they are will-
ing to pay more for the benefits and quality of their
favorite brand and are willing to stand up to sit-
uational factors and competitors’ marketing efforts,
even though there may be logically other alternatives
(Shamami, Roya, and Bahram 2019).
3.6 Marketing-mix
As a feature of a complete promoting plan, a show-
casing blend envelops various areas of focus. The
client value approach isn’t distinct from the showcas-
ing blend’s essential ideas, including item, cost, place,
advancement, individuals, process, and actual proof
(Munawar, Mohamed, Yusliza, Saputra, Muhammad,
Bon, 2021). Among those reviews that we have done,
they are mostly centered around brand value and pro-
moting blends. In a business, everything must be ar-
ranged and planned. This is done to gain an advantage
ICSBT 2022 - 19th International Conference on Smart Business Technologies
154

over the opposing organizations. A novel market-
ing mix is a unique combination of individual selling,
traditional publicizing, exposure, deal advancement,
online entertainment, and additionally captivating the
part of internet business to energize the target market
to purchase a decent item. At times, this is alluded to
as the special blend too. The main component in the
promotion blend is the item.
3.7 Price
Price is one of the significant components of promot-
ing blend, which builds the benefits as well as ex-
pands the pieces of the pie. It influences organizations
directly or by implication. Price encompasses both
monetary and non-monetary charges that customers
incurring exchange for the benefits of a product (ad-
ministration) and includes both monetary and non-
monetary uses (Shamami, Roya, and Bahram 2019).
The deal cost of the item will reflect what is required
by the buyers. That is the thing they will pay for.
Solely after realizing the base expense, the selling
cost can be fixed. The following terms can be used to
estimate price: cost-plus, esteem basis, competition,
input size, discount, physical, and so on (Beyene,
Birhanu, 2018). As per the discoveries of another re-
view, valuing is an aberrant benchmark of item quality
for clients. This suggests that an item’s cost is con-
nected with its quality in a good manner (Shamami,
Roya, and Bahram 2019).
3.8 Promotion
Promotion is another major element of marketing-
mix. The marketing mix’s promotion is a technique
that aids in the dissemination of information, encour-
ages purchase, and influences the buying decision
process (Beyene, Birhanu, 2018). A firm’s whole pro-
motion mix is a unique blend of promotional activ-
ities, public relations, individual sales, sales promo-
tion, and marketing that the company uses to com-
municate product value to customers and build ef-
fective relationships with them (Shamami, Roya, and
Bahram 2019). A customer may be informed about a
firm, a specific product, or another marketing mix in-
gredient, such as a cheap price during summer sales,
through a promotion. Personal selling, advertising,
publicity or public relations, and sales promotion are
all examples of different types of promotion (Beyene,
Birhanu, 2018).
3.9 Place
In the marketing mix, the process of moving products
from the producer to the intended user is called place.
It also entails where the product is stored and man-
ufactured. According to different research it shows
that Place plays a big role in Brand Equity (Kim, Ji-
Hern, and Yong J. Hyun, 2011). Because many of
the actions mentioned occur within the distribution
functions of marketing, the Place is sometimes known
as the distribution Place. Order processing, cover-
age, and delivery are proven to be crucial for creating
brand equity in industrial marketing (Kim, Ji-Hern,
and Yong J. Hyun, 2011).
3.10 After Sales Service
An After-Sales Service is a kind of service that
is given after purchasing any product. A store,
a manufacturer, or a third-party customer service
or training provider may provide after-sales assis-
tance.According to a review of the literature on after-
sales service, there are five aspects that are critical
to customer expectations of acceptable service levels.
Parts availability, warranty and (insurance) full cover-
age, technical support, pricing policies, and technical
help are among the five aspects. After-sales service
is one of the most important aspects of developing
a brand in the automotive business (Shamami, Roya,
and Bahram 2019).
3.11 Hypothesis
A hypothesis is utilized to decide the connection be-
tween two factors, which are the two things that are
being tried. One variable is free and is responsible for
any progressions in the outcome. The used hypothe-
ses are significant in controlled tests since they assist
with outlining the plan of the trial and the normal out-
comes. Theories are a significant device for making
logical reasoning and organizing tests in an unmistak-
able manner that considers solid information that can
be utilized to illuminate further trials.
For the present study the following hypothesis are
drawn from the Aaker model:
Investigation the Influence of Marketing-mix Efforts on Brand Equity in the Bangladesh Software Industry
155
Relationships between Marketing Activities and
Brand Equity Dimensions
Relationships between Brand Equity Dimensions
and Overall Brand Equity Value
4 METHOD
4.1 Market Context
The Aaker model is tested in the context of
a Bangladesh software company where small-to-
midsize firms purchase customized software for their
custom needs from software service providers. It
is common that they lack the resources to maintain
and update the purchased IT software, and thus soft-
ware companies take on the responsibility for the re-
lated service and customization. Many companies
set up their own customized solution packages (e.g.,
software programs for CRM, channel management,
timesheet, accounting, credit card payment, ecom-
merce, management software, and ERP) according to
customer needs (Kim, Ji-Hern, and Yong J. Hyun,
2011). They also provide support services, such as
recovering broken software systems and installing
freshly available application packages (Kim, Ji-Hern,
and Yong J. Hyun, 2011). The entire software indus-
try’s promotional spending could not be accurately
estimated (Kim, Ji-Hern, and Yong J. Hyun, 2011).
Salesperson promotion and above-the-line advertising
are two of the most common types of these actions
(Kim, Ji-Hern, and Yong J. Hyun, 2011).
4.2 Sampling and Data Collection
A software engineer for a Bangladeshi software com-
pany prepared a list of the software purchasing com-
panies. This list of all the listed companies (who
provide services and sell software) was delivered to
the purchasing committee of the end-user companies
from where the responses have been collected. All the
responses from the list were considered. Respondents
were those who participated in the process of pur-
chasing any IT software. A survey form was shared
to gather data from the Bangladeshi market as men-
tioned above. The response size is 73. Elimination
of incomplete responses leaves 70 eligible for analy-
sis. Respondents were used for more than one year
in their department and were distributed across var-
ious products. More than 80 percent of the respon-
dents belonged to companies that had more than 20
employees. During the survey, the author adheres
to confidentiality and informed consent. The survey
questions maintain order randomization, so the results
are never shown to the respondent. A confidential re-
search survey was carried out.
4.3 Questionnaire
The questionnaire is organized as follows: First, after
a short introduction, respondents are requested to an-
swer questions about their connection and role with
the product. Then, 3 dimensions of brand equity, the
overall value of brand equity, and marketing-mix ef-
forts are measured. All items are measured on the
7-point Likert scale with anchors of 1 = strongly dis-
agree and 7 = strongly agree. Finally, questions about
demographics are asked.
5 RESULT
5.1 Measurement Model
To test convergent and discriminant validity, the
model’s constructs are compared to one another in
pairs (Kim, Ji-Hern, and Yong J. Hyun, 2011). We use
AMOS to perform confirmatory factor analysis (CFA)
on a measurement model that includes four exoge-
nous components (marketing-mix efforts), three en-
dogenous constructs (brand equity dimensions), and
total brand value (Kim, Ji-Hern, and Yong J. Hyun,
2011).
ICSBT 2022 - 19th International Conference on Smart Business Technologies
156
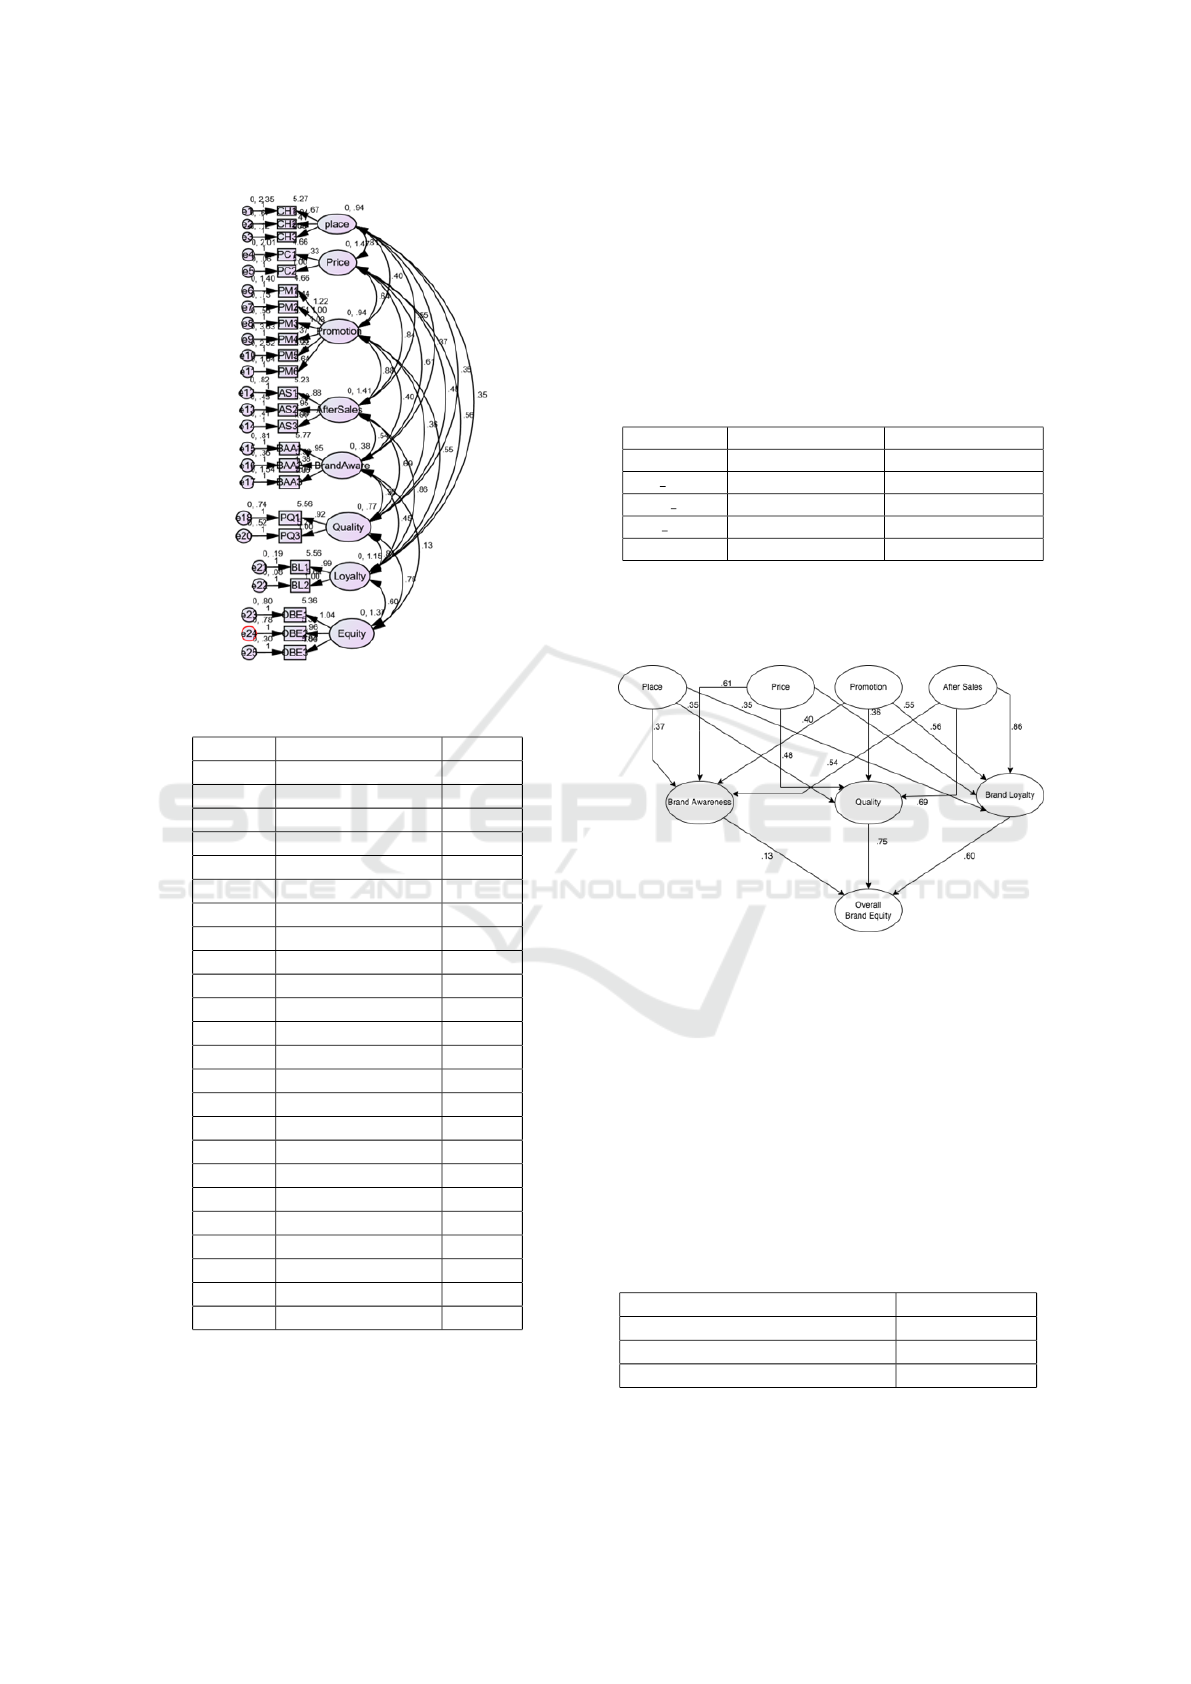
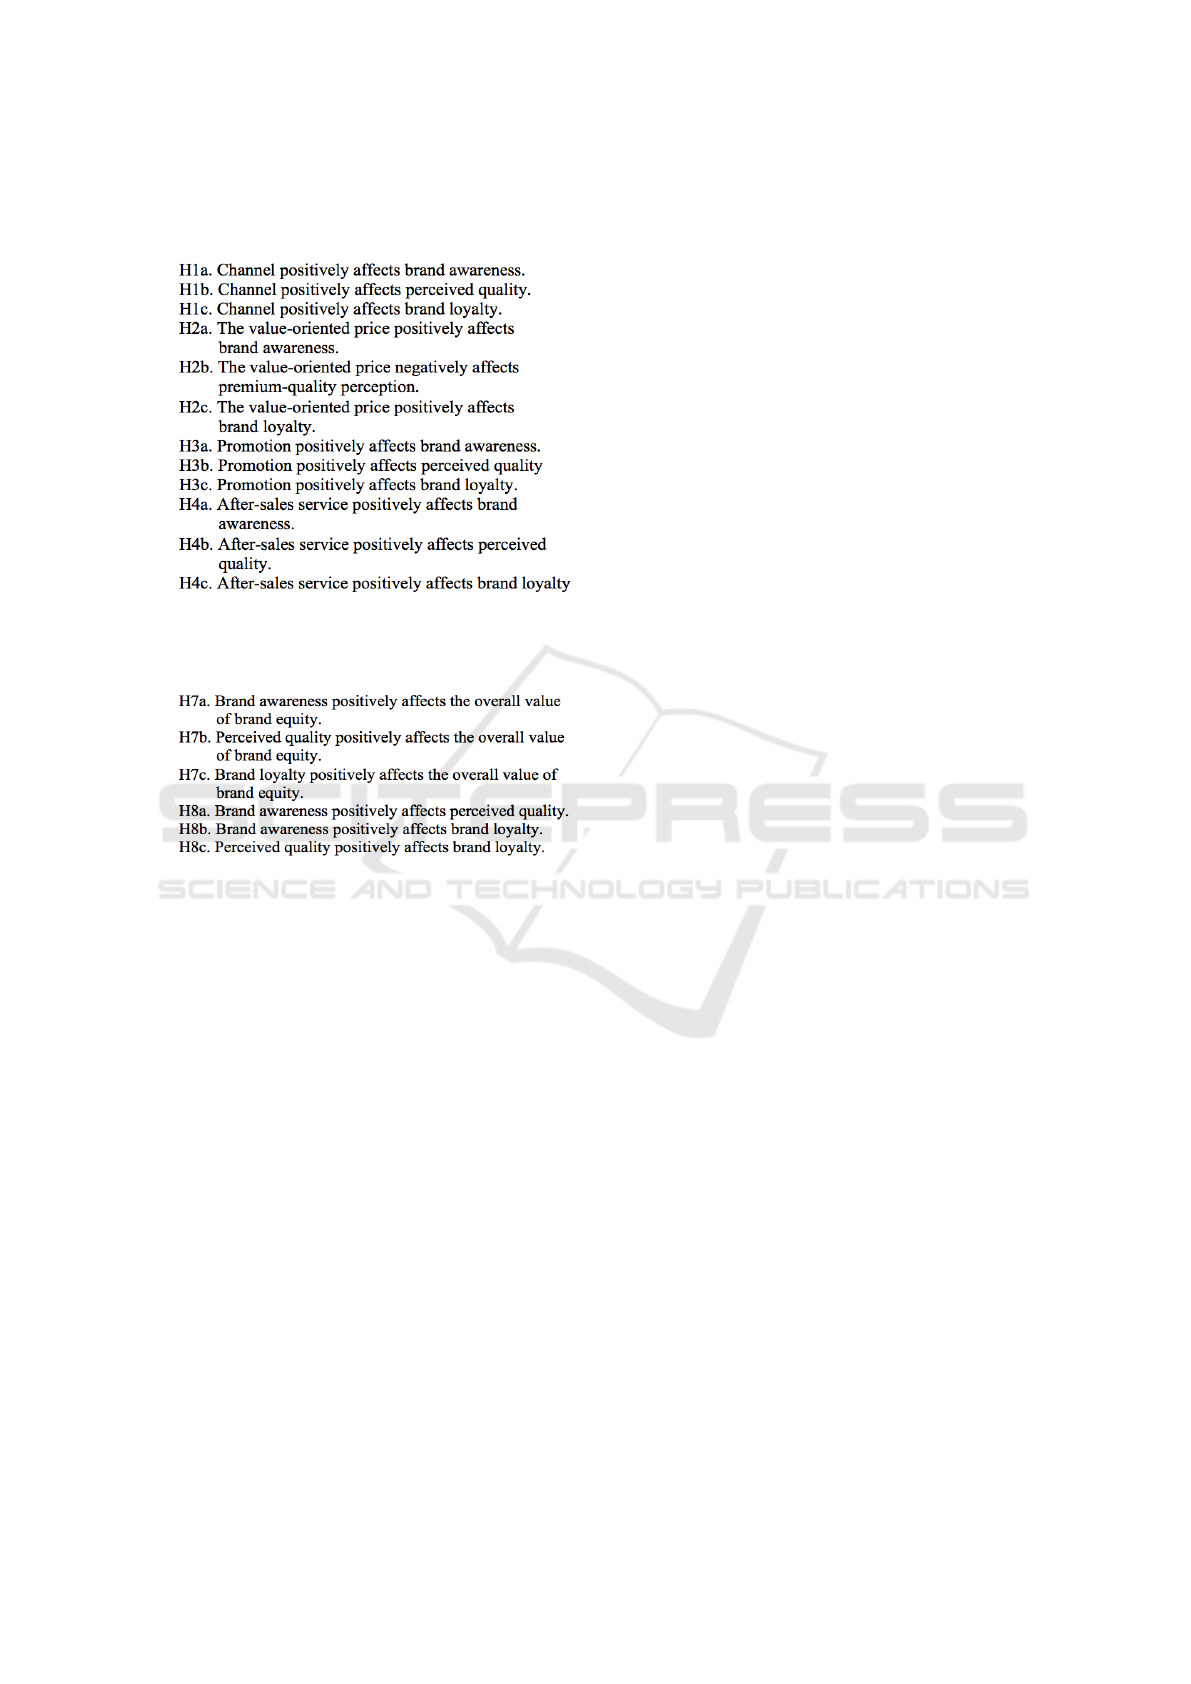
Figure 2: Result.
Table 1: Operational measures and scale reliability values.
Efforts Standard loading t-value
CH1: 0.712 5.27
CH2: 0.806 6.04
CH3: 0.840 5.96
PC1: 0.790 4.66
PC2: 0.909 5.41
PM1: 0.710 4.66
PM2: 0.738 5.44
PM3: 0.838 5.51
PM4: 0.757 4.56
PM5: 0.805 5.22
PM6: 0.788 5.64
AS1: 0.794 5.22
AS2: 0.861 5.29
AS3: 0.813 5.38
BAA1: 0.699 5.77
BAA2: 0.855 5.56
BAA3: 0.804 5.74
PQ1: 0.792 5.56
PQ2: 0.808 5.27
BL1: 0.906 5.56
BL2: 0.906 5.62
OBE1: 0.788 5.36
OBE2: 0.844 5.32
OBE3: 0.870 5.84
Acceptable goodness-of-fit is measured. To im-
prove convergent validity, two items for perceived
quality and one item for brand loyalty with corpo-
rate image are removed. With the remaining items,
we conduct CFA (Kim, Ji-Hern, and Yong J. Hyun,
2011). The goodness-of-fit statistics are acceptable,
and all coefficients are statistically significant (p >
0.05) (Kim, Ji-Hern, and Yong J. Hyun, 2011).
The response size is 70 and the used model is re-
cursive in AMOS. Total Number of variables in the
model is 56 where 32 are observed variables and 24
are unobserved variables.
Table 2: Results of hypotheses testing.
– Saturated Model Estimated Model
SRMR 0.123 0.126
d ULS 4.551 4.767
d G 1.720 1.832
Chi square 596.439 609.331
NFI 0.566 0.556
Number of distinct sample moments: 324,
Number of distinct parameters to be estimated: 96,
Degrees of freedom (324 - 96): 228
Figure 3: Results of the structural equation modeling.
5.2 Structural Model
The AMOS constructs of marketing-mix efforts are
defined as exogenous constructions in the structural
equations model Equity (Kim, Ji-Hern, and Yong J.
Hyun, 2011). The three endogenous constructions
(i.e. three dimensions of brand equity) are related to
the overall value of brand equity, and the exogenous
constructs are related to them. The goodness-of-fit
statistics are acceptable or not. The results of the test
are presented in the following table:
Table 3: Results of hypotheses testing.
Relationships between Activities
H1a, H1c, H3a, H7b, H8a Supported
H1b, H2a, H2b, H2c, H3b, H3c Not Supported
H4a, H4b, H4c, H7a, H7c, H8b Not Supported
Investigation the Influence of Marketing-mix Efforts on Brand Equity in the Bangladesh Software Industry
157
5.3 Hypotheses Acceptance
Relationships between Marketing-mix Efforts and
Brand Equity Dimensions
H1a and H1c are accepted where others are not ac-
cepted by the survey. After-sales service should pos-
itively affect brand equity dimensions. Channel per-
formance and promotion are the most influential, fol-
lowed by after-sales service. Promotion positively af-
fects the perceived quality (H3a)
Relationships among Brand Equity Dimensions
and Overall Value of Brand Equity
The relationship between perceived quality and brand
loyalty is significant, as expected (H8c). However,
H8a and H8b are not accepted. Perceived quality has
an impact on brand equity. The relationships between
the overall value of brand equity and the three di-
mensions of brand equity are not all positive and sig-
nificant (H7b and H8c). Surprisingly, brand aware-
ness has no significant impact on overall brand equity
value.
5.4 Summary of Key Findings
Five findings are noteworthy. First, channels are
found to play a pivotal role in the process of brand
awareness development. Prior research reveals that
place contributes more to brand equity in business
markets than in consumer markets. In the estimated
model, channel performance, promotion, and after-
sales service impact perceived quality indirectly. Sec-
ond, the place of IT software is an integrative part of
the product brand loyalty. The estimated model shows
that promotion has a strong impact on brand aware-
ness, whereas it does not significantly affect brand
loyalty. Third, brand awareness is strongly affected
by the value of promotion while it does not relate to
the other two brand equity dimensions of perceived
quality and brand loyalty. On the other hand, per-
ceived quality positively relates to brand awareness.
The finding would imply that perceived quality con-
tributes to the overall value of brand equity in a very
different manner as compared to the other two dimen-
sions.
6 DISCUSSION
Brand equity can be built through the marketing mix.
This study emphasizes a different marketing mix,
which has a huge impact on brand equity in the con-
text of the software industry in Bangladesh. Brand eq-
uity is a factor that influences customer lifetime value
(Huang, Yao, Liu, & Xie, 2020). From the model
that we have created, we have got some hypotheses
that show brand equity has various impacts (positive
or negative) on the marketing mix efforts. Also, in
the result analysis part, we analyze our hypothesis
to see if it is correct or not. In this model, author
get some characteristics of industrial marketing based
on software firms. Author studied several research
papers based on marketing-mix efforts on brand eq-
uity. But author didn’t find any reports based on the
Bangladeshi context. So, the purpose of this study is
to determine the impact of marketing mix variables
and three dimension of brand equity on brand equity
based on the Bangladeshi context.
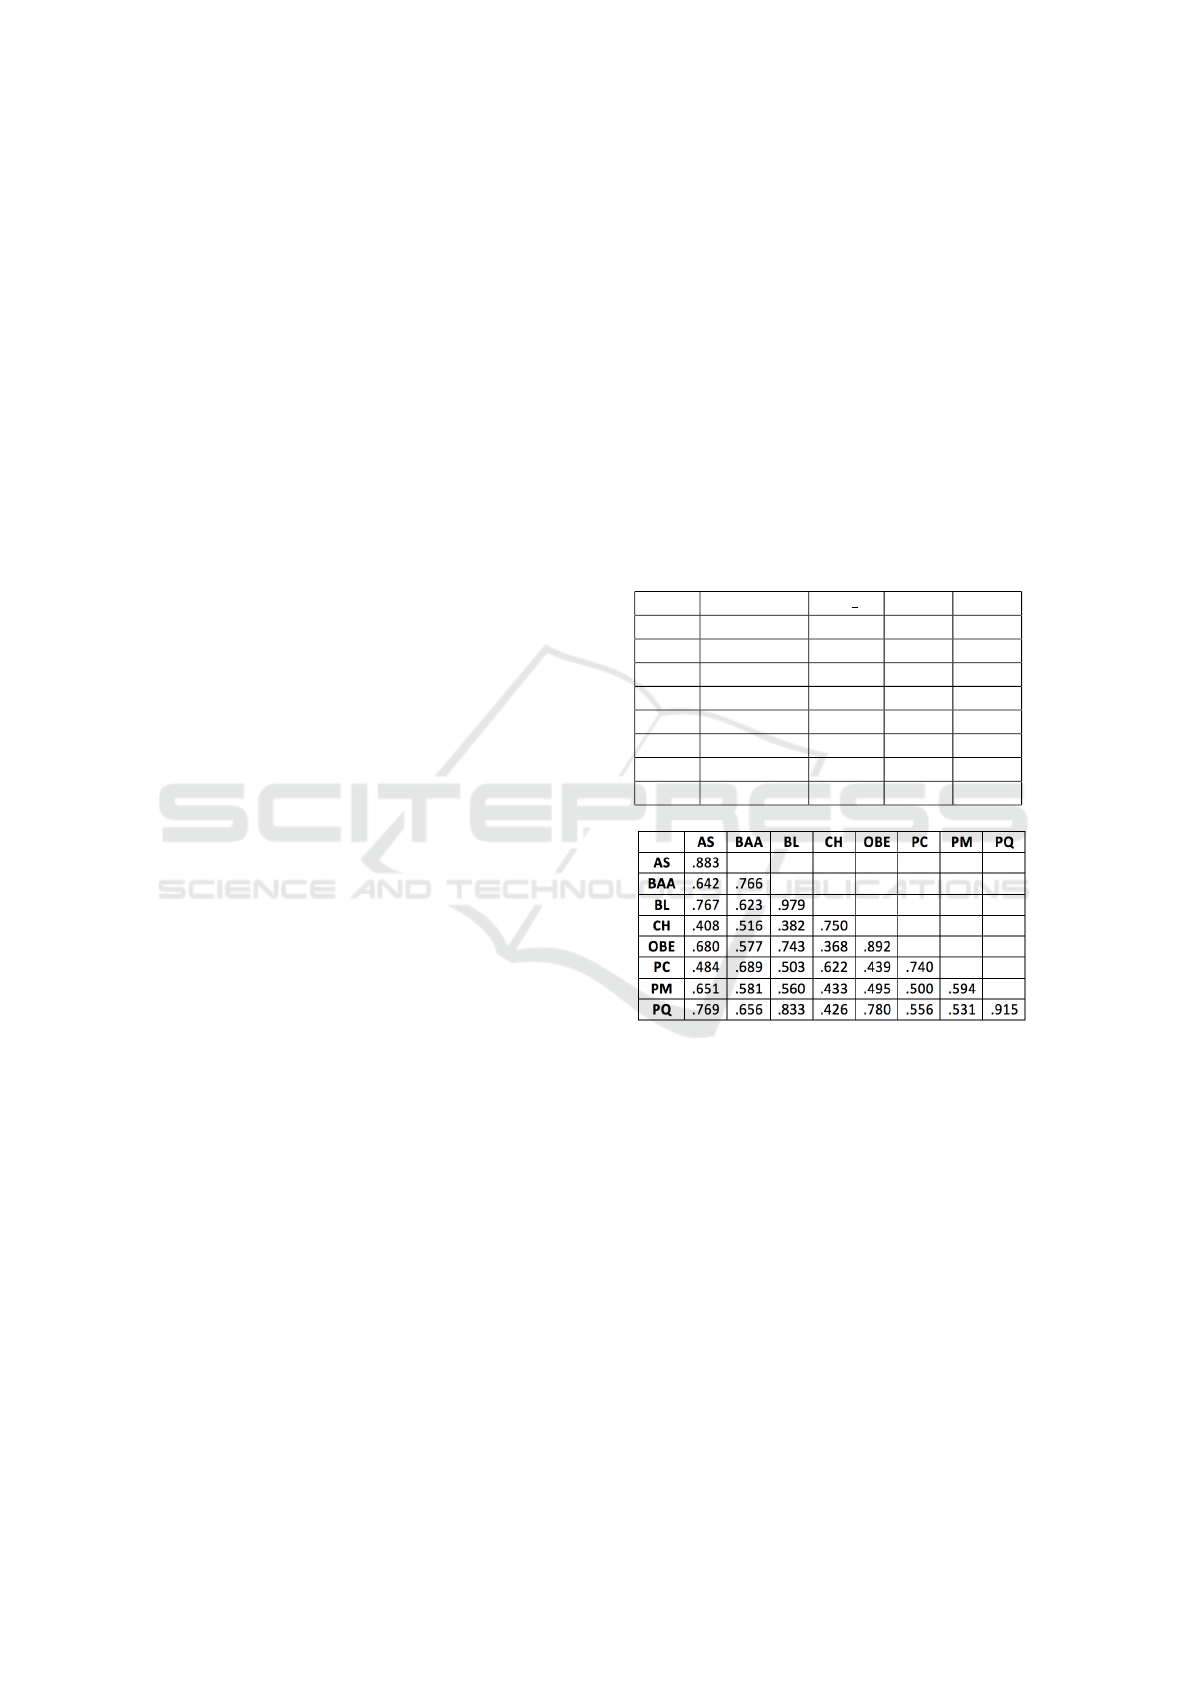
As per our analysis, author have following items
of reliability and Validity.
Table 4: Construct Reliability.
– Cronbach rho A CR AV
AS 0.859 0.876 0.914 0.780
BAA 0.646 0.711 0.807 0.586
BL 0.958 0.959 0.979 0.959
CH 0.652 0.879 0.790 0.563
OBE 0.872 0.888 0.921 0.795
PC 0.328 1.158 0.663 0.548
PM 0.592 0.674 0.733 0.353
PQ 0.805 0.807 0.911 0.837
Figure 4: Discriminant Validity.
7 CONCLUSIONS
The model has been tried with regards to the
Bangladesh software sector. The review accentuated
the speculation that Bangladesh’s product industry’s
point of view is rectified or not. It’s an unmistak-
able overview wherein the fundamental data was ac-
cumulated through a survey. 70 reactions were cho-
sen to investigate. The outcome showed that brand
value is an indispensable measurement for estimating
a brand’s well being, and observing it consistently is
a significant piece of productive brand management.
An underlying condition demonstration is used to test
the model and investigate speculation. Cronbach’s al-
pha was utilized to affirm unwavering quality. The
ICSBT 2022 - 19th International Conference on Smart Business Technologies
158

objective of our exploration was to perceive the way
in which the advertising blend and after-deals admin-
istrations impacted three parts of brand value. The
relationships between exploration factors have been
researched using SPSS (connection and relapse) and
Amos programming.
In conclusion, the model of this examination is
tended to from a static perspective. From the stand-
point of Bangladesh, the channel or location has a
good impact on enhancing brand awareness and loy-
alty. The promotional effort has an impact on brand
recognition as well. Brand awareness has a good im-
pact on perceived quality, which in turn has a positive
impact on overall brand equity.
REFERENCES
Aaker, D.A., (1996), Building Strong Brands, (New York:
The Free Press).
Keller KL. 2008. Strategic brand management: building,
measuring, and managing brand equity, 3red. New Jer-
sey: Pearson education international.
Aaker, D.A., (1991), Managing Brand Equity: Capitalizing
on the Value of a Brand Name, (New York: The Free
Press).
Webster, F. E., & Keller, K. L. (2004). A roadmap for brand-
ing in industrial markets. Journal of Brand Manage-
ment, 11(5), 388-402.
Keller KL.1998.”strategic brand management”, New Jersey,
prentice hall.
Cretu, A. E., & Brodie, R. J. (2007). The influence of brand
image and company reputation where manufacturers
market to small firms: A customer value perspective.
Industrial marketing management, 36(2), 230-240.
Yoo, B., & Donthu, N. (2001). Developing and validating a
multidimensional consumer-based brand equity scale.
Journal of Business Research, 52(1), 1-14.
Kavosh, K., & Asadi, A. (2014). Study effects of market-
ing mix and company’s image on brand equity Case
study: Minoo industrial group. International Research
Journal of Applied and Basic Sciences Available on-
line at www. irjabs. com, 1534-1538.
Nakhaei, L. (2013). Examining the Brand Image on Public
Relations and Customer Loyalty. Editors-in-Chief, 46.
Aulia, D., & Briliana, V. (2017). Brand Equity dimension
and consumer behavior in social media. South East
Asia Journal of Contemporary Business, Economics
and Law, 13(2), 15-24.
Sokachaee, E. H., & Babaei, M. (2014). Investigation of
effective factors on brand loyalty in the customers of
the mobile phone in the city of Bandar-e Anzali.
Tong, X., & Hawley, J. M. (2009). Measuring customer-
based brand equity: Empirical evidence from the
sportswear market in China. Journal of product &
brand management.
Yoo, B., Donthu, N., & Lee, S. (2000). An examination
of selected marketing mix elements and brand equity.
Journal of the academy of marketing science, 28(2),
195-211.
Foroudi, Pantea, et al. ”Perceptional components of brand
equity: Configuring the Symmetrical and Asymmetri-
cal Paths to brand loyalty and brand purchase inten-
tion.” Journal of Business Research 89 (2018): 462-
474.
Munawar, N. A., Mohamed, M., Yusliza, M. Y., Saputra, J.,
Muhammad, Z., & Bon, A. T. A Review of Customer
Lifetime Value, Marketing Mix and Brand Equity Lit-
erature, (2021).
Shamami, Roya Bakhshinezhad, and Bahram Kheiry. ”The
effect of marketing”, 2019.
Beyene, Birhanu. The Effects of Marketing Mix on Cus-
tomer’s Brand Preference, 2018.
Kim, Ji-Hern, and Yong J. Hyun. ”A model to investigate
the influence of marketing-mix efforts and corporate
image on brand equity in the IT software sector.” In-
dustrial marketing management 40.3 (2011): 424-438.
Huang, Chun-Yao, Ping-Yu Liu, and Shao-Ming Xie. ”Pre-
dicting brand equity by text-analyzing annual reports.”
International Journal of Market Research 62.3 (2020):
300-313.
Froudi, Pantea, et al. ”Influence of innovation capability and
customer experience on reputation and loyalty.” Jour-
nal of business research 69.11 (2016): 4882-4889.
Gupta, Suraksha, et al. ”Marketing innovation: A conse-
quence of competitiveness.” Journal of business re-
search 69.12 (2016): 5671-5681.
Investigation the Influence of Marketing-mix Efforts on Brand Equity in the Bangladesh Software Industry
159
