
Research on the Correlation between Cholesterol Level, Diet, and
Blood Pressure
Jiatong Shen
United World College Changshu China, 215500, Jiangsu, China
Keywords: High Blood Pressure, Cholesterol, Age, Caffeine, Cigarettes, Food.
Abstract: As time progresses, the prevalence of chronic diseases among people has increased, among which is high
blood pressure. High blood pressure is often thought of as being correlated with high cholesterol levels.
Moreover, blood pressure can also be affected by dietary conditions. This paper uses samples from American
elderly aged above 50 between the year 2007-2008 to explore the correlation between cholesterol level, along
with some dietary factors before testing, and blood pressure. A linear regression model is established using R
language to model the relationship between cholesterol levels and blood pressure in the elderly American
population. Also, a logistic regression model is established using R language to model the correspondence
between the cholesterol level and the diagnosis of high blood pressure of the American elderly. This paper
concludes that as age increases, people will have a higher risk of high blood pressure. Generally, the higher
the cholesterol level, the higher the blood pressure. Caffeine and food taken in 30 minutes before the blood
pressure test will slightly increase the blood pressure, while the effect of cigarettes is not stable.
1 INTRODUCTION
High blood pressure is one of the major causes of
premature diseases around the globe. According to
the World Health Organization, unhealthy diets,
physical inactivity, overweight, and consumption of
tobacco and alcohol are all potential factors of high
blood pressure (World Health Organization 2021).
There are many pieces of research concerning the
correlation between cholesterol level, high blood
pressure, and other diseases instead of merely the
correlation between cholesterol level and high blood
pressure. Therefore, this paper chooses to focus on the
correlation between cholesterol level and blood
pressure to fill the gap. This paper investigates the
effect of diet on blood pressure further, as the data
also provides diets from which samples were taken 30
minutes before the blood pressure test.
Cholesterol is a waxy type of fat, or lipid, which
moves throughout people’s bodies in the blood. The
body needs cholesterol to build healthy cells, but high
levels of cholesterol can increase the risk of heart
disease (MAYO Clinic 2021). With high cholesterol,
people can develop fatty deposits in the blood vessels.
Eventually, these deposits grow, making it difficult
for enough blood to flow through the arteries. In
cholesterol level measurements, there are
measurements for the total cholesterol, low-density
lipoprotein cholesterol, and high-density lipoprotein
cholesterol. The total cholesterol is the sum of the
blood’s cholesterol content. Low-density lipoprotein
cholesterol is the kind of cholesterol that can cause
plaques blocking the arteries when there is too much
of it. High-density lipoprotein cholesterol is the kind
of cholesterol that helps to keep away the low-density
lipoprotein cholesterol, making the arteries clean and
unblocked (Cleveland Clinic 2021). This paper uses
the total cholesterol data. The total cholesterol level
is measured during a blood test, and the blood is
drawn from a vein in the arm.
Blood pressure is the force of circulating blood on
the walls of the arteries. Blood pressure is taken using
two measurements: systolic (measured when the heart
beats when blood pressure is at its highest) and
diastolic (measured between heartbeats when blood
pressure is at its lowest). Blood pressure is written
with the systolic blood pressure first followed by the
diastolic blood pressure.
When the arteries become hardened and narrowed
with cholesterol plaque and calcium, the heart must
strain much harder to pump blood through them. As a
result, blood pressure becomes abnormally high
(Cleveland Clinic 2021). Moreover, some external
Shen, J.
Research on the Correlation between Cholesterol Level, Diet, and Blood Pressure.
DOI: 10.5220/0011373400003438
In Proceedings of the 1st International Conference on Health Big Data and Intelligent Healthcare (ICHIH 2022), pages 533-543
ISBN: 978-989-758-596-8
Copyright
c
2022 by SCITEPRESS – Science and Technology Publications, Lda. All rights reserved
533
dietary factors before the testing can also lead to an
increase in blood pressure. This research explores the
correlation between cholesterol, along with some
dietary factors, and blood pressure of the American
elderly between the year 2007-2008, which can lay
the foundation for comparative research between the
past and the future.
2 METHOD
2.1 Dataset
This paper uses the datasets from NHANES 2007-
2008, including the demographics data, total
cholesterol data, and data of blood pressure
(NHANES 2021).
The demographics data includes information that
was collected using the Sample Person and Family
Demographics questionnaires (NHANES 2021). This
paper specifically extracts the variables of SEQN
(Respondent sequence number) and RIDAGEYR
(Current age of the respondent).
The cholesterol data were collected from blood
specimens. The blood specimens were processed,
stored, and shipped to the University of Minnesota,
Minneapolis, MN for analysis. Vials containing the
blood sample were stored under 30°C until they were
shipped to the University of Minnesota for testing.
There were changes to equipment, lab method, and
lab site (NHANES 2021). This paper specifically
extracts the variables of LBXTC (Total cholesterol).
The blood pressure data were obtained from three
consecutive blood pressure measurements including
systolic and diastolic pressure, which are extracted
from the original table as BPXSY1(Systolic 1),
BPXSY2 (Systolic 2), BPXSY3(Systolic 3), BPXDI1
(Diastolic 1), BPXDI2 (Diastolic 2), BPXDI3
(Diastolic 3). Moreover, there include the
methodological measurements in the data of blood
pressure, including the variables of BPQ150A(Had
food in the past 30 minutes?), BPQ150B(Had alcohol
in the past 30 minutes?), BPQ150C(Had coffee in the
past 30 minutes?), and BPQ150D(Had cigarettes in
the past 30 minutes?).
2.2 Data Preprocessing
In the data preprocessing phase, the three tables for
demographics data, cholesterol data, and blood
pressure data are integrated into one big table. First,
variables are selected, and NA values are omitted.
Next, the mean of the systolic blood pressure as well
as the mean of the diastolic blood pressure are
calculated based on the data of blood pressure from
the three times’ measurements. Then, data are filtered,
and only the ones of which the sample’s age is greater
or equal to 50 are kept. After that, the remaining data
are categorized into different age groups for further
research, including “50-60”, “60-70”, “70-80”, and
“80+”. Finally, a new variable called “Diagnosis” is
created: Samples whose blood pressure is lower than
or equal to 120/80mmHg is labeled as 0, meaning that
this sample is diagnosed as normal, while those
whose blood pressure is higher than 120/80mmHg is
labeled as 1, meaning that this sample is diagnosed as
abnormal or with high blood pressure. Diagnosis
standards are determined based on a conclusion by
the American Heart Association, which indicates that
120/80mmHg and below is the normal range (Heart,
1 Oct. 2021).
2.3 Data Analysis
2.3.1
Data Summary
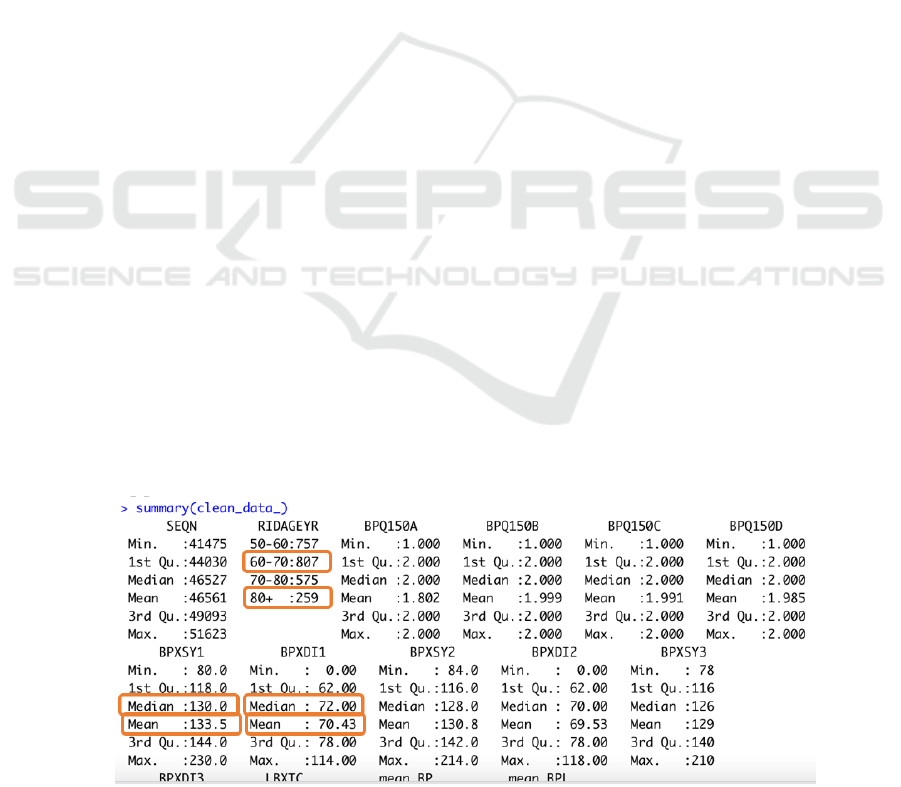
To analyze the data, the summary for the combined
table is obtained
Figure 1: Summary for the Combined Table.
ICHIH 2022 - International Conference on Health Big Data and Intelligent Healthcare
534
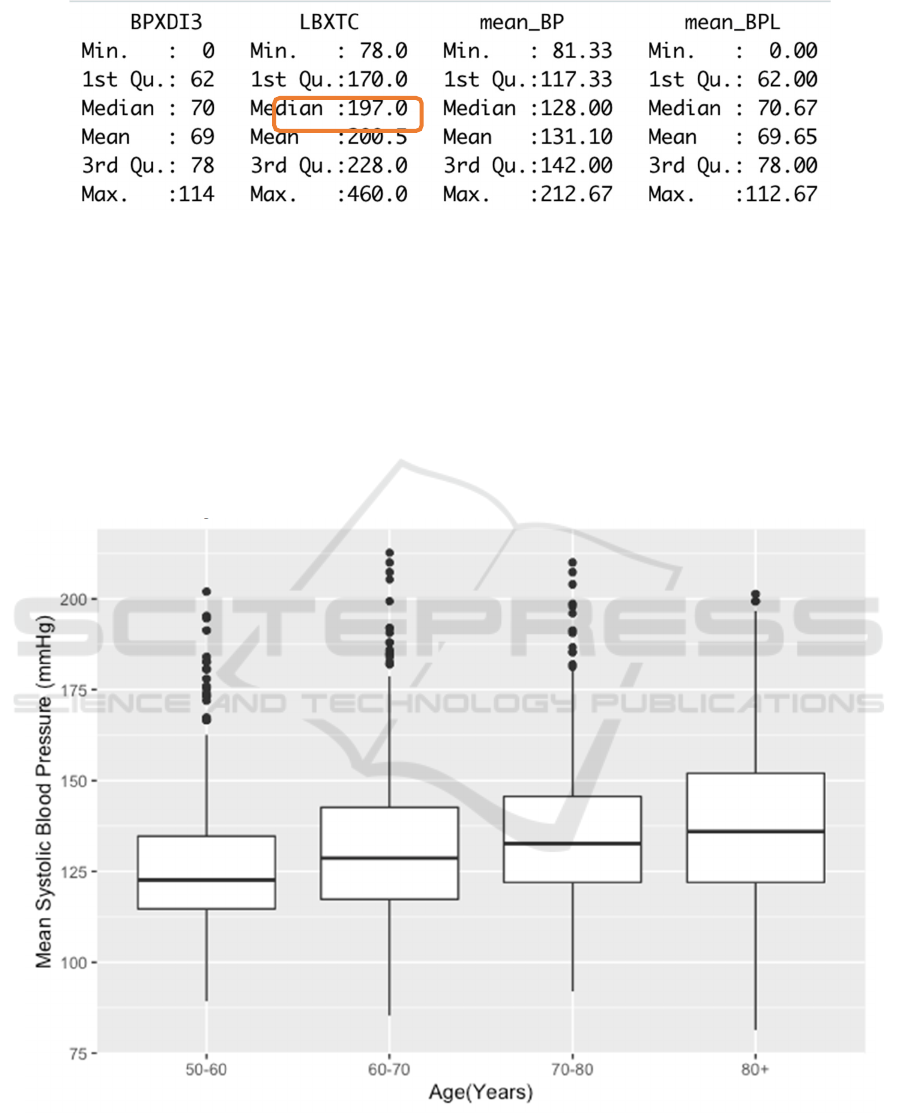
Figure 2: Summary for the Combined Table.
The summary for the combined table shows that
the age group with the most population in this
research is those aged between 60-70, and the age
group with the least population is those aged 80+. The
mean and median of the first blood pressure, whether
systolic or diastolic, is the largest among the three
blood pressure tests. In addition, the means and
medians of systolic blood pressure of people above
50 years old in this research are all above the normal
range, while the ones for diastolic blood pressure are
all within the normal range. Furthermore, the normal
range of total cholesterol is 125 to 200mg/dL, so the
mean of total cholesterol of the tested population
slightly exceeds normal (MedlinePlus, 20 Oct. 2021).
2.3.2 Correlation between Age and Mean
Blood Pressure
Since we want to explore the correlation between age
and mean blood pressure, boxplots regarding the age
and the mean systolic and diastolic blood pressure are
drawn.
Figure 3: Age and Mean Systolic Blood Pressure.
Research on the Correlation between Cholesterol Level, Diet, and Blood Pressure
535
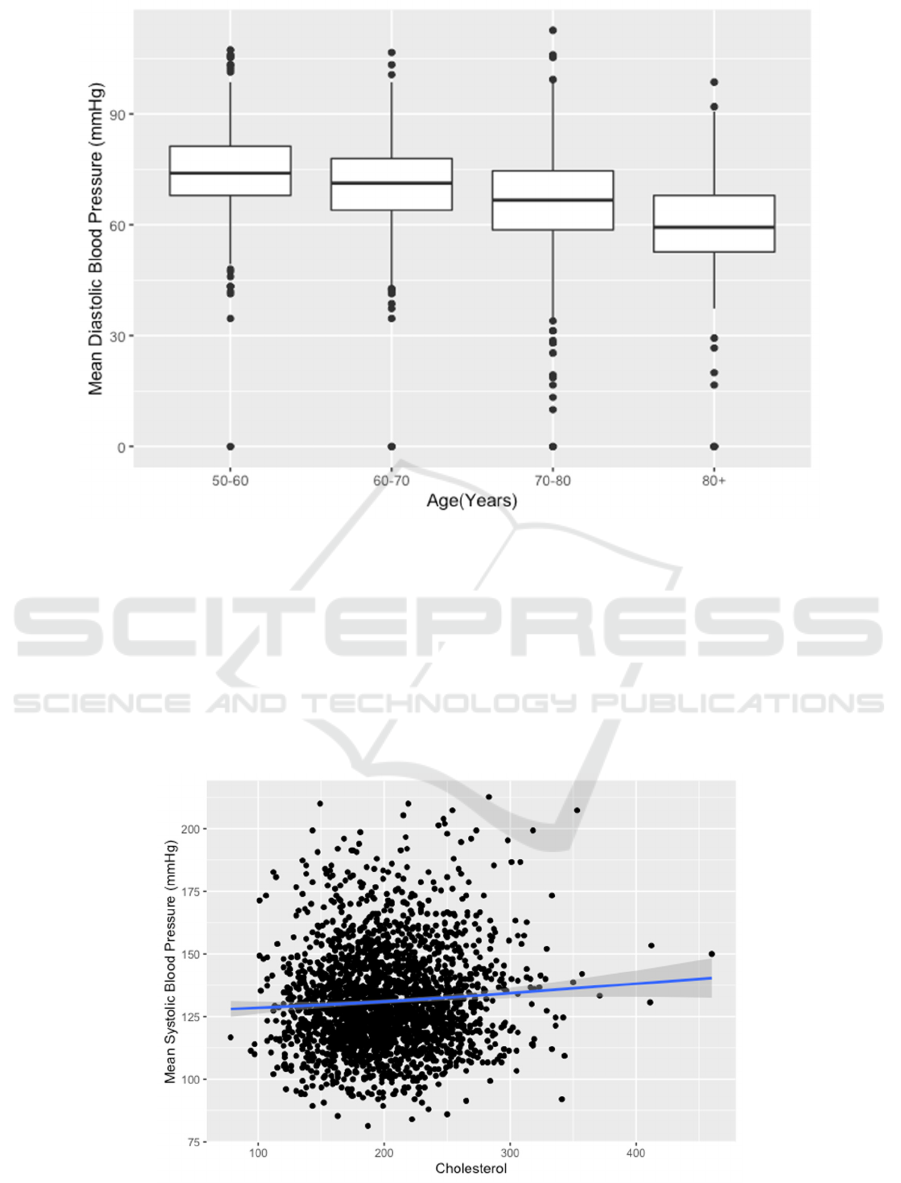
Figure 4: Age and Mean Diastolic Blood Pressure.
These two boxplots demonstrate that as age
increases, the mean systolic blood pressure generally
increases, and the mean diastolic blood pressure
generally decreases. From these trends, we can
conclude that there exist correlations between age and
the mean systolic and diastolic blood pressure.
2.3.3 Correlation between Cholesterol Level
and Mean Blood Pressure
To investigate the correlation between cholesterol
level and the mean blood pressure, scatterplots with a
line of the best fit are drawn regarding cholesterol
level and the mean systolic and diastolic blood
pressure.
Figure 5: Cholesterol Level and Mean Systolic Blood Pressure.
ICHIH 2022 - International Conference on Health Big Data and Intelligent Healthcare
536
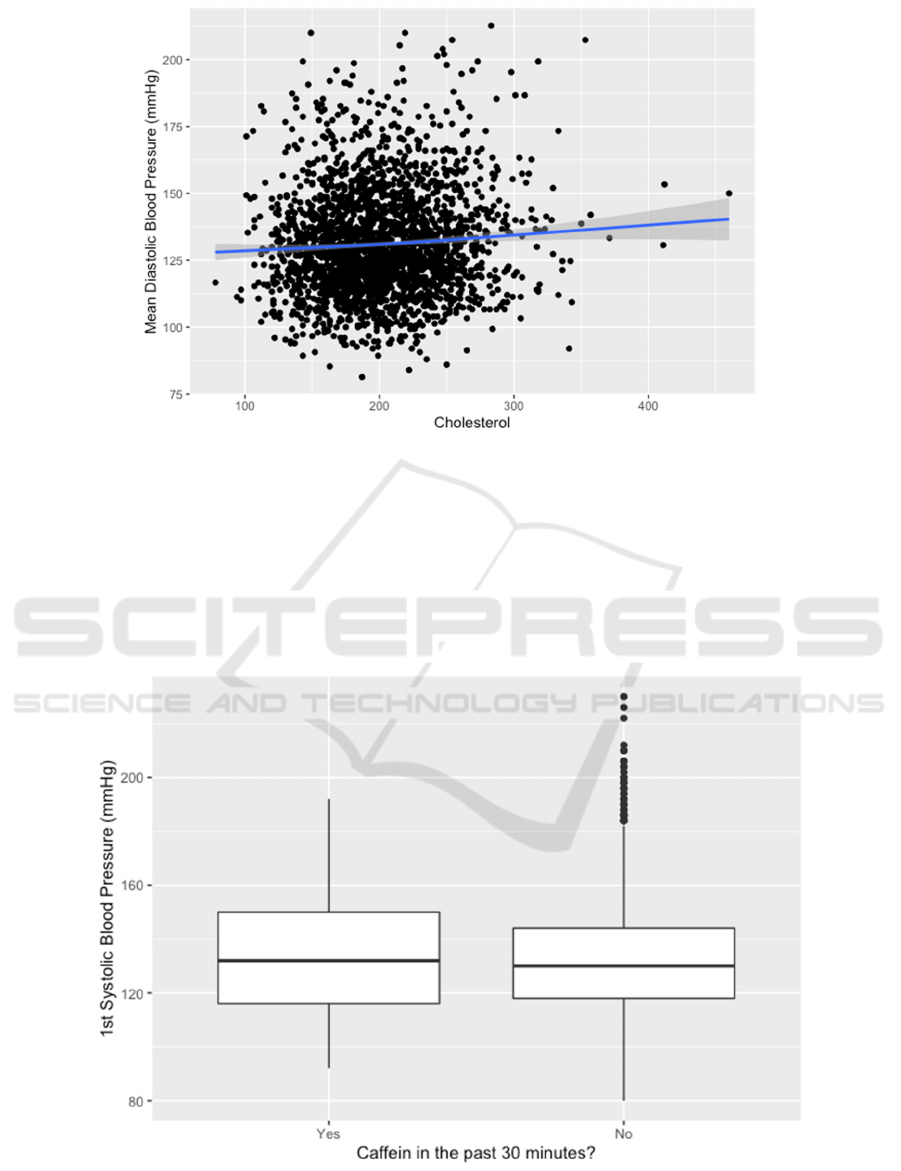
Figure 6: Cholesterol Level and Mean Diastolic Blood Pressure.
The plots illustrate that as cholesterol amount in
the body increases, mean systolic blood pressure as
well as mean diastolic blood pressure slightly
increase with a weak positive linear relationship.
2.3.4
Caffeine and 1st Blood Pressure
Boxplots regarding whether the sample ingested
caffeine 30 minutes before the blood pressure
measurements and their implications on the blood
pressure firstly measured, also known as 1st blood
pressure, are drawn.
Figure 7: Caffeine and 1st Systolic Blood Pressure.
Research on the Correlation between Cholesterol Level, Diet, and Blood Pressure
537
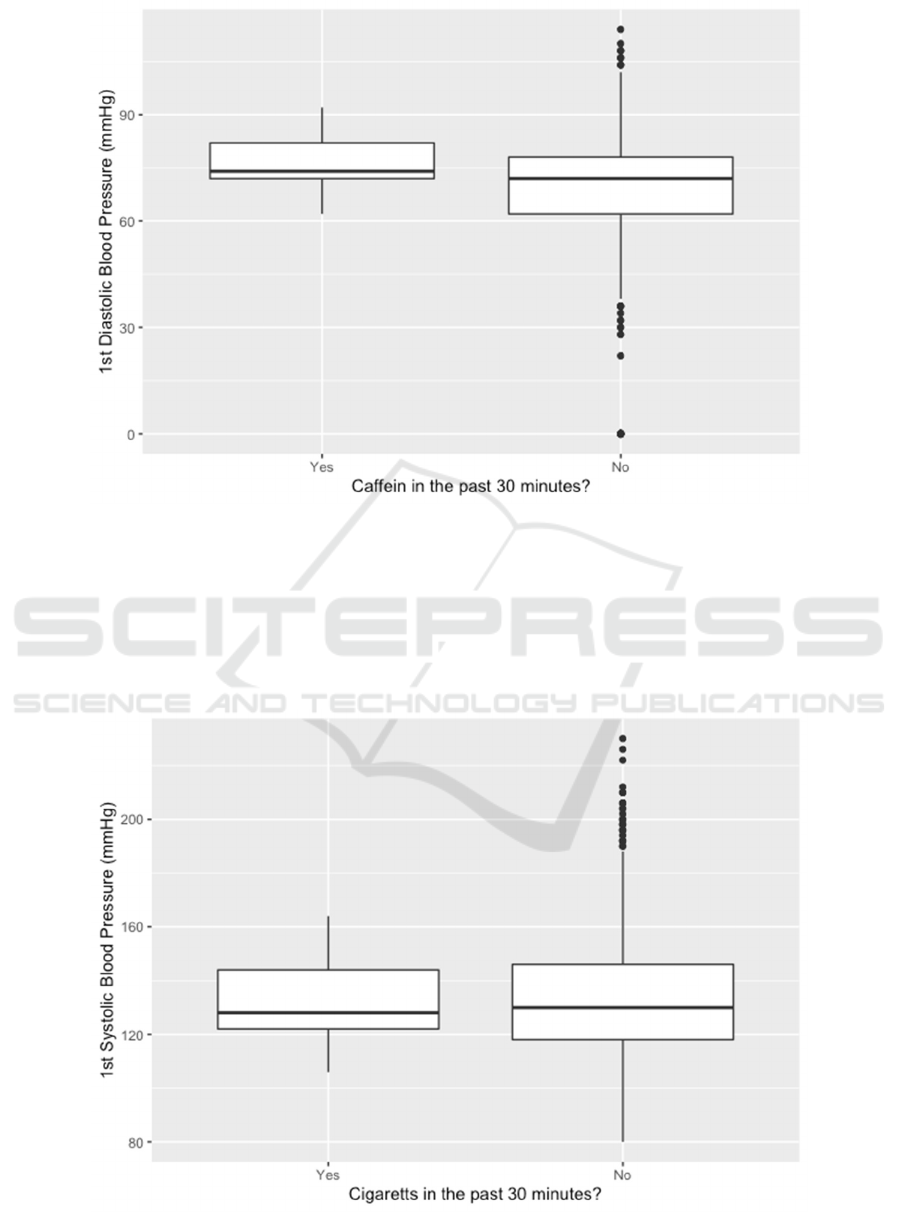
Figure 8: Caffeine and 1st Diastolic Blood Pressure.
The samples who drank coffee in the past 30
minutes had a slightly higher 1st blood pressure.
Here, 1st blood pressure is chosen because it is more
easily influenced by diet, as there is a shorter time gap
between testing and diet compared with the other 2
test results.
2.3.5
Cigarettes and 1st Blood Pressure
Boxplots regarding whether the sample ingested
cigarettes 30 minutes before the blood pressure
measurements are drawn.
Figure 9: Cigarettes and 1st Systolic Blood Pressure.
ICHIH 2022 - International Conference on Health Big Data and Intelligent Healthcare
538
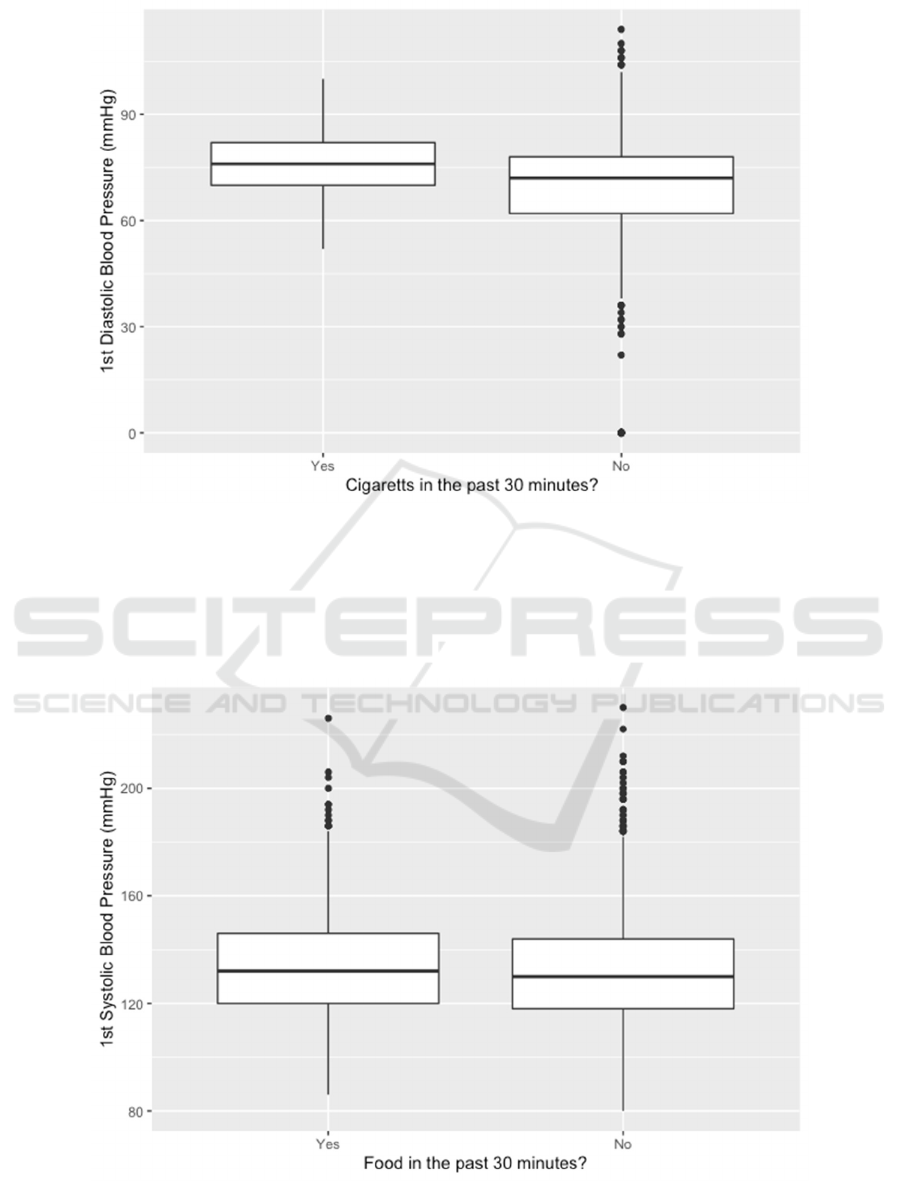
Figure 10: Cigarettes and 1st Diastolic Blood Pressure.
The samples that had cigarettes in the past 30
minutes had a slightly lower 1st systolic blood
pressure and a slightly higher 1st diastolic blood
pressure.
2.3.6
Food and 1st Blood Pressure
Boxplots regarding whether the sample ingested food
30 minutes before the blood pressure measurements
are drawn.
Figure 11: Food and 1st Systolic Blood Pressure.
Research on the Correlation between Cholesterol Level, Diet, and Blood Pressure
539
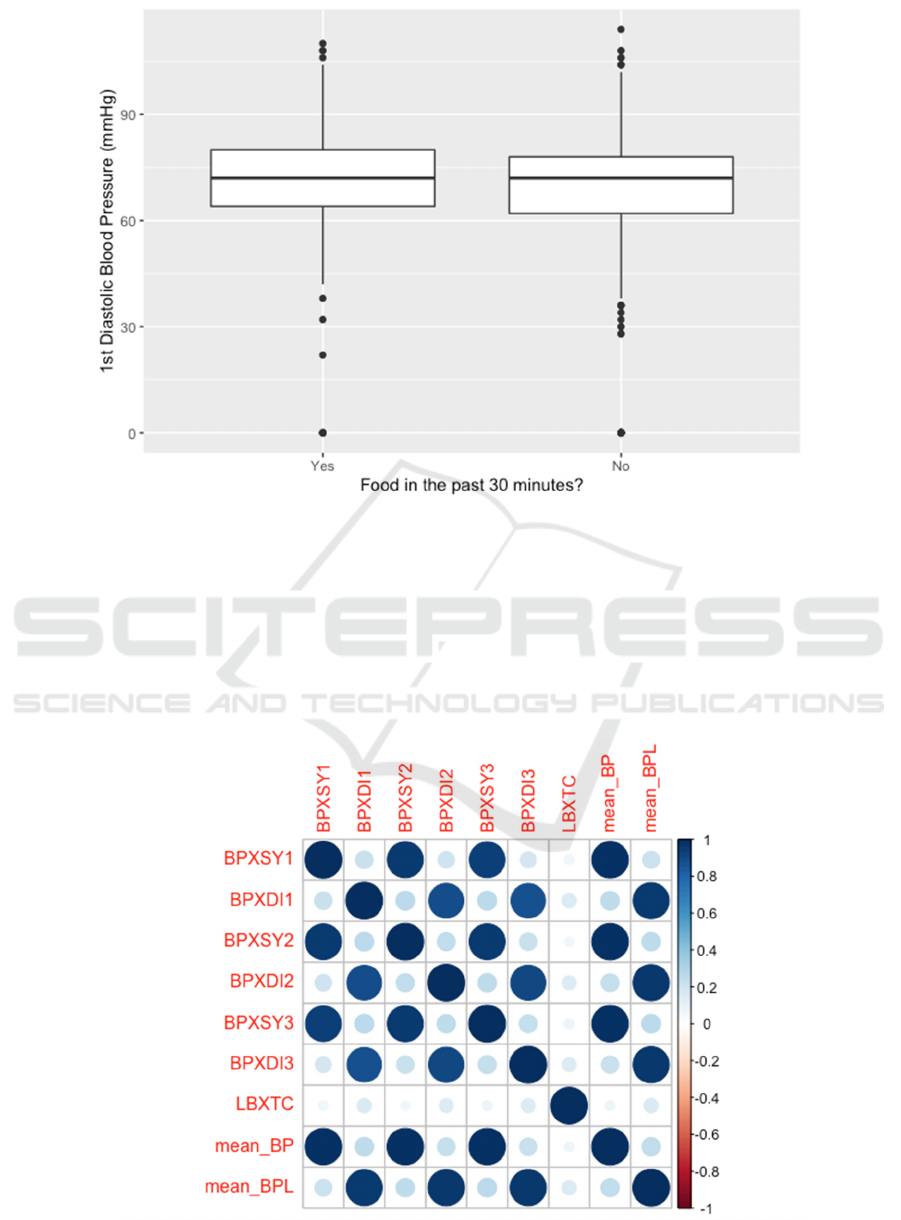
Figure 12: Food and 1st Diastolic Blood Pressure.
The samples that had food in the past 30 minutes
had a slightly higher 1st blood pressure.
2.3.7
Correlation Plot
A correlation plot of all the numerical variables in the
table is drawn, where the larger the dot, the higher the
correlation.
The correlation between cholesterol and blood
pressure is not very significant from the plot.
However, the correlation between blood pressure
tests each time is quite high, which shows the stability
or consistency of a person’s blood pressure
Figure 13: Correlation Plot for Numerical Variables.
ICHIH 2022 - International Conference on Health Big Data and Intelligent Healthcare
540
2.3.8
Linear Regression
The linear regression model models the relationship
between the raw cholesterol data and the mean blood
pressure, whether it is systolic or diastolic
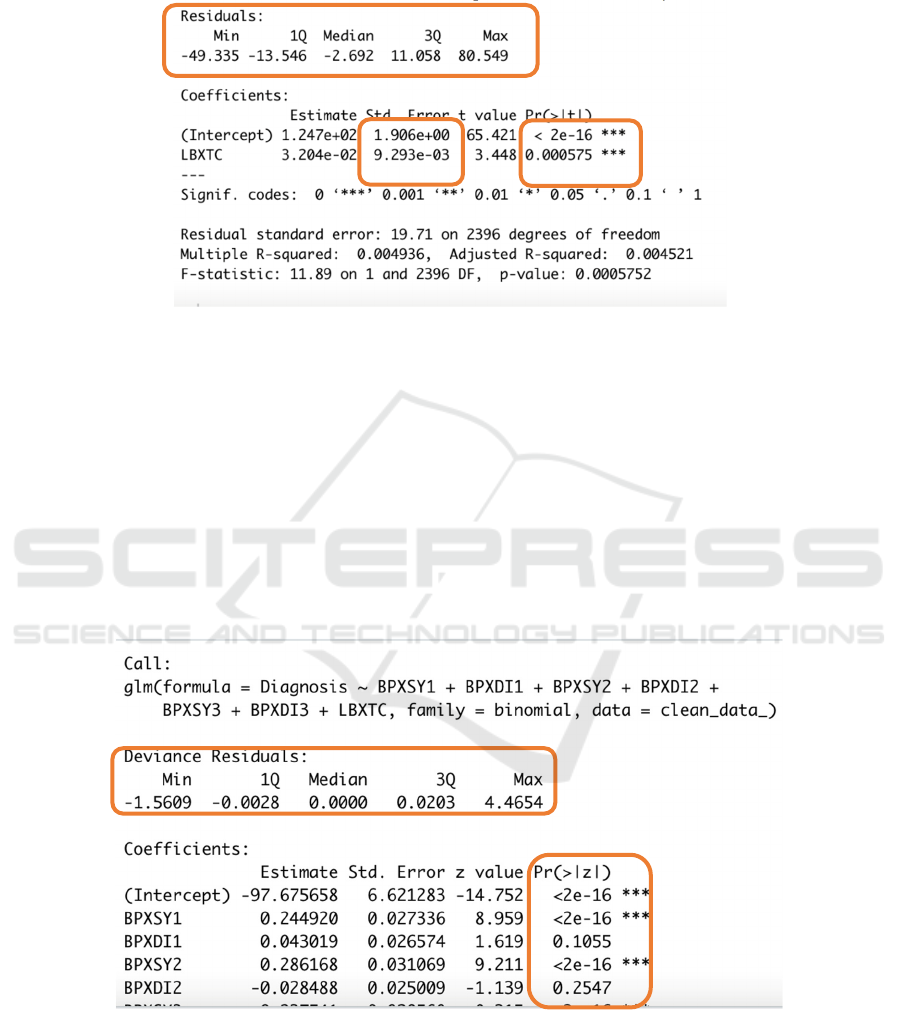
Figure 14: Linear Regression Model Summary.
The first plot is the summary of the linear
regression model for cholesterol and means systolic
blood pressure. Residuals are essentially the
difference between the actual observed response
values and the response values that the model
predicted. The values of the residuals vary. The
coefficient standard error measures the average
amount that the coefficient estimates vary from the
actual average value of our response variable. In the
plot above, the coefficient standard error is relatively
small. The t values are relatively far away from zero
and are large relative to the standard error, which
could indicate a relationship between cholesterol
level and blood pressure exists. The values of Pr(>|t|)
are smaller than 0.05, which indicates that it is
unlikely we will observe a relationship between the
predictor (cholesterol level) and response (blood
pressure) variables due to chance (FELIPE REGO, 23
Oct. 2015).
2.3.9
Logistic Regression
The logistic regression model models the relationship
between the raw cholesterol data and the diagnosis.
Figure 15: Logistic Regression Model Summary.
Research on the Correlation between Cholesterol Level, Diet, and Blood Pressure
541
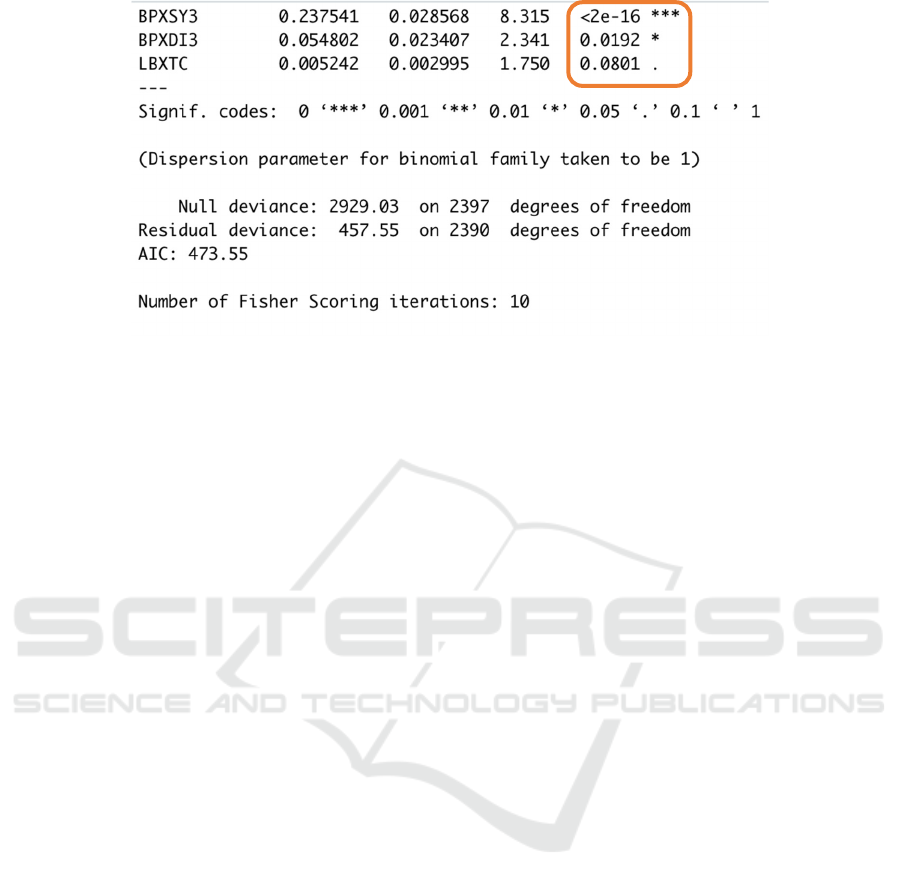
Figure 16: Logistic Regression Model Summary
Here is the summary of the logistic regression
model for cholesterol and the diagnosis (Le, James,
2021). The deviance residuals are quite small and
close to zero. The values of Pr(>|t|) are smaller than
0.05, which indicates that it is unlikely we will
observe a relationship between the predictor
(cholesterol level) and response (diagnosis) variables
due to chance.
3 DISCUSSION
Firstly, there can be errors in cholesterol data because
the cholesterol sample can be influenced by changes
in the surrounding environment before testing.
Secondly, the data are from 2007-2008, which is a bit
outdated. But what’s helpful is that this research can
lay the foundation for comparative research later.
Thirdly, the results may be biased because they are
based on samples of the American elderly. Fourthly,
the correlations between variables in this research are
generally weak, which might be because there is
limited data. Expanding samples to young people and
gathering more data in later years might be the
solution.
4 CONCLUSIONS
This paper concludes that as age increases, people
will have a higher risk of high blood pressure.
Generally, the higher the cholesterol level, the higher
the blood pressure. Blood pressure can be affected by
diet before testing -- caffeine and food will slightly
increase the blood pressure, while the effect of
cigarettes is not stable.
As the data available only provide dietary inserts
of caffeine, cigarettes, and food 30 minutes before the
blood test, the correlation between diet and blood
pressure has yet to be more deeply investigated.
Further research may investigate the impact resulting
from other types of diet or the long-term impact of
certain nutrition on blood pressure. Moreover, future
research may investigate how public health policy
after 2007-2008, or any other external factors,
influences the rate of getting high blood pressure.
ACKNOWLEDGEMENTS
I would like to express my gratitude to Professor Ma
Shuangge whose lecture on data analytics lays the
crucial foundation for this research. Also, I would
especially like to thank Yi Jiayi for teaching me the
basics of the R language, without whose teaching this
research will not be realized.
REFERENCES
Cleveland Clinic. my.clevelandclinic.org/
health/articles/11920-cholesterol-numbers-what-do-
they-mean. Accessed 1 Nov. 2021.
Cleveland Clinic. my.clevelandclinic.org/
health/articles/11918-cholesterol-high-cholesterol-
diseases. Accessed 1 Nov. 2021.
FELIPE REGO, 23 Oct. 2015, feliperego.
github.io/blog/2015/10/23/Interpreting-Model-Output-
In-R. Accessed 1 Nov. 2021.
Heart. www.heart.org/en/health-topics/high-blood-
pressure/understanding-blood-pressure-readings.
Accessed 1 Oct. 2021.
ICHIH 2022 - International Conference on Health Big Data and Intelligent Healthcare
542

Le, James. "Logistic Regression in R Tutorial." Datacamp,
10 Apr. 2018, www.datacamp.com/community/
tutorials/logistic-regression-R. Accessed 1 Oct. 2021
MAYO Clinic. www.mayoclinic.org/diseases-
conditions/high-blood-cholesterol/symptoms-
causes/syc-20350800. Accessed 1 Nov. 2021.
MedlinePlus. medlineplus.gov/
cholesterollevelswhatyouneedtoknow.html. Accessed
20 Oct. 2021.
NHANES. wwwn.cdc.gov/Nchs/Nhanes/2007-2008/
DEMO_E.htm. Accessed 1 Oct. 2021.
NHANES. wwwn.cdc.gov/Nchs/Nhanes/2007-2008/
TCHOL_E.htm. Accessed 1 Oct. 2021.
NHANES. wwwn.cdc.gov/Nchs/Nhanes/2007-2008/
BPX_E.htm#BPQ150C. Accessed 1 Oct. 2021.
World Health Organization. 25 Aug. 2021, www.who.int/
news-room/fact-sheets/detail/hypertension. Accessed 1
Nov. 2021.
Research on the Correlation between Cholesterol Level, Diet, and Blood Pressure
543
