
Preference Study of Rice Obtained from Some Areas Which
Represent the High Yielding Varieties of Rice in Indonesia
Hanifah Nuryani Lioe
1
, Munyatul Islamiah
1
and Anton Apriyantono
1,2
1
Department of Food Science and Technology, Faculty of Agricultural Engineering and Technology,
Bogor Agricultural University, IPB Darmaga Campus, PO Box 220, Bogor, West Java, Indonesia
2
Department of Food Technology, Universitas Bakrie, Jakarta, Indonesia
Keywords: Cooked Rice, Consumer Preference, Descriptive Sensory Analysis, Rice Preference, Sensory Characteristic.
Abstract: Indonesia is an agricultural country. One of the most important agriculture is rice which is a staple food for
people of Indonesia. Every province in Indonesia has a difference of high yielding variety of rice. It relates to
the acceptance and preference of consumers which are influenced by social environment and origin of area.
The preference of consumers and the palatability determine quality and sensory characteristics of rice. This
study aimed to characterize the sensorial quality of 4 varieties of rice, obtained from West Sumatra, West
Java, South Sulawesi and Papua, and to identify preference of consumers to the cooked rice. Descriptive
sensory analysis was performed by 8 trained panelists who used 14 descriptors to quantitatively describe the
sensory characteristics of four rices. Descriptive data were visualized by spider web and were analyzed by
two-way ANOVA and Tukey’s Multiple Range Test if significantly different across attribute (p<0,05). In
parallel, the preference of consumers of rice on these rice was expressed on a nine-point hedonic scale. To
understand consumers' responses further, the preference ratings were also analyzed by one-way ANOVA and
Duncan’s Multiple Range Test if significantly different across sample (p<0,05). The result showed that
preference of consumers of West Java and South Sulawesi were influenced by taste and texture of cooked
rice. They disliked taste and texture of cooked rice from Cisokan. The preference of this consumers was taste
and texture of cooked rice from Ciliwung. On the other hand, the consumers of West Sumatra disliked taste,
aroma, and texture of cooked rice from Ciliwung. The consumers of Papua (reprenseting West Papua and
Papua Provinces) did not have specific sensory characteristic in consumed cooked rice. However, they
disliked the aroma of cooked rice from Ciherang.
1 INTRODUCTION
Rice is the main source of nutrition and energy for
more than 90% of Indonesia's population. The
consumer preferences to rice have become
researchers’ attention. However, research on rice
preferences for major consumers in Indonesia has not
been done in depth, even though it has been known
publicly that each region in Indonesia has different
preferences on rice.
Consumer preference and rice palatability
characteristics determined the quality of cooked rice
(Tao et al. 2019, Okpiaifo et al. 2020). Sensory
evaluations carried out on the cooked rice can be
influenced by the different population in different
area or region (Aoki et al. 2017). The sensory
evaluation plays an important role to reveal consumer
preferences. Therefore, in this present study, sensory
evaluation was conducted to know the consumer
preference from 4 main regions which are yielding
main varieties of rice in Indonesia.
Each region in Indonesia may have different rice
varieties produced. This depends on the climate,
topography, soil conditions, and different cultural
backgrounds for each region (Yuliawan and Handoko
2016, Agustiani et al. 2018, Rumanti et al. 2018).
These factors lead to the existence of superior rice
varieties which are favorite varieties of rice for
farmers and consumers in the area. The diversity of
rice varieties can be seen from each region, for
example Cianjur variety in West Java, Solok variety
in West Sumatra, etc. This variety of rice may have
different compositions, especially the amylose-
amylopectin content of the rice (Tao et al. 2019). The
difference in composition is greatly influenced by
conditions of agricultural land, rice genetics,
Lioe, H., Islamiah, M. and Apriyantono, A.
Preference Study of Rice Obtained from Some Areas Which Represent the High Yielding Varieties of Rice in Indonesia.
DOI: 10.5220/0009978200002833
In Proceedings of the 2nd SEAFAST International Seminar (2nd SIS 2019) - Facing Future Challenges: Sustainable Food Safety, Quality and Nutrition, pages 57-62
ISBN: 978-989-758-466-4
Copyright
c
2022 by SCITEPRESS – Science and Technology Publications, Lda. All rights reserved
57

fertilization, the environment where it grows and the
climate. Comparison between amylose and
amylopectin is used as the basis in determining the
quality of taste and texture of rice. Amylose content
is positively correlated with the level of softness,
adhesiveness, color and gloss (Haryadi, 2008). This
is because amylose has a greater retrogadation ability
(Pratiwi, 2017). According to Haryadi (2008), rice
with high amylose content produces dry and dry rice,
whereas rice with low amylose content produces
sticky and soft rice. In addition, another factor that
determines the diversity of rice varieties is aroma and
taste (flavor characteristics). Aroma is produced from
volatile components released from rice (Zeng et al.,
2008), meanwhile taste is associated to non-volatile
components (Lioe et al. 2010).
Research on rice preferences in terms of consumer
preferences in different area is a very important
problem considering that Indonesia is a country that
consists of various ethnicities and cultures so that the
types of favorite rices may also be different. This
research can later be used as a reference or
consideration for rice plant breeders in assembling
new high yielding varieties in terms of community
preferences or preferences related to the culture of an
area so that it can be consumed and liked by the
people in the area. The aim of this study was to
identify the preferences of people from West
Sumatra, West Java, South Sulawesi, and Papua
(representing West Papua and Papua Provinces) for
the four superior rice varieties evaluated, namely
Cisokan, Ciherang, Ciliwung, and Membramo, and to
determine the relationship between consumer
preferences and description of sensory attributes of
rice from the different varieties.
2 MATERIAL AND METHODE
2.1 Materials
The materials used in this study were superior rice
varieties which were widely consumed in the 4
regions of Indonesia: West Sumatra, West Java,
South Sulawesi and Papua. These varieties were
Cisokan variety (origin from West Sumatra
Province), Ciherang variety (from West Java
Province), Ciliwung variety (from South Sulawesi
Province), and Membramo variety (from West Papua
and Papua Provinces) obtained from the Indonesian
Center for Rice Research, Sukamandi, West Java.
The four varieties were harvested from February to
March 2011. Grain drying under sun was carried out
until the grain moisture content was 14% wb. As
much as 300 grams of grains from each variety were
processed with Satake Rice Husker which separated
rice and skin. Then, 200 grams of rice and skins were
scrubbed for 3.5 min by using Satake Polisher to
obtain head rice and broken rice. The polish degree
used was 90%. The polished rice used in the sensory
evaluation consisted of the mixture of head rice and
broken rice. During the research, rice was placed in
an airtight plastic container covered with black
plastic. Then rice was stored in a refrigerator at 9-
11˚C. Polished rice needed during this research was
6.5 kg for each variety.
The chemicals used were standards of flavor (2-
acetyl pyridine, acetoin, vanillin, diacetyl, pandan
flavor, 5-methyl-2-furfural, and sugar lactone) in
liquid form. Vanilin and pandan flavor compounds
were from Sensient Technologies Indonesia Co.,
meanwhile 5-methyl-2-furfural, 2-acetyl pyridine,
acetoin, diacetyl, and sugar lactone compounds were
obtained from Ogawa Indonesia Co. The standards
were stored in small bottles (with a capacity of 10
mL) and placed in a refrigerator at temperatures of 0-
4˚C. Equipments needed included a set of four rice
cookers (Miyako, MCM-509, Indonesia), aluminum
foil, measuring cup, glasswares, a small container for
sensory testing.
2.2 Determining Rice Samples
A literature study was carried out by reviewing
various literatures on superior varieties of rice that
were widely produced and consumed in West
Sumatra, West Java, South Sulawesi, and Papua. The
rice samples used in this study were as follows
(Puslitbangtan, 2010):
• Cisokan: unfluffier (not pulen) rice texture,
amylose content of 26%, glycemic index at 34,
known as lowland rice with an altitude of 500 m
above sea level.
• Ciherang: fluffier (pulen) rice texture, amylose
content of 23%, glycemic index at 54.9. It was
planted in lowland irrigated rice fields up to 500
m above sea level. High productivity with
quality and taste of rice was equivalent to IR64.
• Ciliwung: fluffier rice texture, amylose content
of 22%, glycemic index at 86. It was planted in
low-irrigated irrigated land up to 550 m above
sea level.
• Membramo: fluffier rice texture, amylose
content of 19%. It was either planted on irrigated
land less than 550 m above sea level or more
than.
2nd SIS 2019 - SEAFAST International Seminar
58

2.3 Rice Cooking Method
Cooking of rice was done in the same way for the four
superior varieties, its method included the rice cooker
type (1.8 L capacity), the ratio of rice to water, as well
as the way of rice washing until the way of rice being
served. Rice was cooked using a rice cooker. Before
cooking, the rice to be cooked was weighed at 0.38
kg. Rice was then 4-5 times washed with tap water
until the washing water became considerably clear.
Washed and drained rice was put into a rice cooker
pan. Then 670 mL of tap water was added. The pan
was put into the rice cooker. The rice cooker was
closed, but previously covered with aluminum foil,
then closed properly. After the rice has been cooked,
it was let for 15 minutes in the cooker. The rice was
then stirred evenly. The four samples were presented
simultaneously in a hot state in a container that was
closed using aluminum foil.
2.4 Sensory Analysis by Quantitative
Descriptive Analysis (QDA) and
Hedonic Test
The evaluation method used in this study was QDA
to determine the sensory characteristics of a sample.
Trained panelists who have passed the selection and
training phase evaluated the samples. The panel
selection phase included the pre-screening stage,
identification of basic tastes and aromas, triangle
tests, ranking tests, and personal interviews. After the
panel candidates passed the selection stage, training
was then conducted to produce a group of panelists
which had a consistent result in evaluating the
sensory attributes of sample (Drake & Civille, 2003).
Consumer preference testing was done using a
hedonic rating by a panel of Bogor Agriculture
University students come from West Sumatra
(34 persons), West Java (45 persons), South Sulawesi
(42 persons), Papua (30 persons). The hedonic test
was done by rating the attributes of taste, aroma and
texture. The range of hedonic scale is between 1
(extremely like) to 9 (extremely dislike).
Focus group discussion (FGD) were conducted
before and after QDA testing. The FGD prior to the
training was conducted to determine the attributes of
taste, aroma, and texture that would be used in the
training process. The FGD after the training was
conducted so that panelist sensitivity in detecting the
presence of taste, aroma, and texture attributes in the
sample was higher. The results obtained from the
FGD was used in the QDA analysis.
The reference concentrations for aroma and taste
obtained during training was processed using the
Stephen equation (Meilgaard et al. 1999), then the
equation was reduced to a logarithmic equation. This
was done to get the reference concentration used in
QDA analysis. In contrast, for texture attributes
where the reference values were following Meullenet
et al. (1999).
QDA analysis was conducted to determine the
intensity of sensory attributes (taste, aroma and
texture) on each rice sample tested. The attribute
intensity of the samples was carried out using an
unstructured line scale. Unstructured scale consisted
of lines along the 15 cm with a border mark at both
ends. On the scale of the line also given 2 assistance
lines as a reference. Each sample of rice was placed
in a special container that has a three-digit code. The
sample was presented under the same controlled
conditions as normal consumer conditions. Time
between two testings (from one sample to another)
were given at a time interval of 20 min. During the
time, the panelists were given drinking water to
neutralize the senses if for taste and texture testings
or were given coffee powder if for aroma testing.
Evaluation of the intensity of each attribute of a
sample was carried out triplo. The QDA was carried
out by 8 trained panelists who assessed the four rice
samples in a time. QDA data were processed using
ANOVA and multivariate analyses, namely principal
component analysis (PCA) using Unscrambler
version 9.2 (Camo, Norway).
3 RESULTS AND DISCUSSION
3.1 Classification of Rice Varieties on
Attributes of Taste, Aroma and
Texture
The spider web diagram in Figure 1 shows the four
varieties of rice were described as having sweet, salty
and gurih (like umami) tastes; also vanilla, sweet,
pandan leaf, nutty and buttery aromas. The four
varieties had different rice characteristics, especially
for the attributes of adhesiveness, coarseness,
toothpull, sweet and nutty aromas. Cisokan had the
lowest adhesiveness but Ciherang had the highest
adhesiveness, Membramo had the highest toothpull,
Ciliwung had the highest sweetness.
Mapping the taste, aroma, and texture attributes
results in three different groups which described 82%
of variance in the data (Figure 2). The first group
contained the varieties of Membramo and Ciherang
which were described with the adhesive attributes of
the sample on the lips which were low, sweet taste
Preference Study of Rice Obtained from Some Areas Which Represent the High Yielding Varieties of Rice in Indonesia
59
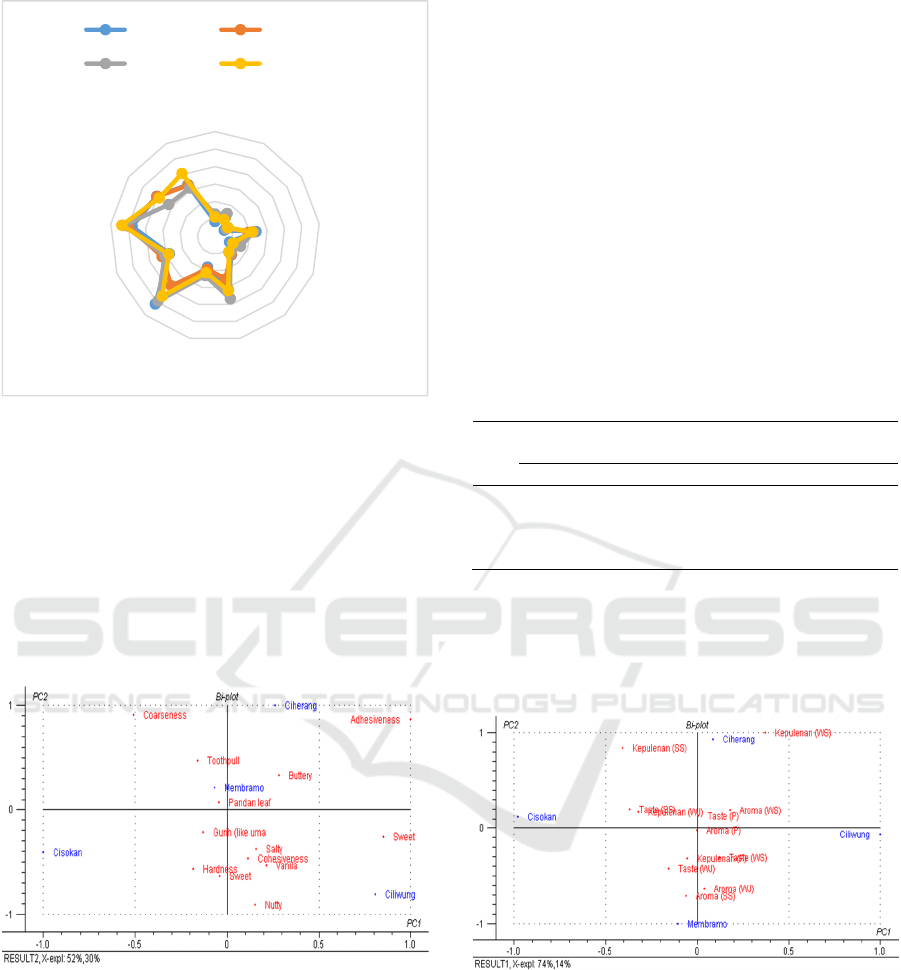
Figure 1: Spider web diagram of flavour characteristics
(taste, aroma and texture) of four varieties of Indonesian
rice. Taste: sweet, salty, gurih; Aroma: buttery, nutty,
pandan leaf, sweet, vanilla; Texture: adhesiveness,
hardness, cohesiveness, coarseness, toothpull.
and high taste. The second group was the Ciliwung
variety which was characterized by the highest
aroma, sweet, vanilla, nutty, and saltiness. The third
group contained Cisokan variety characterized by
attributes of particle size (coarseness) and sample
hardness when chewed.
Figure 2: PCA of flavour characteristics of four varieties of
Indonesian rice.
3.2 Consumer Preferences for Aroma,
Taste, and Texture Attributes
PCA analysis was conducted to find out how the
grouping of consumers' preferences of each region
towards rice from superior varieties of rice. The
consumer preference towards aroma of the rice was
relatively similar, the same case of the taste, except
for the consumer originally from South Sulawesi. The
preference towards kepulenan (toothpull) of the rice
was relatively different among the variety as well as
the consumer groups, as presented in Table 1.
Preference of consumers of West Java and South
Sulawesi were influenced by taste and texture of
cooked rice. The preference of the consumers was
taste and texture of cooked rice from Ciliwung. They
disliked taste and texture of cooked rice from
Cisokan. On the other hand, the consumers of West
Sumatra disliked taste, aroma, and texture of cooked
rice from Ciliwung. The consumers of Papua did not
have specific sensory characteristic in consumed
cooked rice. However, they disliked the aroma of
cooked rice from Ciherang.
Table 1: Consumer preference of four varieties of
Indonesian rice assessed by four groups of consumers based
on their origin.
Rice* West
Sumatera
West Java South
Sulawesi
Papua**
e*** f g e f g e f g e f g
A 3.5 4.1 4.6 3.3 4.0 4.5 3.4 4.2 4.6 4.1 3.9 3.5
B 3.3 4.0 3.9 3.7 4.6 5.3 4.1 5.1 5.3 3.8 3.9 4.2
C 4.0 4.5 5.3 3.9 4.0 4.0 3.9 3.6 3.6 3.8 3.9 4.0
D 3.3 4.3 3.7 3.8 4.4 4.5 4.0 4.2 4.1 4.1 3.8 3.8
*
A: Ciherang; B: Cisokan; C: Ciliwung; D: Membramo
**West Papua and Papua Provinces
***e = aroma, f = taste, g = kepulenan. Kepulenan is
someting to do with the texture of rice, the feel of softness
when the rice is chewed. The range of hedonic scale is
between 1 (extremely like) to 9 (extremely dislike).
Figure 3: PCA of preference of four groups of consumers
(WS: West Sumatera; WJ: West Java; SS: South Sulawesi;
P: Papua) towards aroma, taste and kepulenan (softness
during chewing) of four varieties of Indonesian rice.
Mapping consumer preferences by PCA is shown
in Figure 3, the PCA result described 88% of
variance. In overall, the consumer preference towards
the four varieties of the rice were different from each
other (Figure 3). Consumers of West Java and South
Sulawesi preferred the taste and texture of rice from
the varieties of Ciherang and Membramo. The
0
10
20
30
40
50
60
Sweet
Salty
Gurih (like…
Buttery
Nutty
Pandan leaf
SweetVanila
Adhesiven…
Hardness
Cohesiven…
Coarseness
Toothpull
Ciherang Cisokan
Ciliwung Membramo
2nd SIS 2019 - SEAFAST International Seminar
60

consumers rated the rice aroma attribute of Cisokan
variety with low preference. Consumers of West
Sumatra consumers had a low preference for taste,
aroma, and texture attributes of Ciliwung variety.
3.3 The Relationship between
Descriptive Analysis and
Preference Test
The regression of West Java consumer preferences
for the rice aroma attribute obtained by PLS analysis
gave the equation: Y = -2.02545 + 0.02959 Sweet +
0.06018 Nutty + 0.03096 Vanilla + 0.15595 Pandan
+ 0.05602 Buttery, R
2
= 0.9925. Based on the highest
regression coefficient, it can be seen that the aroma
that most influencing the preferences of West Java
consumers was the aroma of pandan (+: positive
correlation). Positive correlation shows the higher the
value of the regression coefficient, the higher the
consumer preference. The regression of the West Java
consumer preferences for rice taste attributes was: Y
= 3.72343 + 0.03651 Sweet - 0.08397 Salty + 0.1459
Tasty, R
2
= 0.8237. The taste attributes of rice that
most influencing the preferences were savory (+) and
salty (-). The regression for rice texture attributes
was: Y = -1.08993 - 0.02675 Adhesives + 0.02491
Hardness - 0.04067 Cohesive + 0.05317 Roughness +
0.0117 Toothpull + 0.10851 Particle Size, R
2
=
0.9999. The texture attributes of rice that most
influencing the preferences of West Java consumers
were the roughness and particle size or coarseness
(+), cohesiveness (-).
The regression of West Sumatra consumer
preferences for rice aroma attributes obtained by PLS
analysis gave the equation: Y = 3.30119 + 0.01801
Sweet + 0.06278 Salty - 0.01081 Savory R
2
= 0.3941.
The taste attribute of rice that most influencing the
preferences of West Sumatra consumers was the
saltiness (-). The regression for rice texture attributes
gave the equation: Y = 13,465 + 0.0391 Adhesives +
0.0335 Hardness - 0.0212 Cohesive - 0.0839
Roughness - 0.085 Toothpull - 0.0871 Size Particle,
R
2
= 0.9997. Rice textures that most influencing West
Sumatra consumer preferences were hardness and
adhesiveness (+) as well as particle size (-).
The regression of South Sulawesi consumer
preferences for the aroma of rice was: Y = 6.28051 -
0.01826 Sweet + 0.0348 Nutty + 0.03264 Vanilla -
0.06495 Pandan - 0.09552 Buttery, R
2
= 0.9926. The
aroma attributes that most influencing the preferences
of South Sulawesi consumers were vanilla and nutty
aroma (+); pandan and buttery (-). The regression for
rice taste attributes produced the equation: Y =
5.24163 + 0.02047 Sweet - 0.18608 Salty + 0.14613
Savory, R
2
= 0.3984. The taste attributes of rice that
most influencing the preferences of South Sulawesi
consumers were savory (+) and salty (-). The
regression for rice texture attributes was: Y = -
1,14137 - 0.02918 Adhesives + 0.02703 Hardness -
0.09234 Cohesive + 0.07943 Roughness - 0,00065
Toothpull + 0.14553 Particle Size, R
2
= 0.9999. The
texture attributes of rice that most influencing the
preferences of South Sulawesi consumers were the
roughness and particle size (+), cohesive (-).
Consumer Preferences of Papua had the
regression equation: Y = 5.28598 + 0.00487 Sweet -
0.04405 Nutty -0.00848 Vanilla -0.111188 Pandan +
0.033 Buttery, R
2
= 0.9930. The aroma attributes that
most influencing the preferences of Papuan
consumers were buttery (+) and pandan (-). The
regression for rice taste attributes was: Y = 6.18152 +
0.19746 Sweet -0.16674 Salty -0.3095 Savory, R
2
=
0.9296. The taste attributes of rice that most
influencing the preferences of Papua consumers were
sweet (+) and savory and salty (-). The regression of
Papuan consumer preferences for rice texture
attributes was: Y = 0.159004 -0.013738 Adhesives +
0.053877 Hardness + 0.024992 Cohesiveness -
0.017795 Roughness -0.007644 Toothpull +
0,044906 Particle Size, R
2
= 0.9998. The texture
attributes of rice that most influencing the preferences
of Papuan consumers were hardness and particle size
(+).
4 CONCLUSIONS
Rice from different rice varieties had different
specific characteristics. The results of qualitative
descriptive analysis on rice samples produced 14
attributes, namely the attributes of sweet, salty, and
gurih (savory) taste; vanilla, nutty, buttery, sweet, and
pandan aroma; attributes of adhesiveness, hardness,
cohesiveness, roughness, toothpull, and the size of
rice particles when chewed. The flavor characteristics
of the four varieties of rice were different to each
other, especially for the attributes of adhesiveness,
coarseness, toothpull, sweet and nutty aromas.
REFERENCES
Agustiani, N., Deng, N., Edreira, J. I. R., Girsang, S. S.,
Syafruddin, Sitaresmi, T., Pasuquin, J. M. C., Agus, F.,
Grassini, P., 2018. Simulating rice and maize yield
potential in the humid tropical environtment of
Indonesia. European Journal of Agronomy 101: 10–19.
Preference Study of Rice Obtained from Some Areas Which Represent the High Yielding Varieties of Rice in Indonesia
61

Aoki, K., Akai, K., Ujiie, K., 2017. A choice experiment to
compare preferences for rice in Thailand and Japan:
The impact of origin, sustainability, and taste. Food
Quality and Preference 56: 274–284.
Drake, M. A., Civille, G. V., 2003. Flavor Lexicons.
Comprehensive Reviews in Food Science and Food
Safety 2: 33–40.
Haryadi. 2008. Teknologi Pengolahan Beras. Gajah Mada
University Press. Yogyakarta.
Lioe, H. N., Selamat, J., Yasuda, M., 2010. Soy Sauce and
Its Umami Taste: A Link from the Past to Current
Situation. Journal of Food Science 75(3): 71–76.
Meilgaard, M., Civille, G. V., Carr, T. B., 1999. Sensory
Evaluation Techniques. CRC Press, 3rd Edition. New
York. 387 p.
Meullenet, J. F. C., Sitakalin, C., Marks, B. P., 1999.
Predicting of rice texture by spectral stress strain
analysis: a novel technique for treating instrumental
extrusion data used for predicting sensory texture
profiles. Journal of Texture Studies 30: 435–450.
Okpiaifo, G., Durant-Morant, A., West, G. H., Nalley, L.
L., Nayga Jr, R. M., Wailes, E. J., 2020. Consumers’
preferences for sustainable rice practices in Nigeria.
Global Food Security 24: 1–11.
Pratiwi, M., Faridah, D. N., Lioe, H. N., 2017. Structural
changes to starch after acid hydrolysis, debranching,
autoclaving-cooling cycles, and heat moisture
treatment (HMT): A review. Starch 68: 1–13.
[PUSLITBANGTAN] Pusat Penelitian dan Pengembangan
Tanaman Pangan, 2007. Deskripsi padi varietas
ciherang, ciliwung, cisokan, membramo.
http://pangan.litbang.deptan.go.id. [16 Agustus 2011].
Rumanti, I. A., Hairmansis, A., Nugraha, Y., Nafisah,
Susanto, U., Wardana, P., Subandiono, R. E., Zaini, Z.,
Sembiring, H., Khan, N. I., Singh, R. K., Johnson, D.
E., Stuart, A. M., Kato, Y., 2018. Development of
tolerant rice varieties for stress-prone ecosystems in the
coastaldeltas of Indonesia. Fields Crops Research 223:
75–82.
Tao, K., Yu, W., Prakash, S., Gilbert, R. G., 2019. High-
amylose rice: Starch molecule structural features
controlling cooked rice texture and preference.
Carbohydrate Polymers 219: 251–260.
Yuliawan, T., Handoko, I., 2016. The effect of temperature
rise to rice crop yield in Indonesia eses Shierary Rice
model with geographical information system (GIS)
feature. Procedia Enviromental Sciences 33: 214–220.
Zeng, Z., Zhang, H., Zhang, T., Chen, J. Y., 2008. Flavor
volatiles in three rice cultivars with low level of
digestible protein during cooking. Cereal Chemistry
85: 689–695.
2nd SIS 2019 - SEAFAST International Seminar
62
