
Analysis of the Sw-420 Vibration Sensor Performance on Vibration
Tools by using a Fuzzy Logic Method
Ikhwan El Akmal Pakpahan, Poltak Sihombing, and Mahyuddin K. M. Nasution
Informatics Engineering, Faculty of Information Technology and Computer Science, University of North Sumatera, Medan,
Indonesia
Keywords: Arduino uno, fuzzy logic, sw-420, vibration analysis, vibration sensor.
Abstract: Vibration sensor Sw-420 is one of the most widely used sensor modules because it is easy to learn and to
install. This sensor is also compatible with Arduino Uno microcontroller board. This sensor has two types of
output, namely digital output (0/1) and analog output (voltage). However, for specific purposes such as
security and industry, more than just vibration detection is needed. The system used must be smart to
distinguish vibrations due to errors / damage or just technical / accidental errors. The vibration received by
the sensor must be classified properly. In this study, the fuzzy logic method as a decision support system to
help determine the appropriate vibration classification was applied. The reason for using the fuzzy logic
method was that it is flexible, easy to understand, and is able to produce values that are more specific than
just 0 and 1 values according to the needs of the SW-420 vibration sensor. With the fuzzy logic method, it
can be seen that the sensor can classify vibrations into 5 levels, very weak, weak, moderate, strong and very
strong.
1 INTRODUCTION
Vibration is something that is often found in everyday
life. When an object vibrates, it affects not only the
object itself but also the objects around it. Apart from
physical contact, a vibration can also be detected from
the sound generated through the vibration. This
happens because these vibrations create friction for
the surrounding objects and the object itself. Through
a vibration, information about what is happening with
the object can be received so that humans can
estimate the possibility of what is happening due to
these vibrations.
The vibrations that occur will have different
effects on different objects. A large tremor on the side
of a cross-city road may not have a significant effect
as it is common (many large capacity cars pass). But
vibrations of that magnitude would be a big problem
if they happened under a quiet house and away from
the streets. Because it requires a system or a tool to
classify the vibrations that occur in order to determine
whether the vibration is a problem that needs to be
resolved or not and how to solve it.
For many years, Fuzzy Logic has been considered
as a control algorithm with The Fuzzy Logic
Controller. This controller has been widely utilized
for the active vibration control of engineering
structures. The capability of using fuzzy control
strategies in vibration control of civil engineering
structures with active control systems was established
by focusing on the seismic response of frame
structures due to multiple earthquake records with an
active mass driver system as a control device on the
top story Azizi. M., Ejlali. R. G., Ghasemi. S. A. M.,
Talatahari. S. (2019).
Research by Julio Fajar Saputra, et al. (2018)
show the advantages of using LoRa (Long Range)
connections for wider distances. LoRa-based data
communication testing uses LOS and NLOS
scenarios, data emergence is measured using a web
data center. The drawback is that it requires greater
costs and more complex programming because it uses
two microcontrollers, namely Arduino Uno and
Raspberry Pi.
Widya Purnamasari and Romi Wijaya's (2017)
research shows the advantages of using more than one
sensor to increase security as well as a way to monitor
which parts of the vibration are detected. This system
is also equipped with a database that is useful for
storing data and processing time. The drawback lies
in the use of a PC for monitoring. PC is not a device
that has high mobility so it will indirectly force users
Pakpahan, I., Sihombing, P. and Nasution, M.
Analysis of the Sw-420 Vibration Sensor Performance on Vibration Tools by using a Fuzzy Logic Method.
DOI: 10.5220/0010336000003051
In Proceedings of the International Conference on Culture Heritage, Education, Sustainable Tourism, and Innovation Technologies (CESIT 2020), pages 543-550
ISBN: 978-989-758-501-2
Copyright
c
2022 by SCITEPRESS – Science and Technology Publications, Lda. All rights reserved
543

to stay around the PC to monitor the house. PC also
requires a lot of power so it will require additional
costs for electrical power in case of a power cut
(difficult for users to monitor the system).
Poltak Sihombing, Jos Timanta Tarigan et al.
(2019) presents a security system that offers better
efficiency. It has the ability to identify when an
intruder enters the warehouse and send reports to
registered users via short message service (SMS).
Information is based on vibration and infrared to
detect intruders. They specifically use the Raspberry
Pi as the system microcontroller because of its ease of
use. In the test case, they implemented a security
system built into the warehouse and observed the
effectiveness of the system in detecting intruders.
They test several possible methods of intruders to
enter the warehouse and log system responses. The
results show that the system has recorded the incident
effectively and sent a report via SMS to registered
users. The difference in average time between an
intrusion event and a notification received by a user
is 5 to 10 seconds.
In the research of Ikhwan El Akmal Pakpahan
(2017) it has advantages, namely the monitoring
process using a smartphone which can increase user
mobility and minimize the possibility of users not
hearing alarms sounding (alarms do not only come
from bells but also from smartphones).
From this research, the author wants to develop
the research of Ikhwan El Akmal Pakpahan by adding
a fuzzy method so that the resulting system is better
at monitoring existing vibrations as well as analyzing
the fuzzy logic method on the SW-420.
2 METHODOLOGY
2.1 Research Methodology
In this study, the capabilities of the SW-420 vibration
sensor with the fuzzy logic method so that the
received vibrations can be classified into 5 parts,
namely very weak, weak, moderate, strong, and very
strong are developed. To aid in vibration
classification, an algorithm for determining whether
a received vibration is valid or accidental is
constructed. This then becomes one of the 2 factors
that determine the type of vibration classification
received by the sensor.
2.2 Research Design
In this study, the fuzzy logic method as a decision
support system to divide the classification of
vibrations received by the sw-420 vibration sensor
based on two variables (namely the average value of
analog data and the total data filled with vibration
values from the 15 data slots provided) was applied.
The following is the research design process:
1. Analyze the maximum value of analog data
input that can be received by the sw-420
vibration sensor.
2. Adjust and adjust the sensitivity of the sensor
to received vibrations.
3. Applying the fuzzy logic method to the
Arduino Uno microcontroller connected to the
sensor.
4. Analyze the results obtained by the vibration
sensor after adding the fuzzy logic method as a
decision support system.
2.3 Research Stages
The stages of the research to be carried out can be
seen in Figure 1.
Figure 1: Research Stages.
The stages of the research to be carried out can be
seen in Figure 1. Figure 1 is the stage carried out in
the research: the first stage was to determine the
Background, Formulation of the
Problems and Objectives
Data Collection
Fuzz
y
Lo
g
ic Anal
y
sis
Fuzzyfication
Inference Process
Defuzz
y
fication
Analysis of Utilizing Fuzzy
Tsukamoto
Conclusion
CESIT 2020 - International Conference on Culture Heritage, Education, Sustainable Tourism, and Innovation Technologies
544

background of the reasons for conducting the
research, formulate some things that have been done
and make the goals to be achieved. Furthermore, the
data were collected to be processed using fuzzy logic
with the Tsukamoto method. The second stage was
fuzzification and performs an inference process from
the data that has been obtained for testing using the
applied Tsukamoto method. In the last stage, test
results and conclusions are obtained.
2.4 System Design
In system design, the system that has been designed
will be described and explained including the steps
that must be taken so that the system runs as desired,
starting from sensor detection, sending data from the
sensor to the microcontroller to the output after being
classified by the fuzzy logic method.
The Arduino Uno vibration sensor and
microcontroller communicate using a jumper cable
on the specified port. Meanwhile, to display the
results of vibration classification with fuzzy logic as
a decision support system, Arduino Uno was
connected to a laptop / PC. Furthermore, the Arduino
IDE application results of vibration classification can
be seen on the serial monitor.
The following are the stages of system design
being developed:
1. Initially, the Sw-420 vibration sensor data was
received by the Arduino Uno Microcontroller.
2. The data was classified into several parts, such
as analog data with a value of more than 10 will
be entered and processed in the variable
"content data". When the total sensor data
received has reached 15 data, the results of the
average value are accommodated in the "analog
data" variable.
3. After the required data is sufficient, the next
step was to determine the degree of
membership, namely determining whether the
data is included in a certain membership or not.
4. The next step was to calculate the predicate of
the rule in the form of calculations performed
to determine the predicate of the received data
rule.
5. Defuzzification was the process of converting
data from fuzzy data to real data.
6. The final step was to display the results of the
data classification from the vibration sensor.
2.5 Flowchart
The steps of the program process can be seen in
Figure 2.
Start
Initializationof
inputdata
ifdatagetar>1
F
Tambahgetar+=
datage tar ,
Hitung+=1
T
Initializationof
inputdata
Ifdatagetar>10
Dataisi+=1
Ifhit ung== 16
F
T
Hitung=0;
Dtotalgetar=
totalgetar/15
Totalgetar=0;
F
T
Ifdtotalgetar<=
50
Serial.println=
“Tidakterdeteksi
getaran”
Elseif
dtotalgetar<50‐
250
Elseif
dtotalgetar>250
‐300
T
F
T
F
Serial.println=Data
terklasifikasi
RENDAHkurva
PUNCAK
(X1&X2=1)
Serial.println=Data
terklasifikasi
RENDAH_KT&
SEDANG_KN
Elseif
Dtotalgetar
>300‐550
Serial.println=Data
terklasifikasiTINGGI
kurvaPUNCAK
(X1&X2=1)
Elseif
dtotalgetar>550
‐600
Serial.println=Data
terklasifikasi
Tinggi_KT&
BESAR_KN
Elseif
dtotalgetar>600
Dataterkl asif ikasi
TINGGIkurva
PUNCAK
(X1&X2=1)
Else=
pri nt(“dtotal getar”)
GTR
T
F
T
F
X1=(d‐x)/(d‐c)
X2=(x‐a)/(b‐a)
X1=(d‐x)/(d‐c)
X2=(x‐a)/(b‐a)
T
F
T
F
Figure 2: Flowchart.
2.6 Arduino Uno
Arduino Uno, an open-source platform, accounts for
the data acquisition hardware in our toolbox.
Different types of connection ports, including digital
input/output, PWM output, UART TTL (5V) serial
communication, and analog input, make the Arduino
Uno board powerful and cost-effective hardware for
data collection purposes. The Arduino Uno board has
an Atmel ATmega328 microcontroller which can be
Analysis of the Sw-420 Vibration Sensor Performance on Vibration Tools by using a Fuzzy Logic Method
545
programmed in C/C++ language through an
integrated development environment (IDE).
Regulated 5 V and 3.3 V outputs can be obtained from
the Arduino board to provide the supply voltage for
particular sensors. The Arduino Uno supports 6
analog input pins that read data in the range of 0–5V
with the resolution of 10 bits (Karami. M.,
McMorrow. G. V., Wang. L., 2018).
2.7 Vibration Sensor
A vibration sensor is a sensor that can measure the
vibration of an object whose data will be processed
for experimental purposes or used to anticipate a
possible danger. It has measurement accuracy and
increasing the sensitivity range. One type of vibration
sensor is the SW-420 sensor (Deviana. H, Amin. M.
M., Sandy R., et al., 2019).
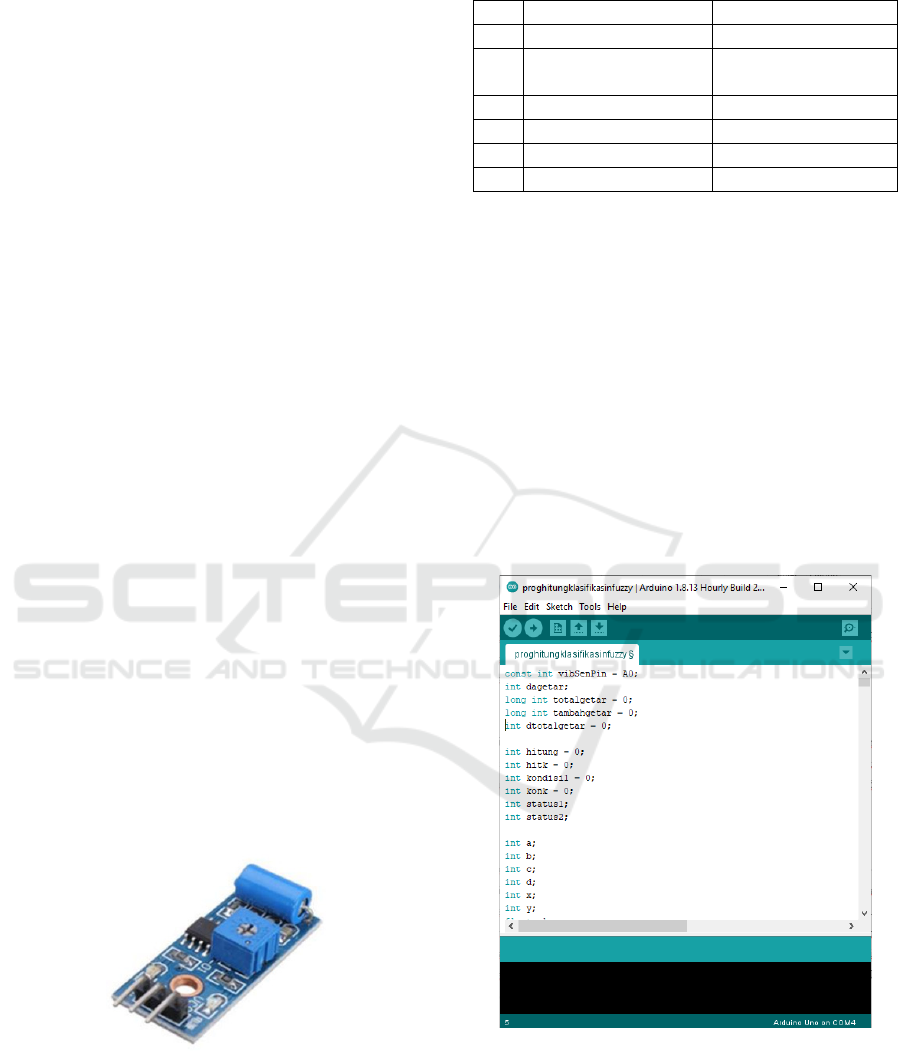
2.8 SW-420 Vibration Sensor
In this study the SW-420 series was used as a research
variable. SW-420 is a vibration sensor that can detect
vibrations from various angles. When the sensor does
not receive vibrations, the electronic components of
the sensor will function as a switch and will be closed.
Meanwhile, when the sensor receives a vibration /
shock, the switch will open and close at the transfer
rate following the vibration (Siahaan. A.O, 2017).
This module features an adjustable potentiometer,
a vibration sensor, and an LM393 comparator chip to
give an adjustable digital output based on the amount
of vibration. The potentiometer can be adjusted to
both increase and decrease the sensitivity to the
desired amount (Jagdale. S. B., Sali. M. R., Kulkarni.
S. D. et al., 2019).
Image of the SW-420 vibration sensor can be seen
in Figure 3:
Figure 3: SW-420 vibration sensor.
This circuit receives vibrations through a metal
buoy inside the sensor. It also has 2 types of output,
namely: digital output (based on values 0 and 1) and
analog output (value is in the form of received
voltage).
Table 1: SW-420 sensor specification.
No Specification Information
1 Volta
g
e use
d
3,3V DC
–
5V DC
2 Output Digital (0 and 1)
Analo
g
3 Sensor size 3,2 cm x 1,4 cm
4 Detection distance 760 nm
–
1100 n
m
5 Detection an
g
le 60 de
g
ree
6 Si
g
nal 15mA
2.9 Software Implementation on the
Sensor
Arduino Uno programming can be operated using the
Arduino IDE. If Arduino can be likened to a brain,
then Arduino IDE is the mindset. Through this
application, we can adjust the Arduino Uno according
to the user's wishes. However, there are several steps
that we must do before we can use the program based
on what is written in it. The first step is writing the
program, then compiling the program and uploading
the program to Arduino Uno using the provided USB
cable.
Image of the implementation on the sensor can be
seen in Figure 4:
Figure 4: Arduino IDE application.
2.10 Testing Instrument
Data obtained through the SW-420 vibration sensor
will be processed in a microcontroller using fuzzy
logic methods. Thus the received vibration
classification degree will be generated. Furthermore,
CESIT 2020 - International Conference on Culture Heritage, Education, Sustainable Tourism, and Innovation Technologies
546

based on the results of data processing on fuzzy logic
classification of vibration levels is obtained.
Figure 9 shows the appearance of the application
using the built fuzzy inference system. In the
application display, the SW-420 sensor automatically
sends data to the Arduino Uno microcontroller when
it detects a vibration. Figure 5 shows the application
test display.
Figure 5: Display of Application Testing.
2.11.1 Input Variable Data Analog
The analog data variable provides information about
the average value received from the fifteen incoming
data from the SW-420 vibration sensor to the Arduino
Uno microcontroller. This data is used to determine
the number of detected vibration values so that it can
facilitate the classification to determine the degree of
vibration detected. The input data can be seen in
Figure 6:
Figure 6: Display of Analog Data Variable Input.
2.11.2 Input for Content Data Variable
The data content variable is a variable that functions
to accommodate the amount of data received from the
SW-420 vibration sensor. Therefore, every fifteen
data entry can be determined how many values
contain vibration values and what values do not detect
these vibrations. This makes classifications for
determining vibration levels easier to create. The
display of the data content variables can be seen in
Figure 7.
Figure 7: Display of Filled Data Variable Input.
2.11.3 Identify Set Value
Before using the fuzzy logic method, determining the
value of the data to be processed must be calculated
first by determining the value of each set. The image
of the analog data set input value is shown in Figure
8.
Figure 8: Value of Analog Data Set.
Data from the SW-420 vibration sensor will
automatically enter the microcontroller and pass
through the Arduino IDE software in the Serial
Monitor section. We can see the incoming data
directly when one by one the data is processed and
calculated until the required amount of data is
reached. Then the program will determine the average
value of the data. Based on this data, the value is then
determined into which category set.
2.11.4 Final Classification
The final step is taken to convert the fuzzy data into
easy-to-understand data, in this case it means
displaying the final classification of vibrations that
have been received and processed by the Arduino
Uno microcontroller. The classification results can be
in the form of very weak, weak, moderate, strong, and
very strong vibration statements. Figure 9 shows a
display of final vibration classification results.
Analysis of the Sw-420 Vibration Sensor Performance on Vibration Tools by using a Fuzzy Logic Method
547
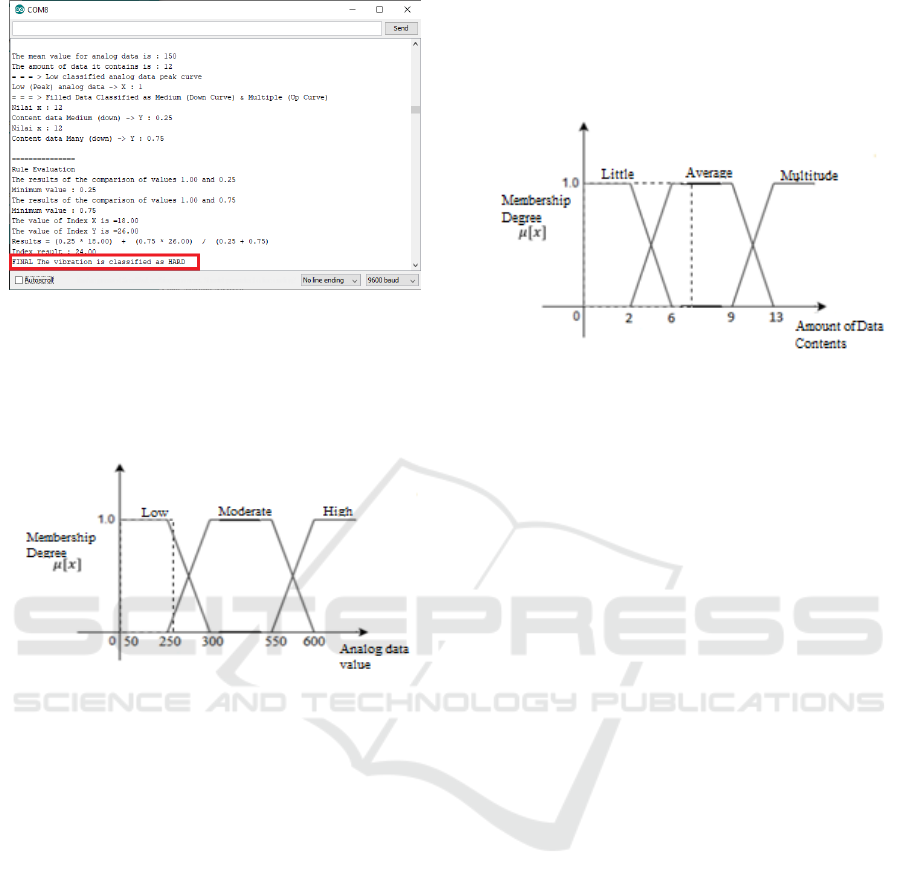
Figure 9: Final Classification.
2.11.5 Fuzzy Logic Method Analysis
In calculating fuzzification manually, 251 analog
input data and 7 content data can be taken as an
example.
Figure 10: Analog Data Membership.
As shown in Figure 11, the analog data value 251
is included in the low (lower curve) and medium
(upper curve) set. The membership degree value can
be written as follows:
Low set (down curve)
µ [x]= 0; x ≤ a or x ≥ d
(x-a) / (b-a); a < x ≤ b
1; b < x ≤ c
(d-x) / (d-c); c < x < d
µ [x] = (d-x) / (d-c); c < x < d
= (300-251)/ (300-250);
= 49 / 50
= 0,98
Moderate set (up curve)
µ [x] = 0; x ≤ a or x ≥ d
(x-a) / (b-a); a < x ≤ b
1; b < x ≤ c
(d-x) / (d-c); c < x < d
µ [x] = (x-a) / (b-a); a < x ≤ b
= (251-250) / (300-250);
= 1 / 50
= 0,02
Thus the set of µ analog data values obtained is
(0.98, 0.02, 0) or µ low [251] = 0.98, µ is medium
[251] = 0.02.
Figure 11: Content Data Membership.
It can be seen in Figure 12 that the value of 7 is on
a medium curve (peak), so the degree value can be
written as follows:
µ [y] = 0; x ≤ a or x ≥ d
(x-a) / (b-a); a < x ≤ b
1; b < x ≤ c
(d-x) / (d-c); c < x < d
Since the value 7 is at the vertex of the moderate
set, the formula is that x is less than b and x is less
than c, so the y value is 1.
µ [x] = 1 ; b < x ≤ c
µ [x] = 1.
So the set of µ is obtained (0,1,0). After the µ of the
two inputs is obtained, the next step is entering into
rule evaluation with the minimum comparison
method. The minimum comparison is obtained as
follows:
µ (x ∩ y) (1) = min [µ x [Low] ∩ µ y [Moderate]]
= min (0,98 ; 1)
= 0,98 (Low)
µ (x∩ y) (2) = min [µ x [Moderate] ∩ µ y [Sedang]
= min (0,02 ; 1)
= 0,02 (Low)
3 RESULTS AND DISCUSSIONS
After the minimum comparison implications have
been obtained, the final step is defuzification using
the center of single-ton method.
CESIT 2020 - International Conference on Culture Heritage, Education, Sustainable Tourism, and Innovation Technologies
548

Table 2: Rule Evaluation Fuzzy.
Amount
of Data
Content
Analog
Data
Value
Little
(0)
Average
(1)
Multitude
(0)
Low
(0,98)
Average
(0)
Multitude
(0.98)
Multitude
(0)
Moderate
(0,02)
Little
(0)
Little
(0.02)
Multitude
(0)
High
(0)
Little
(0)
Slight
(0)
Average
(0)
decision index = (0.98x8) + (0.02x18) / (0.98+0.02)
= (7.84 + 0.36) / (1)
= (8.2 / 1)
= 8.2 (Measly)
From the results of the theory that has been done,
and is referred to in the vibration level classification
table, the vibration level status is said to be in the very
small category.
Following are the results of testing the vibration
level with digital data without using the fuzzy logic
method:
Table 3: Test Results with Vibration Level Digital Data
Without Fuzzy Logic Method.
Sensor condition Information
0
No vibration detected
1
Vibration Detected
Based on the data obtained above, it can be
concluded that by using digital input data, the data
that can be generated by the sensor is only the
presence or absence of a detected vibration and does
not at all describe and produce a large level of
vibration received by the sensor.
Following are the results of testing the vibration
level with analog data without using the fuzzy logic
method:
Table 4: Vibration Level Test Results with Analog Data
Without Fuzzy Logic Method.
Data Mean Value Classification Results
0-299 Very weak
300-349 Weak
350-599 Medium
600-649 Stromg
650-700 Very strong
Based on the research that has been carried out to
build an algorithm with the support of the fuzzy logic
method, the data generated by the SW-420 vibration
sensor can produce a better classification than without
the fuzzy logic method. By adding the input data used
as the determining variable for vibration
classification, it can be said that digital and analog
data can be utilized properly with maximum work.
Previously, digital data was only able to receive
binary data, namely 0 and 1, which were received by
the sensor so that the sensor could only produce 2
classifications, namely vibration detection and
vibration detection without vibration magnitude
classification. Whereas the previous analog data was
able to receive a vibration level with values ranging
from 0-> 700. However, classification by only
utilizing a range of vibration values has drawbacks
such as a difference of 1 certain value in a condition
can affect the results of the classification of vibrations
which are considered unfair. For example 1-99 is a
small vibration and 100-200 is a moderate vibration.
The distance between 99 and 100 is only 1 but even
so the vibration will result in a different classification,
this is considered ineffective and can cause
countermeasures error depending on the type of
vibration sensor system applied. With the fuzzy logic
method, the vibration classification can be done better
and reduce the risk of data errors, so that the cause
and effect that will be carried out from the vibration
will be more targeted and effective.
4 CONCLUSIONS
Based on the research that has been done, several
conclusions are described as follows:
Fuzzy logic method can be used for
classification needs of data taken from the SW-
420 vibration sensor using the Arduino Uno
microcontroller.
Analysis of the Sw-420 Vibration Sensor Performance on Vibration Tools by using a Fuzzy Logic Method
549

The use of delay on the sensor can result in data
not being successfully received because the
sensor may detect data while it is still in the
delay process.
With the fuzzy logic method, the resulting data
will be more accurate and can take into account
the many variables that determine the results of
a data.
REFERENCES
J. F. Saputra, M. Rosmiati, And M. I. Sari., 2018,
"Prototype Development of Earthquake Vibration
Monitoring System Using Sensor Module SW-420,"
Vol. 4, No. 3, pp. 2055–2068.
W. And R. W. Purnamasari., 2017, "Home Security
Systems Using Vibration Sensors With Pc-Based
Sound Output," J. Manaj. And inform. Pelita Nusant.,
Vol. 21, No. 1, P. 59.
I. E. A. Pakpahan et al., 2017, "Portable Security Devices
with Alarms Using an Arduino Uno Based Vibration
Sensor,".
P. Sihombing, J. T. Tarigan, B. Ginting, And D. Sitompul.,
2019, "Security Systems Based on Vibration and Infra-
Red Sensors Using Raspberries," Vol. 11, No. 1, pp.
11–16.
A. O. Siahaan, Harianto and P. Susanto., 2017, "Design and
Application of Practice Test Evaluation for Driving
License (C) Based on Arduino Mega 2560" JCONES
Vol. 6, No. 2, pp. 10-20.
M. Azizi, R. G. Ejlali, S. A. Mousavi Ghasemi, and S.
Talatahari., 2019. “Upgraded Whale Optimization
Algorithm for fuzzy logic based vibration control of
nonlinear steel structure,” Eng. Struct., vol. 192, no.
April, pp. 53–70.
M. Karami, G. V. McMorrow, and L. Wang., 2018.
“Continuous monitoring of indoor environmental
quality using an Arduino-based data acquisition
system,” J. Build. Eng., vol. 19, no. April, pp. 412–419.
S. B. Jagdale and M. R. Sali, “Earthquake Detection Using
IOT,” vol. 4, no. 4, pp. 49–54, 2019.
H. Deviana, M. Miftakul Amin, R. Sandy, P. T. Nguyen,
W. Hashim, and A. Maseleno., 2019. “Door security
design using radio frequency identification with a short
message service warning system,” Int. J. Recent
Technol. Eng., vol. 8, no. 2 Special issue 2, pp. 354–
370.
CESIT 2020 - International Conference on Culture Heritage, Education, Sustainable Tourism, and Innovation Technologies
550
