
A Data Quality Assessment Approach in the SmartWork Project’s
Time-series Data Imputation Paradigm
Georgios Papoulias
a
, Otilia Kocsis
b
and Konstantinos Moustakas
c
Department of Electrical and Computer Engineering, University of Patras, Greece
Keywords:
Data Quality, Missing Data, Time-series Imputation.
Abstract:
The plethora of collected data streams of the SmartWork project’s sensing system is often accompanied by
missing values, yielding the need for estimating these missing values through imputation, which may prove
unnecessary or computationally expensive in relation to the outcome. This work introduces a data quality
assessment approach that allows for decision making regarding the need/efficiency of data completion in order
to save system computational resources and ensure quality of imputed data. Preliminary validation of the
proposed approach is performed by assessing the correlation between the proposed data quality assessment
scores and the normalized mean square error of the imputation on various simulated missing patterns. The
results reinforce our initial hypothesis that the suggested score is a suitable data quality indicator, correlating
well with the potential errors introduced by imputation in the case of a given batch of input data.
1 INTRODUCTION
The continuous collection of large data
amounts(Labrinidis and Jagadish, 2012)(Sagiroglu
and Sinanc, 2013)(George et al., 2014) coming
from heterogeneous sources (i.e. devices) is often
accompanied by missing entries, which need to be
handled owing to the uncertainty they introduce in
decision-making systems(Zhang, 2015). In such
cases, an imputation algorithm responsible for
estimating the missing values is required, especially
when the time-series acting as input are employed
for the derivation of other crucial parameters or in
predictive tasks. However, the imputation might
prove to be unreliable in certain cases and, given
the additional computational cost, it is important to
establish whether it is efficient or not to perform
data imputation(Cai and Zhu, 2015). In particular,
in the scope of the SmartWork project (Kocsis et al.,
2019b)(Kocsis et al., 2019a), in which the risk factor
investigation (Fazakis et al., 2021)) and subsequent
robust estimation of office workers’ work ability
(Kocsis et al., 2021) is conducted by using contin-
uous data acquired by various monitoring devices
(e.g. FitBit activity tracker, a smart mouse, office
environment quality sensors, etc.), the quality of data
a
https://orcid.org/0000-0003-2518-1904
b
https://orcid.org/0000-0001-6937-6442
c
https://orcid.org/0000-0001-7617-227X
estimated through imputation may be critically im-
portant for decision making(Nousias et al., 2018). In
other words, poor quality of the input data might lead
to low data imputation accuracy and, subsequently,
render the system prone to serious decision-making
mistakes(Guan and Stephens, 2008). Thus, the
motivation behind the introduction of the proposed
algorithm is two-fold: first, to guarantee that, as long
as it has been performed, imputation is reliable and,
second, to save us from spending rather useless com-
putational time performing imputation on suspicious
data quality.
In the context of the SmartWork project imple-
mentation, a data quality assessment module was in-
troduced as part of the Data Imputation module in or-
der to support decision making on whether the exe-
cution of an imputation algorithm on a given batch
of input data is worth to be performed and to provide
a quality score for the data values estimated through
imputation. Data quality, though, is a multidimen-
sional concept, as elaborated on in the next section,
thus difficult to evaluate from a plethora of viewing
aspects, such as completeness, consistency and accu-
racy as defined in (Batini et al., 2009)(Pipino et al.,
2002). Hence, the compound nature of data quality
led us to decide not to evaluate it as an entity but
to adapt and target our assessment algorithm at the
singularities of the data completion paradigm. De-
pending on the imputation approach selected, namely
Papoulias, G., Kocsis, O. and Moustakas, K.
A Data Quality Assessment Approach in the SmartWork Project’s Time-series Data Imputation Paradigm.
DOI: 10.5220/0010719000003063
In Proceedings of the 13th International Joint Conference on Computational Intelligence (IJCCI 2021), pages 453-459
ISBN: 978-989-758-534-0; ISSN: 2184-3236
Copyright © 2023 by SCITEPRESS – Science and Technology Publications, Lda. Under CC license (CC BY-NC-ND 4.0)
453

a single-channel or a multi-channel imputation algo-
rithm, the suggested algorithm performs data quality
assessment either for each data channel individually
or for all input channels combined, respectively. Both
approaches derive a single quality score for the input
data, reflecting their imputability.
2 RELATED WORK
Data quality was summarized from ISO 25012 as ’the
capability of data to satisfy stated and implied needs
when used under specific conditions’(Taleb et al.,
2016) and, in simpler words, as ’fitness for use’ in
(Cai and Zhu, 2015), whom postulate data quality de-
pends on a plethora of factors, including (at least) the
purpose for which the data are being used, the user,
the time etc. In different settings, data quality may
depend on various factors such as accuracy, timeli-
ness, completeness, relevancy, objectivity, believabil-
ity, understandability, consistency, conciseness, avail-
ability and verifiability. All these quality dimensions,
also known as characteristics of the dataset, affect-
ing data quality assessment are directly relevant to the
consumer or, otherwise, the purpose of use.
In the Big Data era, measuring data quality has
turned into a compound process. A quantitative as-
sessment method, is a formal, objective and system-
atic process in which numerical data are utilized to
obtain information. Therefore, objectivity, general-
izability and numbers are features often associated
with this type of methods, whose evaluation results
are more intuitive and concrete.
The data quality assessment involves measuring
the quality dimensions(Pipino et al., 2002) that are
relevant to the user and comparing the assessment
results with the users’ quality requirements. Each
quality dimension needs different measurement tech-
niques, which leads to differences in assessment times
and costs. After having explicitly defined the data di-
mensions of interest, a data quality assessment metric
is opted for each dimension, or more of them simulta-
neously. However, the literature does not provide an
exhaustive set of easily applicable metrics (Cappiello
et al., 2004). Additionally, the algorithms concerned
with these metrics’ calculation focus exclusively on
data values but do not consider the specialized use of
data. However, owing to the fact that data quality is an
abstract concept (Pipino et al., 2002), thus feasible to
assess only in a specific context, it is difficult and un-
necessary to examine it from all aspects at the same
time. Thus, these metrics are heuristics designed to
fit a specific assessment situation. Therefore, when
it comes to data quality assessment, it is essential to
explicitly define the context of the evaluation.
To this end, metrics are categorized in Task-
dependent metrics, namely a metric developed in spe-
cific application contexts, satisfying constraints im-
posed by the database architecture as conceptualized
in (Taleb et al., 2016) as opposed to Task-independent
metrics, which reflect states of the data without the
contextual knowledge of the application, and can be
applied to any dataset.
In the modern era, extra challenges arise from the
huge data size and speed of generation such as the
reduction of the assessments’ computational burden.
Thus, evaluation schemes applying sampling strate-
gies on large datasets were introduced (Taleb et al.,
2016), while maintaining completeness and accu-
racy(Zaveri et al., 2016), dimensions considered crit-
ical for medical applications as postulated by (Cai
and Zhu, 2015). In the data imputation paradigm,
we are mostly interested in ‘property completeness’,
which reflects the measure of the missing values for a
specific property. Our hypothesis that the quality is-
sues emerging from the data missingness as concep-
tualized in (Batini et al., 2009) are mostly related to
those two data quality dimensions, namely accuracy
and completeness, is clearly confirmed in (Taleb et al.,
2016).
To develop an illustrative metric for important
data quality dimensions in practice, three principal
functional forms can be employed: simple ratio, min
or max operators and weighted average as described
in (Pipino et al., 2002). Additionally, the type of
data to be evaluated equally affects the quality eval-
uation metrics. The contingent types of data could be
Content-based, Context-based and Rating-based. In
Content-based metrics, the information itself is used
as quality indicators, while in Context-based metrics
meta-data is employed for this purpose. Finally, in
Rating-based metrics, both the information and the
sources of information are exploited (Taleb et al.,
2016). In the data completion paradigm, the type of
data is purely Content-based.
3 PROPOSED APPROACH
We aimed to establish an objective Task-dependent
data quality metric, the conceptualization of which
is based on principles of data imputation, especially
when it comes to multi-channel imputation schemes,
taking advantage of the correlation observed between
timeseries coming from different data channels. The
principal data quality indicator taken into considera-
tion for the calculation of the suggested score is com-
pleteness ((Zaveri et al., 2016), (Pipino et al., 2002)),
SmartWork 2021 - 2nd International Workshop on Smart, Personalized and Age-Friendly Working Environments
454

expressed primarily by the missingness percentage, in
the single channel paradigm, and by additional esti-
mated quantities in the multi-channel paradigm. Ow-
ing to the different kind of information available in
each of those two individual cases, a different formula
for each paradigm is proposed.
Considering the profound dependence of the data
quality score on the percentage of missing values de-
tected in a given temporal sequence of data as well as
the maximum number of consecutive missing values
observed in the time-series, the formulas employed
for the data quality score include all terms required to
express this dependency.
3.1 The Single-channel Imputation Case
For the single-channel imputation case, it is important
to provide a definition for the term ‘single channel
score’. Single channel score refers to an evaluation
connected to a single channel imputation approach.
To assess whether the imputation process is meaning-
ful for a given set of input data consisted of a number
of distinct channels, the imputability of each distinct
data channel is evaluated individually and is estimated
through the formula:
IS =
1
missPerc
×
timeseriesLength
maxCons
(1)
where missPerc stands for the number of missing val-
ues of the input data compared to the overall length
of the timeseries, maxCons stands for the maximum
number of consecutive missing values of the time-
series and IS stands for the imputability score. This
approach was adopted due to the fact that imputa-
tion methods struggle to deal with big blocks of miss-
ing data, thus we penalize large blocks of missing
data through the data quality score. The greater the
missing block of maximum size is, the lower the im-
putability score is. Additionally, the smaller the per-
centage of missing data is in the data channel, the
higher its imputability score is.
3.2 The Multi-channel Imputation Case
For the multi-channel imputation paradigm, we
adopted a slightly different approach owing to the fact
that imputation methods of this type are capable of
exploiting the correlations observed across different
data channels in order to perform the imputation more
effectively. R
xx
is a zero-diagonal symmetric correla-
tion matrix where r
i j
is the correlation between i-th
and j-th channel.
R
xx
=
r
x
1
x
1
r
x
1
x
2
. . . r
x
1
x
N
r
x
2
x
1
.
.
.
.
.
.
.
.
.
.
.
.
r
x
N
x
1
. . . r
x
N
x
N
(2)
Let (X
r
, ≤) be the ordered set X
r
= { x|x ∈ R
xx
} con-
taining the elements or R
xx
. Then X
r
i
(n) is the correla-
tion of channel i with the highest correlated of the rest
of the channels and X
r
i
(n − 1) correlation of channel
i with the second highest correlated of the rest of the
channels.
Hence, the formula employed to assess the ex-
pected quality of the results a multiple-channel im-
putation method yields is the one that follows
IS =
c
∑
i=1
(
1
m
i
+ 200 · X
r
i
(n) ×
N
1
i
N
Tot
i
+100 · X
r
i
(n − 1) ×
N
2
i
N
Tot
i
)
(3)
where c is the number of channels, m
i
is the percent-
age of missing values, N
1
i
is the number of missing
values of the reference channel i corresponding to le-
git values in the channel with which it is the most cor-
related among the other channels and N
2
i
is the sec-
ond highest number of missing values of the reference
channel i corresponding to legit values in the channel
with which it is the most correlated among the other
channels. N
Tot
i
stands for the overall number of miss-
ing values recorded in channel i.
In this way, apart from the missingness percentage
of each channel, we exploit the knowledge provided
by the inter-correlations between data channels as it
is certain that a channel with a given number of miss-
ing values will be more efficiently imputed in a multi-
channel imputation setting when the highest corre-
lated channel’s values corresponding to the missing
values of the reference channel are not missing. Us-
ing the same line of reasoning, we also included in the
calculation of the score a respective term for the sec-
ond highest correlated channel, only with a reduced
value for the weighting term since it is only rational
that the highest correlated channel of each reference
channel outweighs the second one.
4 EXPERIMENTAL EVALUATION
Regardless of the selected imputation approach (i.e.
single or multi-channel imputation) and the corre-
sponding type of quality assessment, namely all
A Data Quality Assessment Approach in the SmartWork Project’s Time-series Data Imputation Paradigm
455
data channels altogether or each channel individu-
ally, a score threshold is set in order to support de-
cision making to avoid meaningless data completion.
Hence, the imputation is permitted on the condition
that the input data quality has been evaluated with
a score exceeding the pre-defined score threshold by
the Data Quality Assessment module. The threshold
value was set to 5.0 in logarithmic scale through trial
and error.
Taking into account that the input data quality is
expected to have a conspicuous impact on imputation
accuracy, the normalized mean squared error the im-
putation process yields ought to be inversely propor-
tional to the data quality score of the input data. Thus,
in order to validate the proposed data quality assess-
ment score, a series of experiments were conducted,
aiming at confirming this hypothesis.
4.1 Experimental Setup
The three types of data missingness patterns analyzed
in our experiments are: Missing Completely at Ran-
dom (MCAR), Missing Blocks, as well as a Mixed
type of missingness combining both of the former
types. To clarify, the Mixed pattern of missingness is
practically a combination of the two former patterns
of missingness, which are explicitly defined.
MCAR is the most common type observed in a
timeseries and the easiest kind to perform imputa-
tion on since very few instances of a large num-
ber of consecutive missing values are observed in
this setting, compared to Missing Blocks and Mixed
missingness where entire blocks of consecutive miss-
ing values raise the degree of difficulty in the con-
text of data completion as elaborated in (Nousias
et al., 2019). Additionally, in the SmartWork project’s
scope, MCAR missingness is more prevalent com-
pared to the other two missingness types due to the na-
ture of the sensing devices. These two types, though,
are also employed in our experiments in order to con-
firm that our score displays lower values in the lat-
ter types while the missingness percentage remains
the same. Missing Blocks and Mixed missingness
types in a given timeseries are highly likely to yield
a considerably larger maximum in terms of consecu-
tive missing entries, thus resulting in lower score val-
ues. In order to accomplish this goal, actual heart rate
data recorded over a timespan of 5 consecutive days
by 1 user were employed. This timeseries normally
contained missing data entries, forcing us to detect
the longest complete timeseries in the total data to ex-
periment on as the NRMSE (Normalized Root Mean
Square Error) the imputation introduces could not be
quantified for a timeseries containing missing entries.
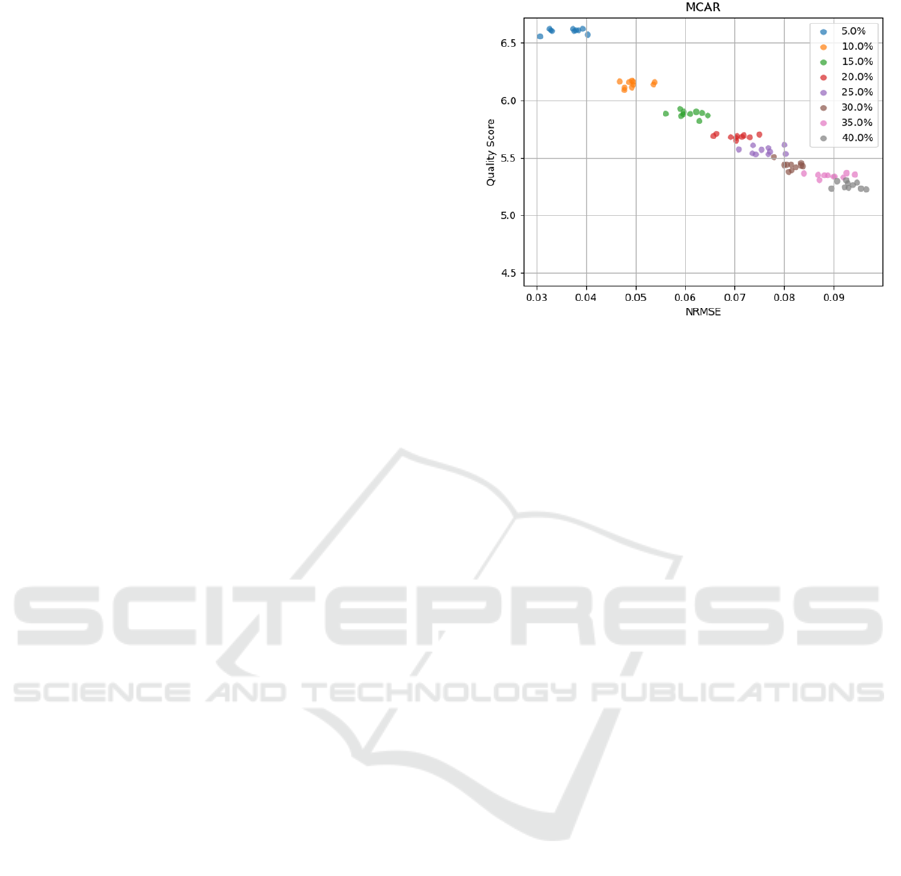
Figure 1: Data Quality Score WRT NRMSE – MCAR
Paradigm.
Thus, taking a complete timeseries as ground truth, a
large number of timeseries characterized of the miss-
ingness patterns mentioned above with a missingness
percentage ranging from 5% to 40% were artificially
generated. In further detail, 10 permutations were
generated for each missing percentage, and consid-
ering the number of distinct missingness percentages
was 8, there were 80 permutations for each pattern
of missingness, namely MCAR, Missing Blocks and
Mixed patterns. In total, 240 permutations of a time-
series each consisting of 1476 heart rate samples were
generated. The results these experiments yielded are
displayed and analysed in the following section.
4.2 Results
4.2.1 Imputation Quality for MCAR
Missingness
Figure 1 shows the the data quality assessment score
variation in relation to the NRMSE calculated for
each imputed artificially generated permutation. It is
important to point out that the score has been trans-
lated into a logarithmic scale so as to be more visually
perceivable.
As expected, the score is inversely proportional to
the NRMSE, and the relationship between the two
quantities is nearly linear. Each data point corre-
sponds to a different permutation of the original heart
rate timeseries. Permutations characterized of the
same missingness percentage have been colored simi-
larly in order to additionally highlight the importance
of the missingness percentage of the unimputed time-
series in terms of the expected quality of the imputa-
tion.
The decrease of the quality score from a missing-
ness percentage to the next one is much steeper in low
SmartWork 2021 - 2nd International Workshop on Smart, Personalized and Age-Friendly Working Environments
456
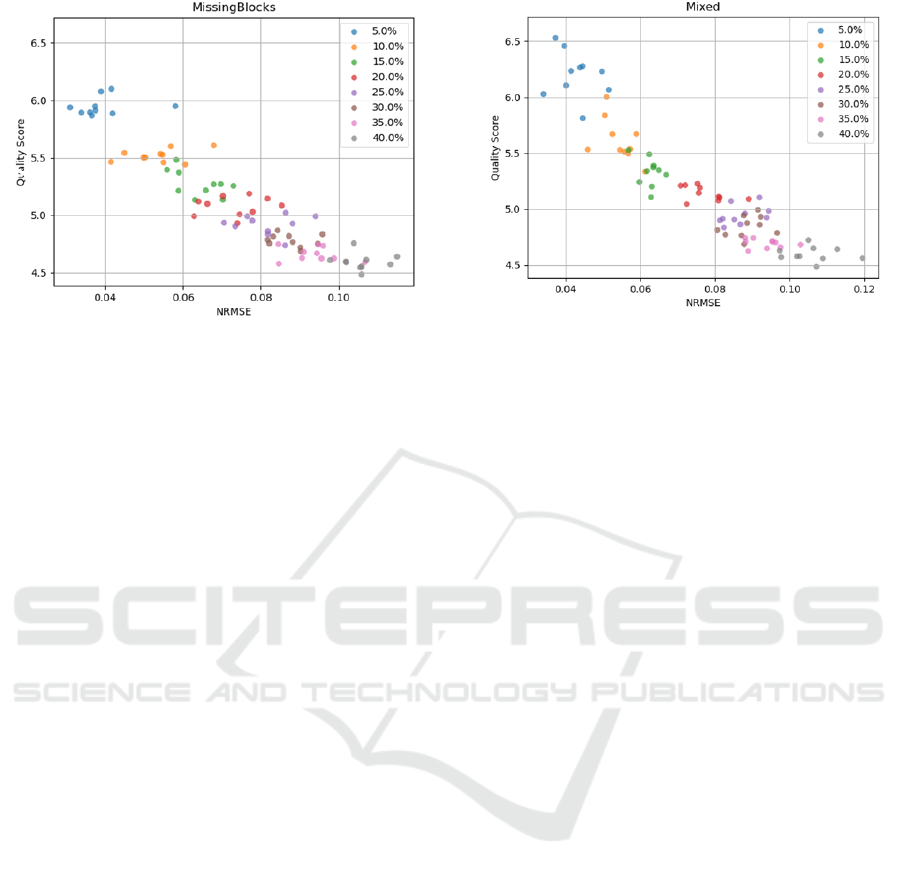
Figure 2: Data Quality Score WRT NRMSE – Missing
Blocks Paradigm.
missingness percentages and becomes almost negligi-
ble in the highest ones. Moreover, the permutations
characterized of the same missing percentage cover
a wider range in the y-axis which becomes apparent
from the fact that almost no data points corresponding
to a permutation of the same missingness percentage
coincide.
4.2.2 Imputation Quality for Missing Blocks
Missingness
In Figure 2 below, the behaviour of the data quality as-
sessment score with respect to the values of NRMSE
after the imputation of the original timeseries we gen-
erated is plotted, in the same manner we demonstrated
our results for the MCAR pattern of missingness for
the sake of comparability.
In this paradigm, results change to a noticeable ex-
tent due to the fact that imputation is highly tough-
ened when missing blocks are included into the mix
which becomes apparent by the lower values of the
quality score in these permutations. The decrease is
considerable when taking into account the data qual-
ity score scale is logarithmic. What is more, the
NRMSE displays slightly higher values compared to
the MCAR paradigm. It is clear that the relationship
between the exhibited quantities has started to diverge
from being linear while still seeming to be inversely
proportional, which is only anticipated.
What is noticeable concerns the overlap in the y-
axis between data point groups corresponding to dif-
ferent values of missingness percentage. However,
it could be interpreted by the effect of the extensive
missing blocks in the imputation process. This hy-
pothesis is confirmed by the fact this effect is even
more prevalent when the missingness percentage ex-
ceeds the value of 20%. The relationship between the
Figure 3: Data Quality Score WRT NRMSE – Mixed
Paradigm.
quantities is close to linear, but the variance of the
score values for data points corresponding to the same
missingness percentage is considerably higher. This
observation leads us to the conclusion that the sug-
gested score is less representative -in terms of data
quality- when large missing blocks are contained in
the timeseries compared to the MCAR paradigm.
4.2.3 Imputation Quality for Mixed Missingness
Patterns
In Figure 3, the relationship between the data qual-
ity assessment score and the NRMSE recorded after
the imputation has been performed is demonstrated,
for permutations of the actual timeseries created us-
ing the Mixed pattern of missingness. This graph
displays trends similar to those observed in the re-
spective graph of the Missing Blocks missingness
paradigm. The score values are higher than those in
the Missing Blocks case while the NRMSE error is
also higher – and expectedly lower compared to those
observed in the MCAR paradigm. It is observed that
the variance observed in the groups of data points cor-
responding to the same missingness percentage de-
creases to a considerable extent as the missingness
percentage decreases. Lastly, it is important to notice
the overlaps of data points in the y-axis corresponding
to different missingness percentages’ permutations,
also described in the Missing Blocks paradigm’s sec-
tion. In spite of the fact these overlaps still exist, they
are limited compared to the Missing Blocks case, es-
pecially for permuations with lower missingness per-
centage, not only in the sense that they are not that nu-
merous but also less intense than those observed in the
Missing Blocks’ pattern. By the term ‘less intense’, it
is implied that there are no data points correspond-
ing to higher missingness percentage displaying sig-
A Data Quality Assessment Approach in the SmartWork Project’s Time-series Data Imputation Paradigm
457

nificantly higher data quality assessment score values
than data points corresponding to lower missingness
percentage.
5 CONCLUSIONS - FUTURE
WORK
The work presented in this paper introduces a data
quality assessment approach that allows for decision
making regarding the need/efficiency of data comple-
tion in order to save system computational resources
and ensure quality of imputed data. To the best of
our knowledge, this is the first method deriving a pre-
dictive quantitative metric for data quality in the data
imputation paradigm, providing a yes or no answer
for the question: Would data completion about to per-
formed in a given batch of data is meaningful and re-
liable? The dearth of similar known works approach-
ing the data quality assessment in data imputation set-
tings in the same way deprives us of the potential to
perform extensive comparative evaluation.
Further experiments backing the validity of the
suggested score, while optimizing the score’s hyper-
parameters, in a variety of data missingness settings
will be addressed in our future work. Additionally,
we aim at expanding our validation experiments in the
multi-channel imputation setting, expecting for even
clearer evidence for our method’s utility and under-
stability. Moreover, we perform cross-validation to
demonstrate the proposed metric is insusceptible to
the selection of different data completion techniques.
Finally, although data quality has been assessed in
other setups, its application in the context of data im-
putation optimization has not been studied, thus not
being possible for us to perform more extensive com-
parative evaluation of the proposed approach.
The presented results seem to confirm the valid-
ity of the newly introduced data quality assessment
score since, as the data quality score assigned to a
given batch of input data is inversely proportional to
the value of the NRMSE yielded by the imputation
performed on that particular batch. Therefore, the ex-
ported results reinforce our initial hypothesis that the
suggested score is a suitable indicator regarding the
imputability of a given batch of data, allowing to as-
sess the potential outcome (e.g. errors introduced) of
the imputation processes, thus, saving us from unnec-
essary computational cost.
ACKNOWLEDGEMENTS
This work has been partially supported by the Smart-
Work project (GA 826343), EU H2020, SC1-DTH-
03-2018 - Adaptive smart working and living envi-
ronments supporting active and healthy ageing.
REFERENCES
Batini, C., Cappiello, C., Francalanci, C., and Maurino, A.
(2009). Methodologies for data quality assessment
and improvement. ACM computing surveys (CSUR),
41(3):1–52.
Cai, L. and Zhu, Y. (2015). The challenges of data quality
and data quality assessment in the big data era. Data
science journal, 14.
Cappiello, C., Francalanci, C., and Pernici, B. (2004). Data
quality assessment from the user’s perspective. In Pro-
ceedings of the 2004 international workshop on Infor-
mation quality in information systems, pages 68–73.
Fazakis, Nikos & Kocsis, Otilia & Dritsas, Elias & Alexiou,
Sotiris & Fakotakis, Nikos & Moustakas, Konstanti-
nos. (2021). Machine Learning Tools for Long-Term
Type 2 Diabetes Risk Prediction. IEEE Access. PP. 1-
1. 10.1109/ACCESS.2021.3098691.
George, G., Haas, M. R., and Pentland, A. (2014). Big data
and management.
Guan, Y. and Stephens, M. (2008). Practical issues in
imputation-based association mapping. PLoS genet-
ics, 4(12):e1000279.
Kocsis, O., Moustakas, K., Fakotakis, N., Hermens, H. J.,
Cabrita, M., Ziemke, T., and Kovordanyi, R. (2019a).
Conceptual architecture of a multi-dimensional mod-
eling framework for older office workers. In Pro-
ceedings of the 12th ACM International Conference
on PErvasive Technologies Related to Assistive Envi-
ronments, PETRA ’19, page 448–452, New York, NY,
USA. Association for Computing Machinery.
Kocsis, O., Moustakas, K., Fakotakis, N., Vassiliou, C.,
Toska, A., Vanderheiden, G. C., Stergiou, A., Amax-
ilatis, D., Pardal, A., Quintas, J. a., Hermens, H. J.,
Cabrita, M., Dantas, C., Hansen, S., Ziemke, T.,
Tageo, V., and Dougan, P. (2019b). Smartwork: De-
signing a smart age-friendly living and working envi-
ronment for office workers. In Proceedings of the 12th
ACM International Conference on PErvasive Tech-
nologies Related to Assistive Environments, PETRA
’19, page 435–441, New York, NY, USA. Association
for Computing Machinery.
Kocsis, O., Papoulias, G., Fakotakis, N., and Moustakas, K.
(2021). An approach to determine short- and long-
term work ability in smart work system. In Russo,
D., Ahram, T., Karwowski, W., Di Bucchianico, G.,
and Taiar, R., editors, Intelligent Human Systems Inte-
gration 2021, pages 388–394, Cham. Springer Inter-
national Publishing.
SmartWork 2021 - 2nd International Workshop on Smart, Personalized and Age-Friendly Working Environments
458

Labrinidis, A. and Jagadish, H. V. (2012). Challenges and
opportunities with big data. Proceedings of the VLDB
Endowment, 5(12):2032–2033.
Nousias, S., Papoulias, G., Kocsis, O., Cabrita, M., La-
los, A. S., and Moustakas, K. (2019). Coping with
missing data in an unobtrusive monitoring system for
office workers. In 2019 International Conference
on Biomedical Innovations and Applications (BIA),
pages 1–4. IEEE.
Nousias, S., Tselios, C., Bitzas, D., Lalos, A. S., Mous-
takas, K., and Chatzigiannakis, I. (2018). Uncer-
tainty management for wearable iot wristband sen-
sors using laplacian-based matrix completion. In
2018 IEEE 23rd International Workshop on Computer
Aided Modeling and Design of Communication Links
and Networks (CAMAD), pages 1–6. IEEE.
Pipino, L. L., Lee, Y. W., and Wang, R. Y. (2002). Data
quality assessment. Communications of the ACM,
45(4):211–218.
Sagiroglu, S. and Sinanc, D. (2013). Big data: A review. In
2013 international conference on collaboration tech-
nologies and systems (CTS), pages 42–47. IEEE.
Taleb, I., El Kassabi, H. T., Serhani, M. A., Dssouli, R., and
Bouhaddioui, C. (2016). Big data quality: A quality
dimensions evaluation. In 2016 Intl IEEE Conferences
on Ubiquitous Intelligence & Computing, Advanced
and Trusted Computing, Scalable Computing and
Communications, Cloud and Big Data Computing,
Internet of People, and Smart World Congress
(UIC/ATC/ScalCom/CBDCom/IoP/SmartWorld),
pages 759–765. IEEE.
Zaveri, A., Rula, A., Maurino, A., Pietrobon, R., Lehmann,
J., and Auer, S. (2016). Quality assessment for linked
data: A survey. Semantic Web, 7(1):63–93.
Zhang, Z. (2015). Missing values in big data research: some
basic skills. Annals of translational medicine, 3(21).
A Data Quality Assessment Approach in the SmartWork Project’s Time-series Data Imputation Paradigm
459
