
Simulation Daily Mobility using J48 A l g o r i t h m s o f M a c h i n e L e a r n i n g
for Predicting Workplace
Khalid Qbouche
1
and Khadija Rhoulami
2
1
LRIT associated unit to CNRST (URAC°29) Faculty of Science, Mohammed V University in Rabat 4 Av.Ibn Battouta B.P.
1014 RP, 10006 Rabat, Morocco
2
DESTEC, FLSHR Mohammed V University in Rabat, Morocco
Keywords: Daily Mobility, Multi-agent System, Machine Learning, Gama platform.
Abstract: Nowadays, the urban development of the city has led to changes in various fields, such as population growth
and its daily various activities. These activities have been influenced by the development, concerning either
air, water, or land mobility. Mainly, human mobility is defined in terms of it. This latter fact makes it easy
for researchers to gain realistic insights for a rational simulation of human mobility in general and
workplace-related mobility in particular. More precisely, this paper will focus on j48 algorithms of Machine
Learning to predict a potential workplace, and in parallel to this, a tiny Multi-Agent system will be useful to
simulate the Rabat region's main traffic.
1
INTRODUCTION
Many academics are now investigating challenges in
metropolitan settings to develop more intelligent
uses of available resources for daily movement.
Daily Mobility (DM) is a subject area that tries to
simulate human motion in an urban setting. It is
especially significant to this study since any analysis
should have an impact on public transportation
systems and related subjects. Human mobility is
constantly dependent on a variety of circumstances,
such as traffic congestion, infrastructural design, and
weather conditions. As a result, the dynamic of
human movement always relates to other critical
facts. As a result, the dynamic of human movement
constantly relates to other critical accompanying
data, which when rationally evaluated may
undoubtedly lead to the notion of flawless
automatization, namely, smart city (SC) and
intelligent transportation system (ITS). Modeling
everyday mobility may be handled from a variety of
angles depending on the degree of information that
can be captured by the model. Aside from that, in
recent years, a slew of new models have emerged.
These models are frequently classified as
macroscopic, microscopic, or mesoscopic based on
their degrees of representation [1].
The macroscopic model captures a few
aggregated traffic characteristics such as average
density and average flow, and average speed.
Second, a microscopic model is a model that is used
to describe and track the activity of people. Finally,
the mesoscopic model is beneficial to the likely
distribution chain and its processes of movement.
Despite its relevance, we constructed a model using
HCP data from 2014 and applied it to ONDH
(Observatory National Development Human) data
from 2019, which did not include the workplace
variable. Thanks to a collection of categorical data,
we were able to apply the j48 algorithms of (ML) to
create the workplace model of prediction. Overall,
utilizing the Gama multi-agent system's design, we
were able to create a provided supplementary
foundation that allowed us to mimic the everyday
mobility of persons using the ONDH 2019 data [2].
In reality, structure contributes significantly to
the meaning of my writing. The second section gives
an overview of sustainable urban mobility. The
selected technique of prediction J48 and the method
of simulation are discussed in Section 3. Following
that, part 4 describes data used for construct the
model of prediction using data of HCP by
algorithms of prediction J48, while section 5
describes our experiments of prediction workplace
in the rabat region for persons and simulation their
displacement by system multi-agent before the
conclusion.
392
Qbouche, K. and Rhoulami, K.
Simulation Daily Mobility using J48 Algorithms of Machine Learning for Predicting Workplace.
DOI: 10.5220/0010735200003101
In Proceedings of the 2nd International Conference on Big Data, Modelling and Machine Learning (BML 2021), pages 392-398
ISBN: 978-989-758-559-3
Copyright
c
2022 by SCITEPRESS – Science and Technology Publications, Lda. All rights reserved
2
RELATED WORKS
We discuss relevant work on daily mobility
simulation in this part; some of the works employ
data from mobile phone networks, GPS-based data,
and social media data.
Using HCP data 2014 provided by the Gama
platform, Khalid Qbouche and Khadija Rhoulami
[16] recreate everyday movement in the Rabat
region. Zargayouna and Mehdi [17] offer a
multimodal trip simulator that enables network
knowledge and prediction. In addition, web apps
might be used to track individual travelers. Through
powerful ad-hoc software combining Natural
Language Processing and Sentiment Analysis field
tools, Serna, Ainhoa, Gerrikagoitia, Jon, Bernabe,
Unai, and Ruiz, Tomas [18] investigated empirically
the feasibility of the automatic identification of
Sustainable Urban Mobility problems in the
discourses generated by the UGC. The WHO-
WHERE-WHEN (3W) model, proposed by Smolak,
Kamil, Rohm, Witold, Knop, Krzysztof, and Sila-
Nowicka, Katarzyna [19], is an enhanced privacy-
protective mobility modeling approach for synthetic
mobility data creation.
3
METHODS
3.1 Multi-agent System
There are various platforms available for designing
and implementing a multi-agent simulator, but there
are differences between them. One of the most
important selection criteria for a simulation platform
in the context of type applications is its capacity to
develop geospatial agent-based models.
Furthermore, integrating and processing geographic
data is simple. We have numerous multi-agent
platforms based on this requirement, such as Jade,
Mason, and Madkit; some of these platforms are as
follows: Swarm is a simulation platform that
includes a framework for importing GIS data layers
[3]. It does not, however, provide spatial primitives
or the ability to save the resulting environment.
Netlogo supports GIS data import and export, as
well as certain basic geometrical procedures [4], but
not sophisticated geographical analytic operations
Matsim is a popular platform for micro-mobility
simulations as well as an open-source framework for
building large-scale agent-based transportation
simulations. [5]. Transims simulates multimodal
movements and analyzes the impacts of traffic or
demography policy changes, as well as offering a
multi-agent simulation prototype capable of testing
planning scenarios and specifying individual actions
[6]. However, none of these solutions take linked
people into account. Connected passenger's paths are
continually monitored in the concept, and
alternatives are suggested to them in the event of
disruptions. AgentPolis is a multi-agent multimodal
transportation platform [7]. However, none of these
solutions take linked people into account. Gama is a
framework for developing spatially explicit agent-
based simulations [8] as well as geographic
information systems (GIS) applications (network
modeling as a graph, computation of shortest paths,
visualization, and management of 2D and 3D data,
etc.). We selected the Gama platform in our research
since it specializes in simulating individuals in
metropolitan networks, such as [16]. For spatially
explicit agent-based simulation, it also functions as a
modeling and simulation development environment.
[8]. Gama has also been created using a highly
generic approach for many application domains and
may be utilized for a wide range of applications [8].
3.2 Weka: Data Mining Software
A supervised learning approach was used to create
the model used in our research. WEKA, an open-
source and free knowledge analysis program [10],
was utilized in the software tool. WEKA employs a
variety of machine learning techniques.
The WEKA workbench includes a set of
visualization tools and algorithms for predictive
modeling, as well as graphical user interfaces that
make this capability accessible. The data will be
kept in JavaDB, while the presentation of the
findings and construction of the prototype was done
in JAVA. Weka 3.9.0 [9], a Java-based version, is
utilized in a wide range of applications, including
education and research.
Figure 1: WEKA GUI chooser
All of the typical Data Mining issues are covered
by the workbench, including regression,
classification, clustering, association rule mining,
and attribute selection.
Simulation Daily Mobility using J48 Algorithms of Machine Learning for Predicting Workplace
393

3.3 Algorithms for Classification
The act of giving labels to test patterns based on
previously identified training patterns is known as
classification. A learning phase, in which the
classification algorithm is trained, and a
classification phase, in which the algorithm labels
fresh data, are two frequent divisions of this process.
Additionally, there are two types of machine
learning: supervised and unsupervised.
All algorithms use a single collection to store
their data, read from a file, or create a database
query. Many of the algorithms in Machine Learning
are: Ross Quinlan [11] developed the ID 3 (Iterative
Dichotomizer 3) algorithm. It's used to make a
decision tree out of a collection of facts.
C4.5 now has ID3: From a set of data containing
class labels, classification creates a model of classes.
It's also a machine learning and data mining method
that works well with categorization issues. For the
target variable's forecast. The desired distribution of
the data may be easily understood with the
assistance of a tree classification method. J48 is a
kind of ID3 that has been extended. In J48, you may
use features like missing value accounting, decision
tree pruning, continuous attribute value ranges, rule
derivation, and more. The Java version of the C4.5
method is the J48 algorithm in the WEKA data
mining tool. With the WEKA tool, you have a lot
of options when it comes to tree pruning.
Pruning can be done to fine-tune a potential
over-fitting situation. The classification is repeated in
additional algorithms until each leaf is pure; that is,
the data categorization should be as perfect as
feasible. This algorithm creates the rules that
determine the data's specific identification. The
objective is to generalize a decision tree
progressively until it reaches a balance of
flexibility and accuracy [12]. The leaves formed a
class in a decision tree node in the center of the
characteristics of the data being tested, and the
branch is the outcome of the test attributes (records)
[13].
The Bayesian method is used to estimate the
likelihood of various assumptions. Furthermore, the
simplest type of Bayesian network is Naive Bayes,
in which all attributes are independent of the class
variable's value [14]. Furthermore, Naive Bayes is a
straightforward method for developing classifiers,
which are models that give class labels to issue
instances represented as vectors of feature values,
with the class labels selected from a limited range of
options. There is no one method for training such
classifiers; rather, many methods based on the same
concept exist: all naive Bayes classifiers assume that
the value of one feature is independent of the value
of any other feature, given the class variable. An
apple, for instance, is a red, spherical fruit with a
diameter of about 10 cm. Regardless of any possible
connections between the color, roundness, and
diameter data, a naive Bayes classifier examines
each of these properties to contribute independently
to the likelihood that this fruit is an apple. Naive
Bayes classifiers may be learned very quickly for
certain probability models in a supervised learning
environment. The maximum likelihood technique is
utilized to estimate parameters for naive Bayes
models in many practical situations; in other words,
the naive Bayes model may be employed without
using Bayesian probability or any Bayesian
processes [20].
CART stands for Classification and Regression
Tree. It's a way of making a binary decision tree
with two branches for each node.
By defining the category of test documents, the
K-NN method is used to evaluate the degree of
similarity between documents and k training data
and store a specific quantity of classification data.
This technique is an instant-based learning algorithm
that categorizes objects using the training set's
nearest feature space. The training sets are
represented in a multidimensional feature space. The
training set's category is used to divide the feature
space into regions. If the most common category
among the k closest training data, a point in the
feature space is allocated to that category. In most
cases, Euclidean Distance is employed to calculate
the distance between the vectors. The availability of
a similarity metric for finding neighbors of a given
document is a crucial component of this technique.
The training step consists solely of storing the
training set's feature vectors and classifications.
Distances between the new vector, which represents
an input document, and all stored vectors are
computed in the classification phase, and the k
closest samples are chosen. The closest point
allocated to a specific category is used to forecast
the annotated category of a document [21].
For our research, we utilized the J48
classification method, which is excellent for high
accuracy from the dataset sections in [14].
Furthermore, in [22], it has the greatest classification
accuracy (80.46%) for predicting a user's approval
of re-orientation systems. This technique applies to
discrete data, like in our instance of predicting
workplace for the new database HCP 2019 [1]
utilizing j48 Machine Learning Algorithms.
BML 2021 - INTERNATIONAL CONFERENCE ON BIG DATA, MODELLING AND MACHINE LEARNING (BML’21)
394

4
PARAMETERS AND DATA
4.1 Data Used
We built our model of prediction using individual
characteristics using HCP data as demographic
indicators [1] in our research (profession status,
education level, activity area, Type of activity ...).
The following is an example of this characteristic:
𝑅 =< 𝑝1, 𝑝2, 𝑝3 ……., 𝑝𝑛 > 𝑝𝑖 is a group of
people.
𝐶 =< 𝑐1, 𝑐2, 𝑐3 … …. , 𝑐𝑛 > An individual's
characteristics. The R record is a set of 2014 Hcp
census statistics for each individual's Rabat region,
as shown in the class diagram below:
Figure 2: The inhabiting class diagram in Rabat Region.
The model outlines the characteristics of a unique
identification called a "reference" is assigned to each
person. It also has POI (Point of Interest), which we
described as a set:
Map=<Refer, FirstName, LastName, Sexe,
Placeid, Address>.
We have described attributes of the HCP data 2014
[1] in the following picture, which may be used to
create a model of prediction using method j48. Some
of the features are:
Table 1 lists the characteristics of our prediction model.
Attributes Description
Aggregate
educational
level
0: No education level 1: Preschool 2:
Primary 3: College Secondary 4:
Qualifying Secondary 5: Superio
r
Education
Secto
r
1: Public 2: Private 3: Not determined
4: No education level
Schooling 1: Enrolled in general education (and
having completed the year) 2: Enrolled
in general education (and not having
completed the year) 3: Enrolled in
vocational training (and having
completed the year) 4: Enrolled in
vocational training (and not having
completed the year) 5: Unschooled 6:
Not determined 7: Person under 3 years
old 8: Person 49 years of age or older 9:
Age not determine
d
Activity
type
0:Active occupied 1:Unemployed who
has never worked 2: Unemployed
person who has already worked 3:
Housewife 4: Pupil / Student 5: Other
inactive 6: Not determine
d
Profession
Grand Group
0:0 - Members of the legislative bodies,
local elected officials, hierarchical
officials of the public service and
directors, and executive 1: 1 - Senior
executives and members of the liberal
professions. 2: 2 - Technicians and
intermediate professions 3 : 3 -
Employees 4: 4 - Merchants and
commercial and financial intermediaries
5: 5 - Farmers, fishers of fish and other
aquatic species, foresters, hunters and
workers as 6: 6 - Craftsmen and skilled
trades workers (except agricultural
workers) 7: 7 – Agricultural and fishing
workers and laborers (including skilled
workers) 8: 8 - Plant and machine
operators and assembly workers 9: 9 -
Non-farm laborers, material handlers,
and small trades workers 10: X –
Workers who cannot be classified by
occupation 11: Type of activity not
determined 12: Unemployed who has
never worked 13: Inactive
Status
Profession
1: Employer / Member of a cooperative
2: Independent 3: Home help /
Apprentice 4: Public sector employee 5:
Private sector employee 6: Other 7: Not
determined 8: Type of activity not
determined 9: Type of activity not
determined 10: Inactive
Activity
Section
1:A - Agriculture, forestry and fishing 2:
B – Extractive industries 3: C -
Manufacturing industries 4 : D -
Electricity, gas, steam and air
conditioning 5: E - Production, and
distribution of water, sanitation, waste
management and remediation 6: F –
Construction 7: G - Sale and repair of
motor vehicles and motorcycles 8: H -
Transport and storage 9: I -
Accommodation and catering 10: J –
Information and communication 11: K -
Financial and insurance activities 12: L -
Real estate activities 13: M -
Professional, scientific and technical
activities 14 : N - Administrative and
support service activities 15: O - Public
administration 16 : P - Education 17: Q -
Human health and social action 18: R -
Arts, entertainment, and recreational
activities 19: S - Other service activities
20: T - Activities of households as
Simulation Daily Mobility using J48 Algorithms of Machine Learning for Predicting Workplace
395
employers and undifferentiated activities
of households as producers of goods 21:
U - Extraterritorial activities 22: Not
determined 23: Type of activity not
determined 24: Unemployed who has
never worked 25: inactive
Work Place 0: Home 1: District / Douar of residence
2: Other districts/douar in the
municipality of residence 3: Other
municipality in the province of residence
4: Other provinces 5: Non-fixed location
6: Other places 7: Not determined 8:
Type of activity not determined 9:
Unemployed 10: inactive
The components of our model are depicted in the
diagram below:
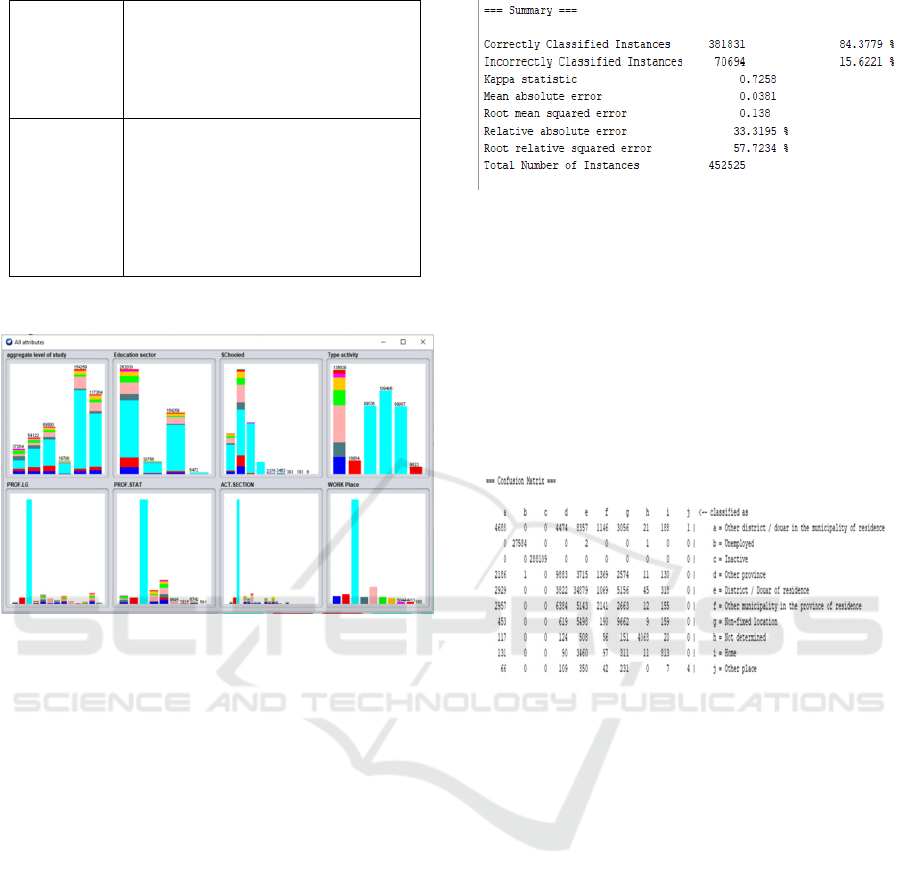
Figure 3: Using WEKA Explorer to view the description
characteristics.
5 EXPERIMENTS AND THEIR
OUTCOMES
In this part, we show how we used j48 machine
learning methods to construct the workplace
prediction model, which we applied to the ONDH
data 2019 [23] to obtain
comprehensive information
on each individual. As a result, using ONDH data
[23] 2019, we were able to replicate individual daily
movements in the Rabat region.
5.1 Classification Data Set
Classification is the process of creating a model of
classes from a set of records with class labels. We
require one set of data to train this model, which is
referred to as the training data set, to build the
model. In this study, the percentage values for
training and testing were 70% for training and 30%
for testing. The categorization of our model is
depicted in the figure below.
Figure 4: Classification of training data using Decision
Tree (j48)
5.2 Matrix of Confusion
A confusion matrix is a table arrangement that
allows you to see how well an algorithm performs.
Furthermore, each row of the matrix represents
examples belonging to a predicted class, whereas
each column represents instances belonging to an
actual class. In addition, we show our model's
confusion matrix in the figure below.
Figure 5: Confusion Matrix of test data using Decision
Tree (J48)
5.3 The
R e s u l t o f t h e W o r k p l a c e
Prediction
Following our model's training and testing, data
from an unknown workplace was entered into the
system for prediction. The projected production of a
particular workplace is depicted in the diagrams
below.
BML 2021 - INTERNATIONAL CONFERENCE ON BIG DATA, MODELLING AND MACHINE LEARNING (BML’21)
396

Figure 6: The result of the prediction model
Figure 7: The result of the prediction model
Figure 8: The result of the prediction model.
5.4 Simulation of a Person's Relocation
using the Gama Platform
We offer the following data after simulating
transportation demand in the Rabat region using
platform Gama: The image below depicts a
simulation of a person leaving their home and going
to work. In addition, the ‘blue' point indicated the
workplace, the ‘black' point represented the
individual's dwelling, and the ‘red' point represented
the individual's mobility.
Figure 9: State of the simulated traffic by Gama platform
in the Rabat region
6 CONCLUSION
We used the ONDH 2019 [23] data to simulate
everyday mobility in the Rabat region in this post. In
this study, we also developed a model for
forecasting the workplace using j48 machine
learning techniques and applied it to ONDH 2019
[23] data to generate a comprehensive database.
Using the Gama platform, we simulated human
displacements. Any researcher who wants to choose
a prediction algorithm for data census in the future
can do so simply. We intend to expand our work
with the test performance of a multi-agent system
shortly
REFERENCES
Institutional website of the High Commission for Planning
of the Kingdom of Morocco. https://www.hcp.ma/.
Data Mining: Practical Machine Learning Tools and
Techniques. Elsevier, 2011.
The Swarm Simulation System: A Toolkit for Building
Multi-Agent Simulations — Santa Fe
Institutehttps://www.santafe.edu/research/results/wo
Simulation Daily Mobility using J48 Algorithms of Machine Learning for Predicting Workplace
397

rking-papers/the-swarmsimulation-system-a-toolkit-
for-building.
NetLogo Home Page.
https://ccl.northwestern.edu/netlogo/.
C. Tchervenkov, S. Horl, M. Balac, T. Dubernet, et K. W.
Axhausen, An improved replanning strategy for
congested traffic conditions in MATSim, Procedia
Comput. Sci., vol. 170, p. 779- 784, janv. 2020, DOI:
10.1016/j.procs.2020.03.156.
K. S. Lee, J. K. Eom, et D. Moon, Applications of
TRANSIMS in Transportation: A Literature Review,
Procedia Comput. Sci., vol. 32, p. 769-773, janv.
2014, DOI: 10.1016/j.procs.2014.05.489.
Agents4its, agents4its/agent polis. 2019.
GAMA-Platform, https://gama-
platform.github.io/wiki/Home.
Weka 3 - Data Mining with Open Source Machine
Learning Software in Java.
https://www.cs.waikato.ac.nz/ml/weka/.
Y. Lechevallier, WEKA, un logiciel libre d’apprentissage
et de data mining, p. 43.
B. R. Bakshi et G. Stephanopoulos, Representation of
process trends—IV. Induction of real-time patterns
from operating data for diagnosis and supervisory
control, Comput. Chem. Eng., vol. 18, no 4, p. 303-
332, avr. 1994, DOI: 10.1016/0098- 1354(94)85029-1.
G. Kaur et A. Chhabra, Improved J48 Classification
Algorithm for the Prediction of Diabetes, Int. J.
Comput. Appl., vol. 98, no 22, p. 13-17, juill. 2014.
J. Han, M. Kamber, et J. Pei, Data Mining: Concepts and
Techniques, 3rd edition, 2006.
P. Kuppan and N.Manoharan, A Tentative Analysis Of
Liver Disorder Using Data Mining Algorithms J48,
Decision Table And Naive Bayes, Int. J. Comput.
Algorithm, vol. 6, no 1, p. 37-40, juin 2017.
LACHOWICZ, Mirosław. Microscopic,
mesoscopic, and macroscopic descriptions of complex
systems. Probabilistic Engineering Mechanics, 2011,
vol. 26, no 1, p. 54-60.
Khalid Qbouche and Khadija Rhoulami. 2021. Simulation
Daily Mobility in Rabat region. In The 4th
International Conference on Networking Information
Systems and Security. (NISS2021), April 01, 02,
2021, KENITRA, AA, Morocco. ACM, New York,
NY, USA, 6 pages.
https://doi.org/10.1145/3454127.3454128
Zargayouna, Mahdi and Zeddini, Besma and Scemama,
Gerard and Othman, Amine, and others. (2013).
Agent-Based Simulator for Travelers Multimodal
Mobility. Frontiers in Artificial
Intelligence and Applications. 252. 10.3233/978-1-
61499- 254-7-81.
Serna, Ainhoa and Gerrikagoitia, Jon and Bernabe,
Unai and Ruiz, Tomas. (2017).
Sustainability analysis on Urban Mobility based on
Social Media content. Transportation Research
Procedia. 24. 1-8. 10.1016/j.trpro.2017.05.059.
Smolak, Kamil and Rohm, Witold and Knop, Krzysztof
and Sila- Nowicka, Katarzyna. (2020). Population
mobility modeling for mobility
Data simulation. Computers, Environment, and Urban
Systems. 84. 101526.
10.1016/j.compenvurbsys.2020.101526.
Zhang, H., and Li, D. (2007, November). Naive Bayes text
classifier. In 2007 IEEE International Conference on
Granular Computing (GRC
2007) (pp. 708-708). IEEE.
TAM, Vincent, SANTOSO, Ardi, and SETIONO, Rudy.
A comparative study of centroid- based,
neighborhood-based, and statistical approaches for
effective document categorization. In: Object
recognition supported by user interaction for service
robots. IEEE, 2002. p. 235-238.
Ihya, Rachida and Namir, Abdelwahed and Filali, Sanaa
and Aitdaoud, Mohammed and Guerss, Fatima zahra.
(2019). Machine learning algorithms J48 for
predicting a user's approval of an E-orientation
system. SCA ’19: Proceedings of the 4th International
Conference on Smart City Applications. 1-8.
10.1145/3368756.3368995.
Institutional site of the National Observatory of Human
Development .https://www.ondh.ma
BML 2021 - INTERNATIONAL CONFERENCE ON BIG DATA, MODELLING AND MACHINE LEARNING (BML’21)
398
