
Comparative Study of Riprap Model Design for Scour Protection of
Bridge Pier
Cut Talitha Salsabila Nuraprili
a
, Robby Yussac Tallar
b
and Alexander Yovan Suwono
c
Civil Engineering Department, Maranatha Christian University, Jl. Surya Sumantri.65, Bandung, Jawa Barat Indonesia
Keywords: Comparative Study, Local Scouring Riprap, Model Design.
Abstract: Streams have an important function for human by providing irrigation, electricity, etc. Streams also have the
sediments within that typically flow following the direction of water velocity. The differences in
characteristics among streams have also been clear since it can be changed easily due to climate change, or
other natural factors. Streams also can change in dimension according to the surrounded environmental
conditions, for example local scouring caused by bridge pier. And then by using riprap is the most common
countermeasure to prevent local scouring. Riprap is a method that can be used to prevent erosion in streams
or other conditions that have water flows with high velocity. Therefore, the purpose of this study is to compare
two models riprap design around the pier for scour protection. The riprap models that were compared are
rectangular and circle shaped. The condition used in this study is clear water condition, under sediment-based
layer design, and riprap layer thickness. The experimental study was used to compare both riprap model
design. The result of this study indicates that circle shape model riprap is better than a rectangular shape.
Further studies are necessary regarding the effect of flow type, cross-sectional shape, or other related
variables.
1 INTRODUCTION
Streams are one of the sources of water on this earth
and have an important function for humankind, it has
various characteristics and many models. For streams
flows, especially in urban areas, these streams have
bridged that function to connect roads separated by
streams(Tallar & Suen, 2017).
Bridge has more than one pier which functions as
a load-bearing from the bridge itself and other loads
such as live loads and dead loads. However, presence
of a pier, the type of flow of water will be changed
from horizontal to vertical, (Hao, 1993) so that local
scouring occurs around the pier and will result in the
lifting of the base of material around the pier and
resulting in damage to the foundation on the bridge
pier.
Since the bridge piers that damaged due to the
scouring, then require to prevent or control bridge
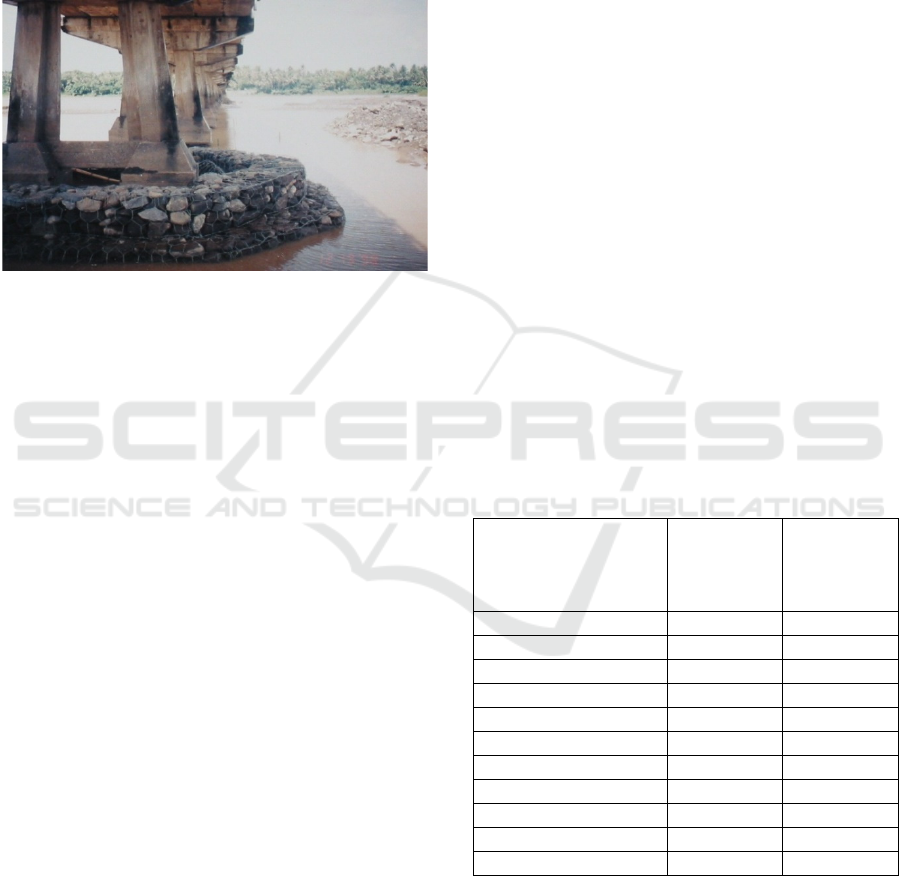
pier local scouring. Riprap is one of the solutions for
local scouring (Figure 1). Riprap is one of the
a
https://orcid.org/0000-0002-5641-5796
b
https://orcid.org/0000-0001-7307-3348
c
https://orcid.org/0000-0002-2577-8519
Figure 1: Local scouring around the pier (From:
Bintangtimur.net).
methods used for preventing local scouring (Rashno,
Zarrati, & Tabarestani, 2020). The material of riprap
is rocks arranged around the pier (Figure 2). With
used riprap around the pier, then it can reduce down
flow jet on bottom sediments against local scouring.
This study has been conducted, these studies
generally inspect the design of riprap size in clear
water scour conditions, for example Chiew (1995).
176
Nuraprili, C., Tallar, R. and Suwono, A.
Comparative Study of Riprap Model Design for Scour Protection of Bridge Pier.
DOI: 10.5220/0010747600003113
In Proceedings of the 1st International Conference on Emerging Issues in Technology, Engineering and Science (ICE-TES 2021), pages 176-179
ISBN: 978-989-758-601-9
Copyright
c
2022 by SCITEPRESS – Science and Technology Publications, Lda. All rights reserved
A riprap modeling experiment will be carried out
in this study. The study aims to compare the two
riprap models that are rectangular and circular. The
positioned of two models riprap is around the pier to
prevent the impact of local scouring. This
experimental study aims to compare both models and
the results will show that the circular shape is better
than the rectangular.(Unger & Hager, 2006)
Figure 2: Example of riprap around the pier (From:
istiarto.staff.ugm.ac.id).
2 METHODS
To find a better riprap model, then this study will
show it. By using a comparative of the two models
that rectangular and circular shapes, using the same
amount of two discharge. Is supposed to take both Q
25
and Q
75
to make sure. Besides, another parameter that
would be used in this study, likes the size of the
gravels that would use in the riprap model design,
which would be used in the same size for both
models. (Khademghaeinya, Abrishami, Zarrati,
Karimaei Tabarestani, & Mashahir, 2020)
2.1 Sieve Analysis
Sieve analysis was used in this study to find out these
gravels size for riprap model design. By using many
different sizes of sieve, likes 19,1 mm or until 0,075
mm (Table 1). So, this analysis is important, to ensure
each layer of riprap is the same size as previously
determined.
2.2 Discharge Curve Analysis
To find out which discharge can restrain the flow that
exists in the streams, it can experiment with using a
discharge curve to find to get the best 2 results of
discharge or Q. At the time when did the experiment
with discharge curve analysis, try multiple discharges
25% discharge (Q
25
)
,
50 % discharge (Q
50
), and 75%
discharge (Q
75
).
2.3 Scenario Riprap Model Design
The riprap models that were compared in this study
are rectangular and circular. Riprap placed under
sediment-base layer design. The thickness of these
two riprap models is 30 mm and the dimension will
be used in 28 cm or 280 mm (diameter for circular
shape and length for rectangular shape) and the
diameter of the pier used in this study is 8 cm. In this
study, the condition of the water is on clear water
scour, it usually happens when low flow discharge.
This experimental study was used to compare two
models design to knows which models better to
prevent local scouring around the pier.
3 RESULT AND DISCUSSION
3.1 Sieve Analysis
Sieve analysis was an experiment in the laboratories,
to find out the gravel riprap size. Then dr
50
, from sieve
analysis data can be decided to gravel size to use in
riprap models design.
Table 1: Sieve Analysis.
No. Sieve
mm
(inch)
Cumulative
Soil
Retained
(%)
Cumulative
Soil
Passing
(%)
19.1 mm (3/4”) 0 100
12.7 mm (1/2”) 81.871 18.129
9.52 mm (3/8”) 96.315 3.685
4.75 mm (No.4) 99.079 0.921
2.36 mm (No. 8) 99.089 0.911
1.18 mm (No.16) 99.119 0.881
0.6 mm (No. 30) 99.219 0.781
0.3 mm (No. 100) 99.274 0.726
0.15 mm (No. 100) 99.479 0.521
0.075 mm (No. 200) 99.750 0.250
PAN 100 0
By using the Aggregate Distribution Curve, dr
50
of the riprap gravels is 10,5 mm. These two riprap
models are used in this comparative study.
Comparative Study of Riprap Model Design for Scour Protection of Bridge Pier
177
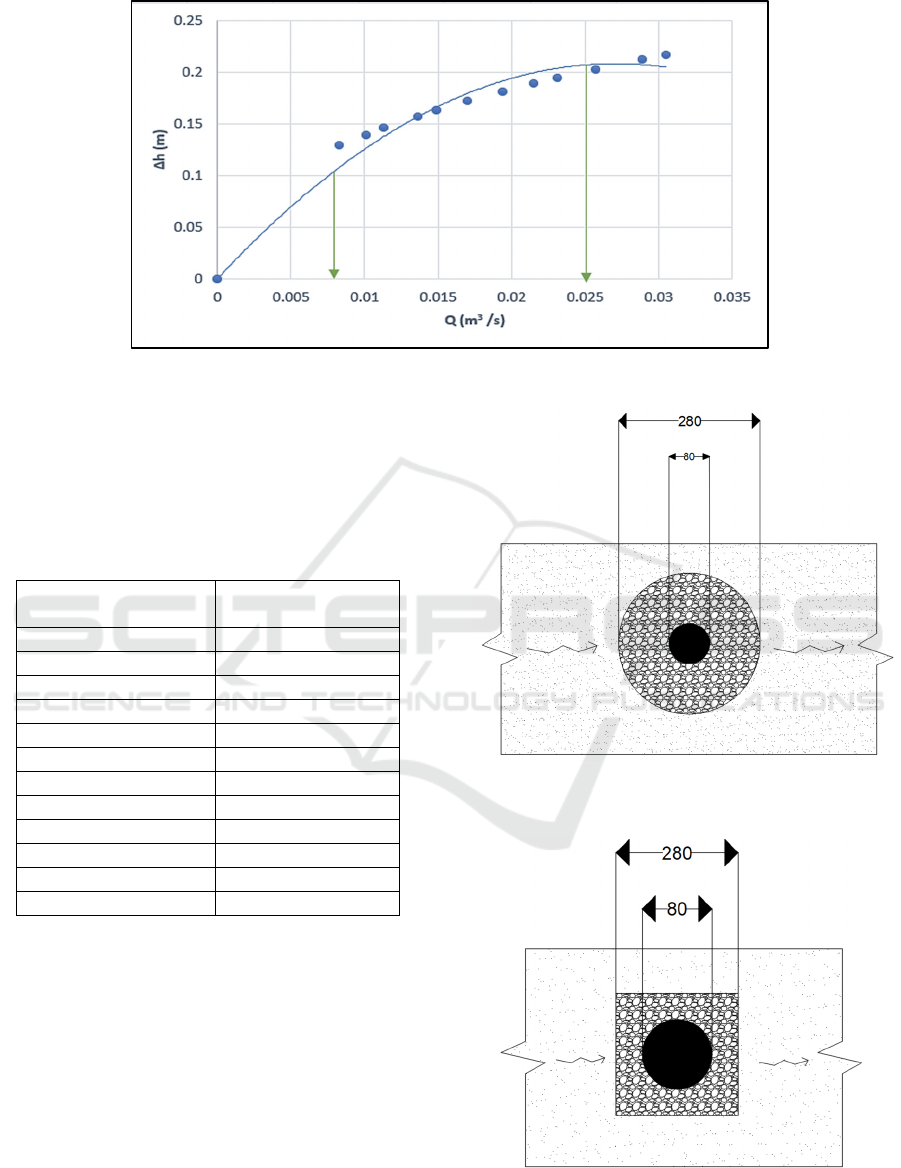
Figure 3: Discharge curve analysis.
3.2 Discharge Curve Analysis Results
From the discharge values in Table 2, the results of
the discharge curve analysis are obtained. The curve
is depicted in Figure 3.
Table 2: Discharge Data.
Δh
Discharge (Q)
(m
3
/s)
0.2169 0.0305
0.2124 0.0289
0.2026 0.0257
0.1941 0.0231
0.1886 0.0215
0.181 0.0194
0.1719 0.017
0.1631 0.0149
0.1569 0.0136
0.1459 0.0113
0.1394 0.0101
0.1292 0.0083
3.3 Scenario Riprap Model Design
The riprap models that were compared are circular
(Figure 4) and rectangular shaped (Figure 5). In this
study, the condition used is clear water condition,
under sediment-base layer design, and riprap layer
thickness. The riprap layer thickness used is 30 mm.
Figure 4: Illustration of riprap with circular shape (top view,
unit: mm).
Figure 5: Illustration of riprap with rectangular shape (top
view, unit: mm).
ICE-TES 2021 - International Conference on Emerging Issues in Technology, Engineering, and Science
178

4 CONCLUSIONS
The study shows that a riprap with a circular shape is
stronger than a rectangular shape. For 25% discharge,
the riprap with circular shape has 22% stronger than
a riprap with rectangular shape. For 50% discharge,
the riprap with circular shape has 28 % stronger than
a riprap with rectangular shape. For 75% discharge,
the riprap with circular shape has 33 % stronger than
a riprap with rectangular shape. Therefore, the
circular shape has presented about 20-35% stronger
with discharge under all discharge condition
compared to the rectangular shape.
The study also indicates that the riprap layer will
degrade to an equilibrium intensity below a given
constant discharge condition. Further studies are
necessary regarding the effect of flow type, the size
of bridge piers, such as the other shapes in which one
is stronger, and other related variables that can be
used in this study.
ACKNOWLEDGEMENTS
The author wishes to express their hearty thanks to
Civil Engineering Department, Maranatha Christian
University for the support and to LPPM (Lembaga
Penelitian & Pengabdian Masyarakat), Maranatha
Christian University.
REFERENCES
Hao, L. (1993). Hydraulic Computation for Riprap
Protection against Scouring around Bridge Piers [J].
Journal of Sediment Research, 3.
Khademghaeinya, G., Abrishami, J., Zarrati, A., Karimaei
Tabarestani, M., & Mashahir, M. (2020). Riprap design
at bridge piers with limited scouring. Scientia Iranica,
27(2), 588–595.
Rashno, E., Zarrati, A. R., & Tabarestani, M. K. (2020).
Design of riprap for bridge pier groups. Canadian
Journal of Civil Engineering, 47(5), 516–522.
Tallar, R. Y., & Suen, J.-P. (2017). Measuring the aesthetic
value of multifunctional lakes using an enhanced visual
quality method. Water, 9(4), 233.
Unger, J., & Hager, W. H. (2006). Riprap failure at circular
bridge piers. Journal of Hydraulic Engineering, 132(4),
354–362.
Comparative Study of Riprap Model Design for Scour Protection of Bridge Pier
179
