
Financial Ratio to Predict the Growth Income: Study on
Infrastructure Companies Listed on IDX
Ghina Kencana Mulia and Vina Kholisa Dinuka
Managerial Accounting Department, Politeknik Negeri Batam, Batam City, Riau Province, Indonesia
Keywords: Current Ratio, Debt to Equity Ratio, Total Assets Turnover, Net Profit Margin, Profit Growth.
Abstract: This study aims to determine the effect of liquidity, solvency, activity, and profitability on profit growth in
infrastructure sector companies in Indonesia. Liquidity is measured by Current Ratio (CR), solvency is
measured by Debt-to-Equity Ratio (DER), activity is measured by Total Assets Turnover (TATO), and
profitability is measured by Net Profit Margin (NPM). This study uses secondary data with data collection
techniques using financial statements of infrastructure sector companies listed on the Indonesia Stock
Exchange from 2014-2018. The purposive sampling method, obtained several 25 companies that fulfill the
criteria with a total population of 80 companies, so that the total sample of observation for five years was 125
samples. Testing is assisted by the EViews 9 program using panel data regression analysis. The result shows
that Total Assets Turnover has a significant positive effect on profit growth. While there is no significant
positive impact between current ratio into income growth. This study also found that the Debt-to-Equity Ratio
and Net Profit Margin have no significant adverse effect on profit growth in infrastructure sector companies.
1 INTRODUCTION
The increasingly growing competition in the business
world encourages business actors to carry out
company management to be more professional. One
thing that can be done is to increase the value of a
company’s success by making profit growth a
benchmark. The exposure to profit growth from the
results of the resource performance process for a
period can be reflected in the financial statements
(Manurung & Silalahi).
Financial reports are addressed to two objects,
namely internal parties, and external parties.
Management and the ranks of managers are included
in the targeted internal parties, while investors,
creditors, the government, and employees are
included in external parties. From the investor's point
of view, the financial statements can be further
processed through a comparison process and trend
analysis with other companies in the same field. The
financial statements can be used as consideration for
determining investment policies for their investments
for favorable prospects.
Nugroho, Nurdiansyah, and Erviana (2017) in
their research mention that profit growth is a potential
factor assessed by investors in determining the
success of managing a company. Predicting future
earnings can be done through financial ratio analysis.
The ratios used are Current Ratio, Debt to Equity
Ratio, Total Assets Turnover, Net Profit Margin.
Current Ratio works by appealing current assets
and current liabilities, so that the higher the current
assets, the higher the level of liquidity, meaning that
the company can pay off its short-term debt before
maturity (Mardiyanto, 2009).
Debt to Equity Ratio is part of the solvency ratio
which refers to the calculation of how much debt is
used to fund the company's capital (Salju, Dahri &
Rosmayanti, 2018). DER shows the percentage of the
company's health, if the ratio value obtained is high,
it is likely that the company runs at the expense of
creditors.
Total Assets Turnover is a ratio that calculates the
company's cability to effectively empower all
resources owned by the company. For company
owners and creditors, this ratio is useful to show the
amount of income that has increased due to the
efficient and productive use of fixed assets (Chariri &
Ghozali, 2003).
Net Profit Margin is a profitability ratio that
measures the final result and knows the company's
capability to yield a higher net profit than sales. Net
Profit Margin is a ratio that can represent the
Mulia, G. and Dinuka, V.
Financial Ratio to Predict the Growth Income: Study on Infrastructure Companies Listed on IDX.
DOI: 10.5220/0010860300003255
In Proceedings of the 3rd International Conference on Applied Economics and Social Science (ICAESS 2021), pages 19-25
ISBN: 978-989-758-605-7
Copyright
c
2022 by SCITEPRESS – Science and Technology Publications, Lda. All rights reserved
19

company's wealth obtained from the net profit after
tax on sales.
Profit as a measure of profit earned based on the
difference in income and costs with a certain period
profit is used as a basis for investment guidelines,
dividend policies, and tax bases (Hanafi & Halim,
2005). The profit referred to in this study is profit
after tax, where the profit is the result of the residual
income obtained after deducting all expenses.
Although this study has been tested by previous
researchers, there are mixed and inconsistent results.
This is the reason why this research needs to be raised
and reviewed. This research is development research
from study entitled "Financial Ratio to Prediction the
Growth Income" (Nugroho, Nurdiansyah & Erviana,
2017). The sample used in this test is the
infrastructure, utilities, and transportation sectors.
The infrastructure sector was chosen as a sample
because this sector receives a lot of investment, and
the government has the policy to prioritize
development. As long as infrastructure is still a
government priority, investment in this sector will
continue to grow and increase (Mubarak, Hafidz,
2019). This information becomes an overview of the
infrastructure sector in the future, the selected sample
is the infrastructure, utilities and transportation
sectors listed on the IDX for the period 2015 to 2019.
Based on the background that has been described,
the researcher is interested in raising the title
"Financial Ratio Analysis to Predicting the
Growth Income".
2 THEORETICAL STUDY
2.1 Agency Theory
Jensen & Meckling (1976) explained that through this
theory it is stated that there is a separation of rights
and obligations between managers and shareholders.
Managers or management are called agents as parties
who are authorized by shareholders and have the
responsibility to manage all forms of activities in the
company and are expected to be able to maximize the
owner's profits.
Shareholders are called principals, which are
parties who provide facilities and funds to run the
company. To minimize conflicts between the
principal and the agent, an agreement was made in the
form of an employment contract. It is hoped that the
agent will be able to maximize the owner's profit. The
principal can provide a guarantee or award to
management as a form of satisfaction with the results
of the company's performance for commensurate
reciprocity.
2.2 Signaling Theory
Suteja (2012) explains how management should
give signals or codes to financial statement users
(principals) regarding the successes and failures of
management (agents). The transfer of information
from internal parties to external parties regarding the
company's financial status often provides a better
understanding of the company's prospects, there is an
opportunity for asymmetric information to be
provided between management and outsiders.
Good news that reaches the public will have an
impact on changes in security prices. Asymmetric
information reduction can be used as the solution for
increasing the company’s value. If management can
provide a clear signal and impress the public, it will
reduce the anxiety of external parties such as
investors and creditors regarding the uncertainty of
the company's prospects. The signal can be used as an
indication of prosperity to the owners or shareholders.
2.3 Literature Review
Salju, Dahri, & Romayanti (2018) conducted a study
with a sample of Distributor Prima Palopo using four
financial ratios namely DER, WCTA, TATO, and
NPM. After the testing process was carried out, the
results showed that partially the DER and NPM
variables had a positive influence, in contrast the
WCTA and TATO variables did not positively
impact.
Ifada & Puspitasari (2016) test whether financial
ratios can predict future earnings by using the
variables CR, DAR, TATO, GPM and NPM. The
results showed that the variables TATO, GPM, and
NPM had a significant and positive impact on income
growth.
Kurniawati (2016) found empirical evidence that
the variables of Fixed Assets Turnover (PAT) and
ROA have a positive influence that is in line with
changes in future earnings. The result of regression
coefficient, the Time Interest Earned (TIE) variable
has a negative effect. Manurung and Silalahi (2016)
conducted a similar study with a sample of
manufacturing companies from 2010 to 2013. The
results found in this study were that the TATO &
NPM variables had a significant positive impact on
forecasting the income rise.
Utami (2017) examines financial ratios that can be
used as benchmarks to predict profit growth with a
sample of LQ45 index companies in 2013-2016.
ICAESS 2021 - The International Conference on Applied Economics and Social Science
20

From the results of the t-test used, the results show
that TATO and ROA have a partial effect on profit
increases, while DAR, CR and PER have no
significant effect on predicting earnings changes.
Suprapti, Qonita, & Hidayat (2019) examine the
analysis of financial performance in predicting
revenue growth. The examiner uses CR, TATO, and
ROA as the dependent variable in manufacturing
companies for the 2016-2017 period. Based on the
results obtained, only the CR and ROA variables have
a positive influence in predicting an increase in profit,
while the TATO variable has no effect in predicting
an increase in profit.
Baraja & Yosya (2018) examined consumption
sector companies listed on the IDX for the period
2014 to 2017 with the aim of research to determine
the effect of liquidity ratios, profitability, activity, and
solvency in changes in income. The finding proof that
only profitability ratios have an impact on profit
changes, this ratio is represented by NPM.
Andriyani (2015) has conducted tests on mining
companies which concluded that the four variables
studied influences on profit growth. The variables are
CR, DAR, TATO, and ROA. Partially, the variable
that has an influence on the increase in profit is ROA.
Prakarsa (2019) examines the predictions of
mining sector companies in the next five years. The
study was conducted using annual financial reports
from 2013 to 2015 using several financial ratios, such
as QR, DAR, DER, TATO, and Inventory Turnover.
The researcher obtained the results that partially QR,
DER and inventory turnover variables had a
significant effect on increasing profits.
2.4 Hypothesis Development
2.4.1 Effect of Current Ratio on Profit
Growth
CR can describe whether current assets can pay off a
company's short-term debt. In other words CR can be
used as a value to measure the margin of safety in a
company (Kasmir, 2016). Research by Utami (2017)
states that the CR variable does not have a significant
impact on income growth. It proves that the
company's capability to complete short-term
obligations does not warrant the availability of capital
to help the operational activities of the firm. Based on
this statement, the hypotheses proposed from this
study are:
H1: Current Ratio has a negative effect on growth
2.4.2 Effect of Debt to Equity Ratio on
Profit Growth
DER is a ratio that can indicate a measure of the firm's
capital ability to pay off its debts. The measuring tool
for assessing this ratio is by comparing total debt to
capital (Kasmir, 2016). The research of Snow, Dahri
& Rosmayanti (2018) proof that DER has a positive
impact on profit growth. Nugroho, Nurdiansyah, and
Erviana (2017) also strengthen empirical evidence
that DER has a positive effect on profit growth. Based
on this statement, the hypotheses proposed from this
study are:
H2: Debt to Equity Ratio has a positive influence
on profit growth
2.4.3 Effect of Total Assets Turnover on
Profit Growth
TATO is a measuring tool to show the amount of
income that increases due to fixed assets. The higher
the value of the comparison of sales to assets, it means
the better the sales strategy or method used (Kasmir,
2016). In Utami's research (2017) it was found that
TATO has a positive effect on profit growth by
describing the level of efficiency in using all assets to
increase sales. Based on this statement, the
hypotheses proposed from this study are:
H3: Total Assets Turnover has a positive effect on
profit growth
2.4.4 Effect of Net Profit Margin on Profit
Growth
Companies with healthy financial conditions should
have a positive NPM value. This is because a positive
NPM value indicates the company has not suffered a
loss. NPM can show the high or low level of
profit/profit obtained by the company (Kasmir,
2016).
Baraja and Yosya (2018) state that the greater the
NPM value, the better because the company is
considered capable of achieving high enough income
and will have a positive effect on increasing profits.
Therefore, the fourth hypothesis is obtained as
follows:
H4: Net Profit Margin has a positive effect on
profit growth.
The research model can be seen in Figure 1:
Financial Ratio to Predict the Growth Income: Study on Infrastructure Companies Listed on IDX
21
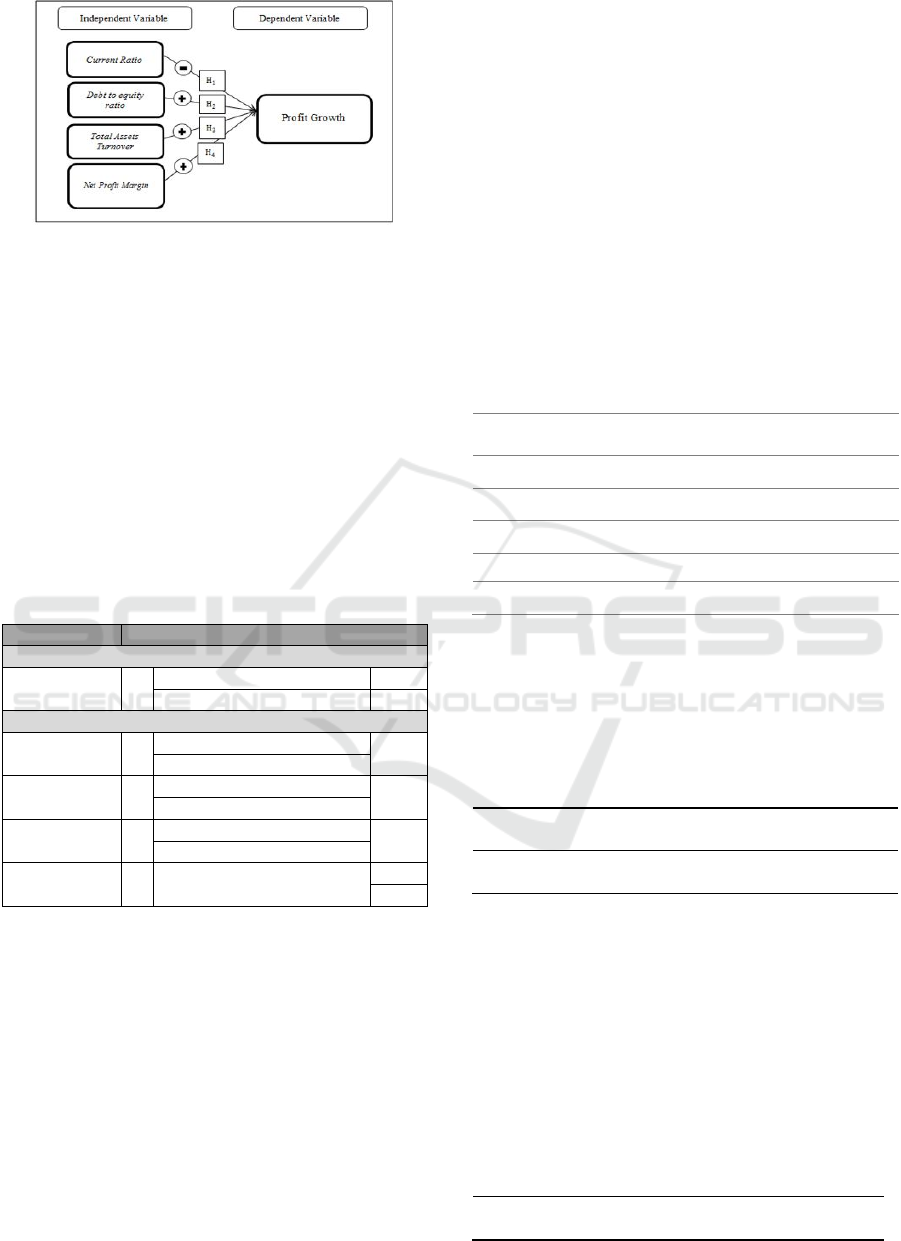
Figure 1: Research Model.
3 RESEARCH METHOD
This study uses a quantitative approach which is a
type of structured, systematic, and planned research
that aims to prove how the influence between the
dependent variable and the independent variable is.
The independent variables used are financial ratios
represented by CR, DER, TATO, and NPM. While
the dependent variable used is profit growth.
Operational variables and their indicators can be seen
in table 1:
Table 1: Operational variables and indicator.
Variable Indicator
De
p
endent Variable
Profit
Growth
=
Sales-Cost of Sales
Total Assets
Independent Variable
CR =
Current Assets
Current Liabilities
DER =
Total Liabilities
E
q
uit
y
TATO
=
Sales
Total Sales
NPM
=
(Net Profit / Net Sales) x
100%
The population of this research is Indonesian
companies from the infrastructure, utility, and
transportation sector listed in the Indonesia Stock
Exchange which provides the annual reports. The
total population of 80 companies for five periods
from 2015 to 2019 was obtained from the
www.idx.co.id page.
This study is analyzed using the panel data
regression equation using E-Views 9 software. Data
analysis in this study uses descriptive statistical
analysis. The estimation model was determined using
the Chow test and Hausman test. The classical
assumption test used is the heteroscedasticity test and
multicollinearity test, and the hypothesis test is the
coefficient of determination, t test, and f test.
4 RESULT AND ANALYSIS
This research using listed infrastructure companies
during 2014-2018 with total 25 companies. This
amount is reduced by the criteria of the research
sample. The total sample for 2014-2018 that meets
the criteria is 25 companies or 125 data samples.
4.1 Descriptive Statistical Analysis
Below is a descriptive statistical analysis table:
Table 2: Descriptive statistical table.
Variable Mean Max Min Std.De
v
Y
-0.287 16.202 -16.040 2.878
CR
2.206 49.774 0.134 5.921
DER
4.599 370.574 -3.171 33.069
TATO
0.665 7.043 0.064 1.013
NPM
-0.023 0.772 -3.859 0.569
4.2 Model Selection
4.2.1 Chow Test
Table 3: Chow Test.
Effect Test
Statist
ic
d.f. Prob
Cross-section F
1.904
2
(24,96) 0.0149
Cross-Section Chi-
S
q
uare
48.67
05
24 0.0021
Based on table 3, the value of Prob. Cross-section
F is smaller than 5% alpha (0.0149 > 0,05), which
means the best estimation model is FEM.
4.2.2 Hausman Test
This test aims to determine the suitable model
between FEM or REM.
Table 4: Hausman Test.
Test Summary
Chi-Sq.
Statistic
Chi-
S
q
. d.f.
Prob.
Cross-section
rando
m
12.186036 4 0.016
ICAESS 2021 - The International Conference on Applied Economics and Social Science
22
Based on table 4, the cross-section value is
smaller than alpha 5% (0.016 < 0.05), which means
that the best estimation model is the FEM, because
the results of the Chow test and the Hausman test both
shows that the correct model is FEM, so it is no need
to do the next test, that is the Lagrange multiplier test.
4.3 Classic Assumption Test
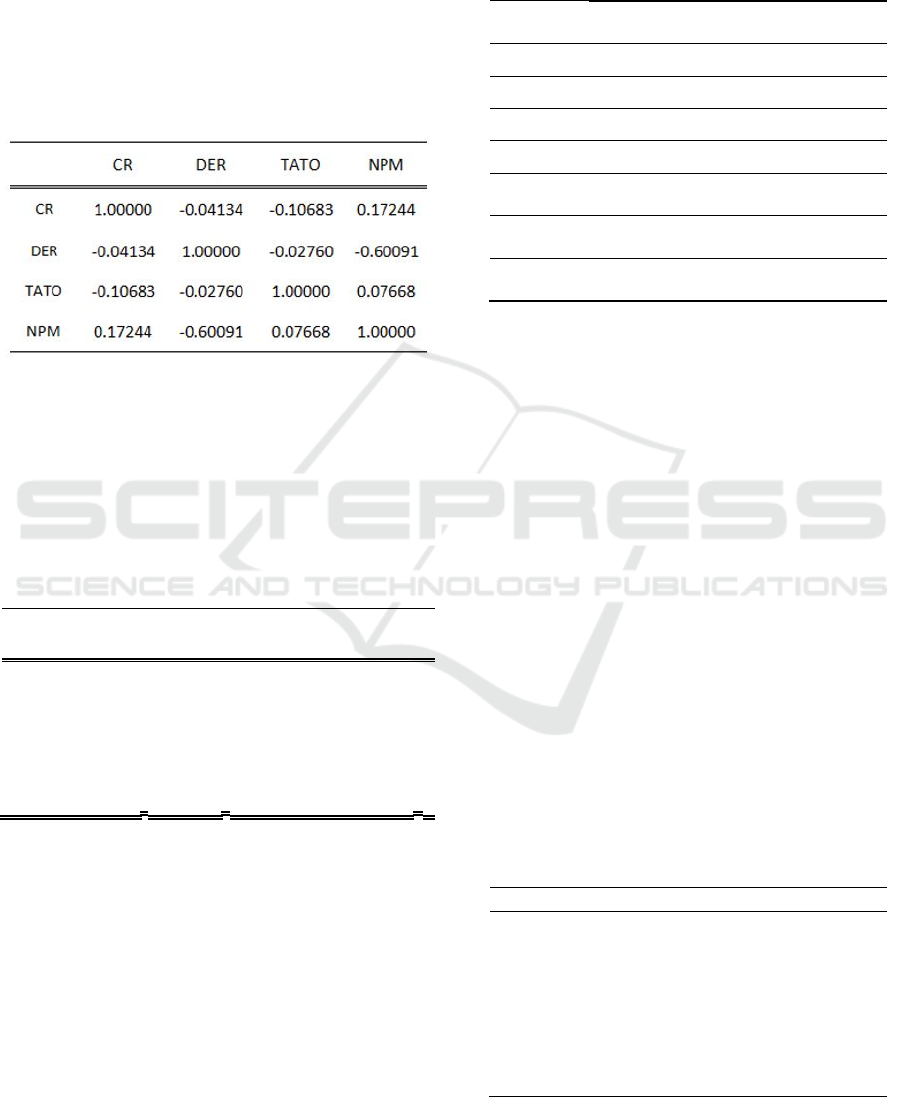
4.3.1 Multicollinearity Test
Figure 2: Multicollinearity Test.
The value of the correlation coefficient between
variables has a value less than 0.8. This indicates that
the data used in this test does not occur
multicollinearity.
4.3.2 Heteroscedasticity Test
Table 5: Heteroskedasticity Test: Glejser.
Heteroskedasticit
y
Test: Gle
j
se
r
F-statistic
0.127093
Prob. F (4,120)
0.9724
Obs*R-square
d
0.527322
Prob. Chi-Square
(
6)
0.9708
Scaled
explained SS
1.105051
Prob. Chi-Square
(
6)
0.8935
The table above shows that the value of Obs*R-
squared is 0.527322 and the p-value is 0.9708. Where
the value is > 0.05. It was concluded that the data did
not experience heteroscedasticity problems.
4.4 Hypothesis Test
Table 6 Hypothesis Test.
Variable Coefficient t-statistic Prob.
C -1.169389
-
2.822985 0.0058
CR 0.046117 0.857777 0.3932
DER -0.010601 -0.985471 0.3269
TATO 1.227272 2.713606 0.0079
NPM -0.586095 -0.742557 0.4596
Adjusted
R-Square
d
0.1342
Prob (F-
Statistic)
0.0324
Model
Result
Fixed
4.4.1 Coefficient of Determination
The Adjusted R-squared value in table 6 shows a
value of 0.1342 or the equivalent of 13.42%. This
value indicates that the amount of profit growth that
is influenced by CR, DER, TATO, and NPM is
13.42%. 886.58% of the remaining value is explained
by other variables not examined in this test.
4.4.2 F Test
The results of the F test with the dependent variable
of the Profit Growth can be seen in table 6. The
probability value (F-statistic) is 0.0324, this value is
smaller than the alpha level (5%). This means that it
can be said that CR, DER, TATO, and NPM
simultaneously affect Profit Growth.
4.5 Results Discussion
The following is a summary table of test results from
the study:
Table 7: Result Discussion.
Hypothesis Result
H1: Current Ratio has negative
effect on profit
g
rowth
Not
Supporte
d
H2: Debt to Equity Ratio has
p
ositive effect on profit
g
rowth
Not
Supporte
d
H3: Total Assets Turnover has
p
ositive effect on profit
g
rowth
Supported
H4: Net Profit Margin has
p
ositive effect on profit
g
rowth
Not
Supporte
d
Financial Ratio to Predict the Growth Income: Study on Infrastructure Companies Listed on IDX
23

4.5.1 Effect of Current Ratio on Profit
Growth
Judging from the results of statistical tests, H1 states
that the level of liquidity as measured by the CR
variable has a positive and insignificant direction on
profit growth, the test results do not support
hypothesis 1. In line with Utami's research (2017)
which explains that CR has no significant positive
impact on profit growth. It means that the company's
capability to complete short-term obligations does not
warrant the availability of capital to help the
operational activities of the firm, so that the profits to
be achieved are not as expected.
The results of this study are supported by
Andriyani (2015) who explains that CR does not have
a significant impact on profit growth, because the CR
value depends on the type of business firm, the faster
the company pays off short-term debt, the greater the
CR value obtained there are no special provisions that
can state the amount of CR value that is considered
good.
4.5.2 Effect of Debt-to-Equity Ratio on
Profit Growth
Based on the results of statistical tests, it is stated that
DER has a negative and insignificant direction on
profit growth, so the test results do not support
hypothesis 2. The company's reduced ability to
increase the level of productivity as a result of less-
than-optimal asset financing and will have an impact
on the company's declining income level.
The results of a similar study by Baraja & Yosya
(2018) explain that DER does not have a significant
negative effect on profit growth, this variable is
declared to have no effect because if the capital used
comes from debt, the greater the burden that must be
borne by the company. A high equity value will
reduce the negative impact of declining profits,
because the DER measurement uses the equity value
as a divisor.
4.5.3 Effect of Total Assets Turnover Ratio
on Profit Growth
Based on the finding of this research, it is stated that
the TATO variable has a positive and significant
direction on profit growth, so it can be concluded that
hypothesis 3 is supported. The TATO value has a
significant effect because the company can use its
assets effectively. The relatively small tariffs and
other costs in the infrastructure industry can support
high sales levels.
In line with research by Utami (2017) which
reveals that TATO has a significant positive impact
on profit growth, the TATO variable assumes that the
firm's asset turnover is very effective in generating
profits, where if the company produces a faster asset
turnover rate, the profit earned will rise. This is
because the firm can take benefit from assets for sales
increasing which has an impact on increasing profits.
4.5.4 Effect of Net Profit Margin on Profit
Growth
Based on the finding of this research, it is shown that
NPM has a negative and insignificant direction on the
dependent variable, so the test results do not support
hypothesis 4. The NPM value that does not have a
negative impact on profit growth is due to the average
value of NPM in the infrastructure industry during the
research period only around the number -0.023. The
unstable and fluctuating NPM value cannot affect
profit growth because the change in profit value tends
to be stable.
The results of this study are supported by Yanti
(2017), where in theory a healthy company has a
positive NPM value which indicates that the company
does not suffer losses, but a low NPM value can occur
because the profit from sales obtained by the
company cannot cover operating expenses and high
tax rates. imposed.
5 CONCLUSION
Based on the results of the tests and discussions that
have been described, conclusions can be drawn
regarding the effect of liquidity ratios, solvency,
activity and profitability on listed infrastructure,
transportation, and utilities sector companies on IDX
from 2014 to 2018. The independent variables used in
this study are Current Ratio (CR), Debt to Equity
Ratio (DER), Total Assets Turnover (TATO), and
Net Profit Margin (NPM). The dependent variable
used in this study is profit growth. The test results
show that only the TATO variable influences profit
growth, while the CR, DER, and NPM variables have
no effect on predicting profit growth.
The results of this study support agency theory,
which requires shareholder trust in management.
Management is expected to achieve the company's
goal of achieving the highest profitability by
maintaining the company's financial health.
Management can control the good use of assets to
help the company achieve maximum profit. Control
of all assets can be seen through the TATO ratio,
ICAESS 2021 - The International Conference on Applied Economics and Social Science
24

where this ratio shows the level of efficiency of the
company in using all assets. So that good asset control
is needed in infrastructure sector companies.
The application of signal theory in this sector can
be seen from all companies listed in the infrastructure
sector which display the number of Sales and Total
assets in the annual financial statements for each
period. Information obtained that the average value of
TATO in the infrastructure sector shows a value of
0.665. This value is less than 1, where net sales from
the infrastructure sector are not able to cover total
assets. The minimum value of asset utilization in the
infrastructure industry is 0.064 or not less than 0, this
indicates that all infrastructure sector companies use
less debt than assets to generate sales. Good
management performance can be seen from the
ability to sell assets which is getting higher. The more
effective the management in managing its assets, the
better the level of efficiency in the use of assets to
support sales.
REFERENCES
Andriyani, I. (2015). Pengaruh Rasio Keuangan Terhadap
Pertumbuhan Laba pada Perusahaan Pertambangan
yang Terdaftar di BEI. Jurnal Manajemen dan Bisnis
Sriwijaya, 343-358.
Baraja, L., & Yosya, E. A. (2018). The Impact of Liquidity,
Profitability, Activity and Solvency Ratio on Change in
Earnings. Indonesian Managemen and Accounting
Research, 1-17.
Chariri, & Ghozali, I. (2003). Teori Akuntansi. Semarang:
BP UNDIP.
Ghozali, I. (2016). Aplikasi Analisis Multivariate Program
IBM SPSS 23 (8 ed.). Semarang: UNDIP.
Hanafi, M., & Halim, A. (2005). Analisis Laporan
Keuangan, edisi kedua. Jakarta: PT. Raja Grafindo
Persada.
Ifada, L. M., & Puspitasari, T. (2016). Analisis Pengaruh
Rasio Keuangan Terhadap Perubahan Laba. Jurnal
Akuntansi & Auditing, 97-108.
Jensen, & Meckling. (1976). Theory of The Firm:
Managerial Behavior, Agency Cost and Ownership
Structure. Journal of Financial Economics, 305-360.
Kasmir. (2016). Analisis Laporan Keuangan. Jakarta: Raja
Grafindo Persada.
Manurung, C. S., & Silalahi, E. R. (2016). Analisis Rasio
Keuangan Dalam Memprediksi Perubahan Laba pada
Perusahaan Manufaktur Yang Terdaftar di BEI. Jurnal
Riset Akuntansi dan Keuangan, 35-62.
Mardiyanto, H. (2009). Inti Sari Manajemen Keuangan.
Jakarta: Grasindo.
Mubarak , Hafidz;. (2019, 07 30). Beritagar.id. Retrieved 4
28, 2020, from Beritagar.id:
https://market.bisnis.com/read/20191029/189/1164253
/indeks-sektor-properti-dan-infrastruktur-melaju-
simak-rekomendasi-mnc-sekuritas
Nugroho, E. S., Nurdiansyah, D. H., & Erviana, N. (2017).
Financial Ratio to Predicting the Growth Income.
International Review of Management and Marketing,
77-84.
Prakarsa, R. B. (2019). EFFECT OF FINANCIAL RATIO
ANALYSIS ON PROFIT GROWTH IN. e-Jurnal
Apresiasi Ekonomi, 90-94.
Salju, Dahri, & Rosmayanti. (2018). Penggunaan Rasio
Keuangan dalam Memprediksi Pertumbuhan Laba pada
Distributor Prima Palopo. Equilibrium, 70-89.
Suprapti, E., Qonita, & Hidayat, A. (2019). Analysis of
Financial Performance in Predicting Earning Growth .
Journal of Accounting and Strategic Finance, 70-81.
Suteja. (2012). Manajemen Keuangan Perusahaan, Edisi 1.
Bandung: Medio.
Utami, W. B. (2017). Analysis of Current Ratio Changes
Effect, Asset Ratio Debt, Total Asset Turnover, Return
On Asset, And Price Earning Ratio In Predictinggrowth
Income By Considering Corporate Size In The
Company Joined In Lq45 Index Year 2013 -2016.
International Journal of Economics, Business and
Accounting Research (IJEBAR, 25-37.
Yanti, N. S. (2017). Dampak Kinerja Keuangan Terhadap
Pertumbuhan Laba (Studi Kasus pada Perusahaan
Makanan dan Minuman yang Terdaftar di Bursa Efek
Indonesia Tahun 2010-2016). Jurnal Ekonomi dan
Bisnis Dharma Andalas, 220-234.
Financial Ratio to Predict the Growth Income: Study on Infrastructure Companies Listed on IDX
25
