
Analysis of Factors Retailer Brand, Information Richness and Easy of
Use on Buying Interest in using ShopeePay
Yulinda Tarigan and Khalishah Aptiyani
Applied Business Administration, Politeknik Negeri Batam, Jl. Ahmad Yani Batam Centre 29461, Indonesia
Keywords: Retailer Brand, Information Richness, Ease of Use dan ShopeePay.
Abstract: This study aims to test and analyse factors retailer brand, information richness, and ease of use towards the
buying interest student of Batam City using ShopeePay. This exploration utilizes a quantitative methodology
with various straight investigation utilizing SPSS 22 programming. Information assortment is gathered by
disseminating Google Form survey connects to an example of 370 individuals who are ShopeePay clients in
Batam City. The outcomes showed that there was an impact of retailer brand, information richness, and ease
of use experience both part of the way and stimulatively on buying choices through Shopee online business.
In this investigation, the computation of the coefficient of assurance got by 0.260. This implies that 26% of
purchasers purchasing revenue is clarified by retailer brand, information richness, and easy of use factors,
while the rest is clarified by different factors.
1 INTRODUCTION
The advancement of information technology is
currently experiencing a fairly rapid development.
The advancement of data innovation has prompted
different sorts of innovation-based exercises, for
example, e-government, online business, e-
instruction, e-medication, e-research center, and
others, which are all founded on hardware (Nuryanto,
2012). One of the positive impacts arising from the
development of technology and the flow of
information is the increasing number of payment
instruments, which previously only had cash, is now
developing into payments made by electronic
systems. This also causes consumer buying interest to
increase due to the influence of online shopping.
Based on the results of the Kandata Insight Center
(KIC), one of the most frequently used electronic
payment instruments today is ShopeePay. ShopeePay
is a digital wallet provided by shopee, where buyers
can make payments using ShopeePay without having
to pay cash.
The existence of ShopeePay affects consumer
buying interest, where the buying interest arises due
to internal and external factors. The internal factors
include trust, convenience, brand image and price,
while external factors include Retailer Brands,
Information
Richness and Extended Offers
Figure 1: Electronic Payment Instrument.
(Ramadanty & Kartikasari, 2020). Past research has
examined Retailer Brands, Information Richness and
Extended Offers on Gopay products (Ramadanty &
Kartikasari, 2020). On this occasion, I would like to
analyze some of these internal and external factors on
the buying interest of students in Batam for products.
Based on this, the researcher will carry out
research with the title:
376
Tarigan, Y. and Aptiyani, K.
Analysis of Factors Retailer Brand, Information Richness and Easy of Use on Buying Interest in using ShopeePay.
DOI: 10.5220/0010934600003255
In Proceedings of the 3rd International Conference on Applied Economics and Social Science (ICAESS 2021), pages 376-381
ISBN: 978-989-758-605-7
Copyright
c
2022 by SCITEPRESS – Science and Technology Publications, Lda. All rights reserved
“ANALYSIS OF RETAILER BRAND,
INFORMATION RICHNESS AND EASY OF USE
ON BUYING INTEREST IN USING
SHOPEEPAY”
2 METHODS
2.1 Popuation and Sample
Population is an overall attribute that can be humans,
objects or events contained in a predetermined area
and become the focus of research (Muri, 2017). The
population in this study were 5 universities majoring
in management in the city of Batam, namely Batam
State Polytechnic, Batam International University,
Riau Islands University, Batam University, and
Putera Batam University using ShopeePay. So that in
this investigation the examples contemplated were
370 individuals who were ShopeePay clients.
Furthermore, to obtain a total of 370 samples
representing the population in the study area, a
proportionate sampling was carried out, namely
counting the number of students proportionally from
the 5 universities. The method of distributing the
questionnaire is based on the number of students in
each university which is calculated as a proportionate
sampling with the formula:
𝑛𝑖 =
.𝑛 (1)
ni: The number of samples according to the stratum
n: Total number of samples
Ni: Total population according to the stratum
N: Total Population
Based on the above calculations, the number of
samples per university is as follows:
Table 1: Student Population of 5 University Management
Department S1 / D4 in Batam City.
NO UNIVERSITY Total
1 Politeknik Ne
g
eri Bata
m
113
2 Universitas Internasional
Batam
92
3 Universitas Riau Kepulauan 44
4 Universitas Batam 9
5 Universitas Putera Bata
m
112
Total 370
This examination utilizes a quantitative technique
utilizing different direct investigation. Multivariate
straight examination is an assessment used to show
the presence or non-presence of a causal association
between two free factors and the dependent variable.
3 RESULTS AND DISCUSSION
3.1 Instrument Test
3.1.1 Validity Test
The following is a detailed table of the results of the
validity test for each variable used in this study,
namely:
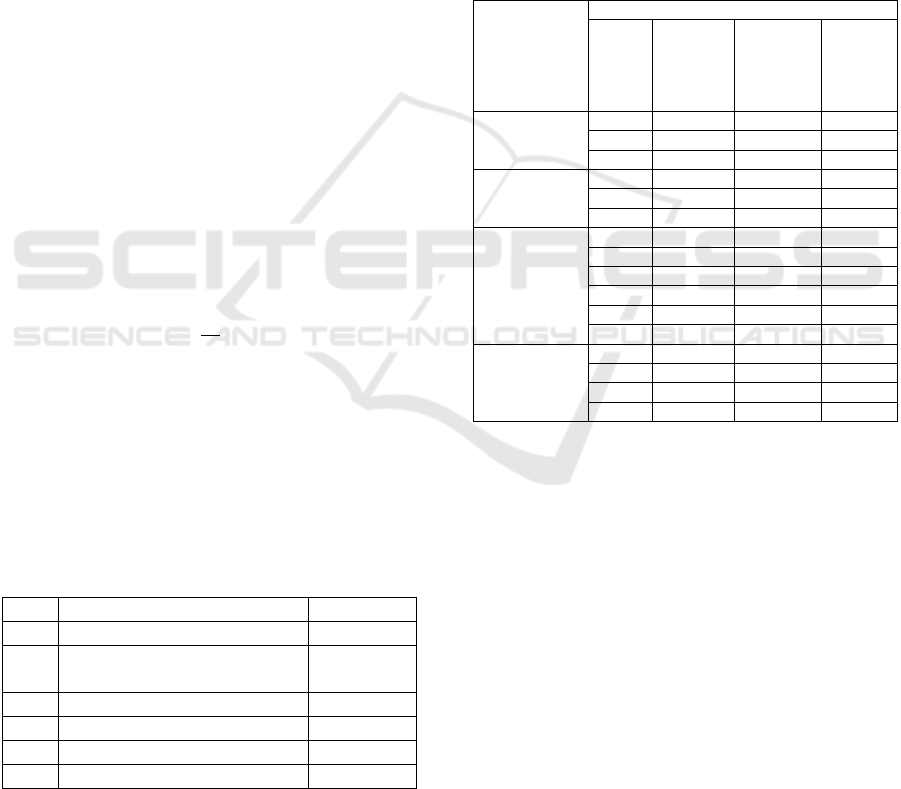
Table 2: Validity Test Results.
Variable
Validity
Item
r
calculate
r
standards
Remark
Retailer
Brand (X1)
X1.1 0,777 0,102 Valid
X1.2 0,736 0,102 Valid
X1.3 0,792 0,102 Valid
Information
Richness
(X2)
X2.1 0,740 0,102 Valid
X2.2 0,671 0,102 Valid
X2.3 0,658 0,102 Valid
Easy of Use
(X3)
X3.1 0,708 0,102 Valid
X3.2 0,640 0,102 Valid
X3.3 0,582 0,102 Valid
X3.4 0,618 0,102 Valid
X3.5 0,689 0,102 Valid
X3.6 0,714 0,102 Valid
Purchase
Intention (Y)
Y.1 0,692 0,102 Valid
Y.2 0,590 0,102 Valid
Y.3 0,573 0,102 Valid
Y.4 0,587 0,102 Valid
(Source: Processed data, 2021)
From the validity test carried out in this study
carried out on the statement indicator on the Retailer
Brand (X1), Information Richness (X2), Information
Richness (X3) and Consumer Purchase Interest Using
ShopeePay (Y) which was tested with SPSS version
22, by comparing Between r count and r table, it can
be seen that the value of r count of all items /
statement indicators is greater than r table of 0.102, it
can be said that all statements are worthy of being
used as a measuring tool.
3.1.2 Reliability Test
The results of the reliability test for each variable in
this study can be seen from the calculation results in
the following:
Analysis of Factors Retailer Brand, Information Richness and Easy of Use on Buying Interest in using ShopeePay
377
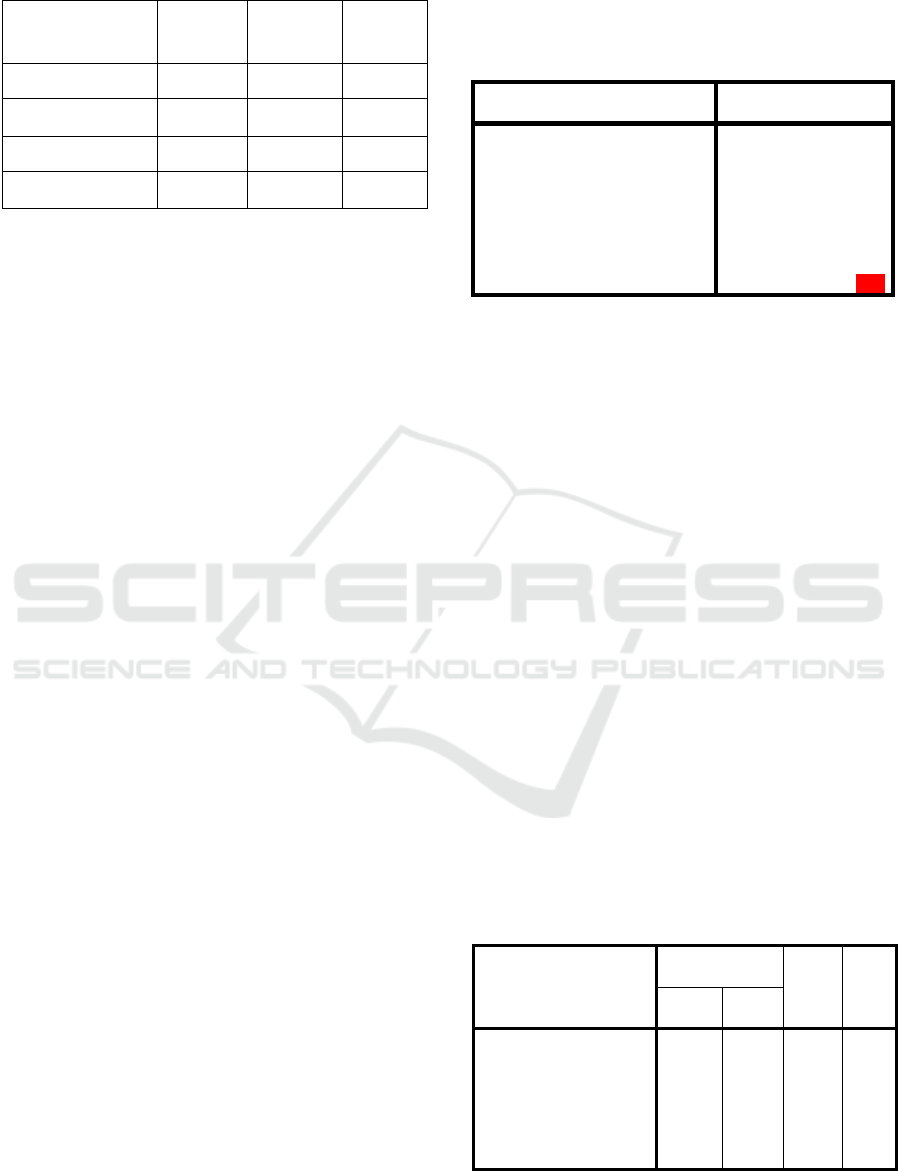
Table 3: Reliability Test Results.
Variabel
Cronbach
Alpa
Cut of
Cronbach
Al
p
ha
Remark
Retailer Brand (X1) 0,812 0.60 Reliabel
Information
Richness (X2)
0,767 0.60 Reliabel
Easy of Use (X3) 0,763 0.60 Reliabel
Purchase Intention
(Y)
0,729 0.60 Reliabel
(Source: Processed data, 2021)
Based on the results of the reliability test in Table
3 above, it can be seen that all statement items /
indicators on the Retailer Brand, Information
Richness, Ease of Use and Consumer Purchase
Interests variables have a value greater than 0.60 so
that all statement items / indicators are reliable.
3.1.3 Descriptive Statistics
Descriptive analysis of respondents' answers was
carried out to determine the average score of each
question item or statement that the respondent had
answered. Based on the results of research conducted
on 370 respondents in distributing questionnaires via
google form.
Based on 5 universities majoring in D4 / S1
management in Batam City, Batam State Polytechnic
respondents were 113 people with a percentage of
31%, Batam International University there were 92
people with a percentage of 25%, Riau Islands
University as many as 44 people with a percentage of
12%, Batam University there were 9 people with a
percentage of 2%, and University of Putera Batam
there were 112 people with a percentage of 30%.
Based on age, respondents aged 18 years are 3
individuals with a level of 1%, respondents aged 19
years are 55 individuals with a level of 15%,
respondents aged 20 years are 79 individuals with a
level of 21%, respondents aged 21 years are 97
individuals with a level of 26% , respondents aged 22
years added up to 88 individuals with a level of 24%,
respondents aged 23 years added up to 25 individuals
with a level of 7%, respondents aged 24 years added
up to 9 individuals with a level of 2%, respondents
aged 25 years added up to 7 individuals with a level
of 2%, respondents There are 3 individuals aged 26
years with a level of 1%, 2 individuals aged 27 years
with a level of 1%, 28 years of age respondents
adding up to 1 individual with a level of 0%,
respondents aged 29 years adding up to 1 individual
with a level of 0%.
3.1.4 Normality Test
Table 4: Normality Test.
One-Sample Kolmogorov-Smirnov Test
Unstandardized
Residual
N
370
Normal
Parameters
a,b
Mean ,0000000
Std.
Deviation
1,27657639
Most Extreme
Differences
Absolute ,068
Positive ,035
Negative -,068
Kolmogorov-Smirnov Z
1,316
Asymp. Sig. (2-tailed) ,062
a. Test distribution is Normal.
b. Calculated from data.
Based on the table above, it can be seen that the data
is normally distributed because the significant value
of the data is normally distributed, namely 0, 062
which is greater than 0.05.
3.1.5 Multiple Linear Regression Analysis
Multiple linear regression analysis with the aim of
proving the effect of Retailer Brand (X1),
Information Richness (X2) and Ease of Use (X3) on
purchase interest in using ShopeePay (Sugiyono,
2017). Multiple linear regression equation analysis as
follows:
Y = a + b1X1 + b2X2 + b2X3 + e (2)
Remark:
Y = Minat Beli Konsumen
a = Konstanta.
b = Koefisien regresi.
X1 = Retailer Brand.
X2 = Information Richness.
X3 = Easy of Use.
e = Error.
Table 5: Results of Multiple Linear Analysis.
Model
Unstandardized
Coefficients
t Sig. B
Std.
Error
1 (Constant) 5,545 ,743 7,464 ,000
RETAILER
BRAND (X1)
,287 ,066 4,353 ,000
INFORMATION
RICHNESS (X2)
,171 ,063 2,698 ,007
EASY OF USE
(X3)
,166 ,038 4,428 ,000
a. Dependent Variable: MINAT BELI KONSUMEN (Y)
ICAESS 2021 - The International Conference on Applied Economics and Social Science
378

Based on table 5, it can be seen that the multiple linear
regression equation is as follows:
Y = a + b1X1 + b2X2 + b2X3 + e (3)
Y = 5.545 + 0.287X1 + 0.063X2 + 0.038X3 + e (4)
From this equation, it is described as follows:
1. The consistent worth (a) for the relapse condition
is equation is 5.545. This means that the average
consumer purchase interest variable will be 5,545 if
the Retailer Brand (X1), Information Richness (X2),
and Ease of Use (X3) variables are equal to 0.
2. Value 𝛽1 = 0.287, indicating a positive and
significant effect between Retailer Brands on
consumer buying interest, which means that the
Retailer Brand dimension increases, it will result in
an increase in consumer buying interest.
3. Value 𝛽2 = 0.171, shows a positive and significant
effect between Information Richness on the consumer
purchase interest variable, which means that if the
dimension of Information Richness increases it will
result in an increase in consumer buying interest.
4. The value 𝛽3 = 0.166, shows a positive and
significant effect between Ease of Use on the
consumer buying interest variable, which means that
if the Ease-of-Use dimension increases it will result
in an increase in consumer buying interest.
3.2 Hypothesis Test
3.2.1 T Test
The t factual test is utilized to test the extent of the
impact between the free factors in part on the reliant
variable, then, at that point testing the coefficient of
every regression (Priyatasma, 2017). If the
significance <0.05, the independent variable
significantly affects the dependent variable.
Table 6: Test Results t.
Model
Unstandardized
Coefficients
t Sig.B
Std.
Error
1 (Constant) 5,545 ,743 7,464 ,000
RETAILER
BRAND (X1)
,287 ,066 4,353 ,000
INFORMATION
RICHNESS (X2)
,171 ,063 2,698 ,007
EASY OF USE
(X3)
,166 ,038 4,428 ,000
a. Dependent Variable: MINAT BELI KONSUMEN
(Y)
Based on table 7, the t test results will be
explained as follows:
1) The Influence of Retailer Brands on Consumer
Purchase Intention (H1)
It is known that the Sig value for the effect of Retailer
Brand (X1) on consumer buying interest (Y) is 0.000
<0.05 and the t value is 4.353 > t table = t (ɑ / 2; n - k
- 1 = t (0.05 / 2; 370 - 3 - 1) = (0.025; 366) = 0.02034,
so it can be concluded that H1 is accepted, which
means that there is a positive influence between
Retailer Brand (X1) on consumer buying interest (Y).
2) The Effect of Information Richness on
Consumer Purchase Interest (H2)
It is known that the Sig value for the effect of
Information Richness (X2) on consumer buying
interest (Y) is 0.007 <0.05 and the t value is 2.698 > t
table = t (ɑ / 2; n - k - 1 = t (0.05 / 2; 370 - 3 - 1) =
(0.025; 366) = 0.02034, so it can be concluded that
H1 is accepted, which means there is a positive
influence between Information Richness (X2) on
consumer purchase interest (Y).
3) The Effect of Ease of Use on Consumer
Purchase Interest (H3)
It is known that the Sig value for the effect of Ease of
Use (X3) on consumer buying interest (Y) is 0.000
<0.05 and the t value is 4.428 > t table = t (ɑ / 2; n - k
- 1 = t (0.05 / 2; 370 - 3 - 1) = (0.025; 366) = 0.02034,
so it can be concluded that H1 is accepted, which
means there is a positive influence between Ease of
Use (X3) on consumer buying interest (Y).
3.2.2 F Test
The F test expects to show whether all free factors
affect the reliant variable. On the off chance that the
worth of Fcount> Ftable and an importance esteem <
0.05, all independent factors have a huge impact at
the same time on the reliant variable.
Table 7: Test Results F.
Model
Sum of
Squares Df
Mean
Square F Sig.
1 Regression 210,887 3 70,296 42,785 ,000
b
Residual 601,340 366 1,643
Total 812,227 369
a. De
p
endent Variable: MINAT BELI KONSUMEN
(
Y
)
b. Predictors: (Constant), EASY OF USE (X3),
INFORMATION RICHNESS (X2), RETAILER
BRAND
(
X1
)
In light of table 7, it is acquired that the Fcount
esteem is 42,785 with a meaning of 0.000. Since the
importance worth of 0.000 <0.05, then, at that point
H4 is acknowledged, which implies that the free
Analysis of Factors Retailer Brand, Information Richness and Easy of Use on Buying Interest in using ShopeePay
379
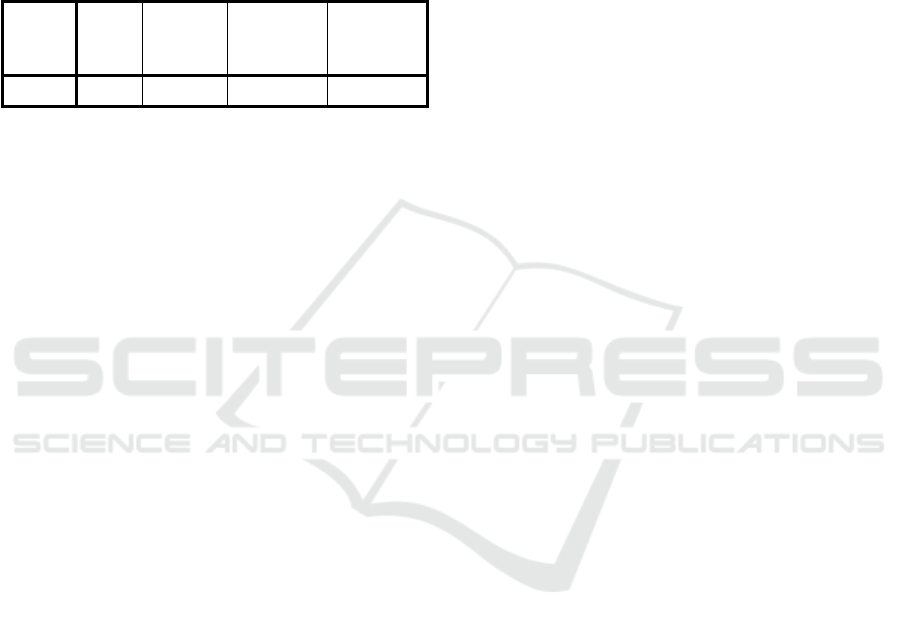
factors Retailer Brand, Information Richness and
Ease of Use have a positive and critical impact on
buying choices.
3.2.3 Coefficient of Determination
The coefficient of determination aims to measure the
model's ability to explain variations in the dependent
variable (Ghozali, 2018).
Table 8: Results of the Coefficient of Determination Test.
Model R
R
Square
Adjusted R
Square
Std. Error
of the
Estimate
1 ,510
a
,260 ,254 1,282
a. Predictors: (Constant), EASY OF USE (X3),
INFORMATION RICHNESS (X2), RETAILER
BRAND (X1)
In table 8, it is known that the R-Square (R2)
value is 0.260. This shows that 26% of the variables
can be explained by the Retailer Brand, Information
Richness and Ease of Use variables, while the
remaining 74% can be explained by other variables
outside of the study.
4 CONCLUSIONS
Based on the results of the research on the factors
carried out, it aims to determine the analysis of the
Retailer Brand, Information Richness and Ease of
Use factors in influencing the buying interest of
Batam City students in using ShopeePay. Then the
conclusions of this study are as follows:
1. Retailer Brand has a positive and significant
influence on the buying interest of students in the city
of Batam in using ShopeePay. This is based on the
results of the analysis obtained that the Retailer Brand
variable has a positive regression coefficient of 0.287
with a significance value of 0.000 (<0.05).
2. Information Richness has a positive and
significant influence on the buying interest of
students in the city of Batam in using ShopeePay.
This is based on the analysis results obtained that the
Information Richness variable has a positive
regression coefficient of 0.171 with a significance
value of 0.007 (<0.05).
3. Ease of Use has a positive and significant
influence on the buying interest of students in the city
of Batam in using ShopeePay. This is based on the
results of the analysis obtained that the Ease-of-Use
variable has a positive regression coefficient of 0.166
with a significance value of 0.000 (<0.05).
4. Retailer Brand, Information Richness and Ease
of Use have a simultaneous effect on consumer
buying interest. This means that the independent
variable increases the buying interest of students in
Batam City in using ShopeePay. This is based on the
analysis obtained that Fcount of 42.785 > Ftable of
0.380 with a significance of 0.000 <0.05, then H4 is
accepted.
ACKNOWLEDGEMENTS
Praise and gratitude to Allah SWT for all his pleasure
so that the authors can finish this thesis with the title
"Analysis Of factors Retailer Brand, Information
Richness and Ease of Use on buying interest in using
“ShopeePay". The author also thanked all the parties
who helped in drafting the writing of this thesis.
Thanks to Ms. Yulinda, SE., M.Si., MBA as a lecturer
for the criticism, advice, motivation, and also time for
the writers so that they can complete this thesis, to all
Lecturer majoring in Applied Business
Administration that has provided a lot of useful
knowledge from the beginning to the end of the
semester to the author, to my family who always pray
and support, and also my lovely friends in class AB
night.
REFERENCES
Agusli, D., & Kunto, Y. (2013). Analisa Pengaruh Dimensi
Ekuitas Merek Terhadap Minat Beli Konsumen
Midtown Hotel Surabaya. Jurnal Manajemen
Pemasaran Petra.
Ansori, M. (2020). Metode Penelitian Kuantitatif Edisi 2.
Airlangga University Press, 2020.
Chesney, T., Chuah, S. H., Dobele, A., & Hoffman, R.
(2017, March). Information richness and trust in v-
commerce: implications for services marketing.
Journal of Services Marketing, 31(3), 1-31.
doi:https://dx.doi.org/10.1108/JSM-02-2015-0099
Daft, R., & Lengel, R. (1986). A Proposed Integration
Among Organizational Information Requirements,
Media Richness, and Structural Desugn. Management
Science.
Duli, N. (2019). Metodologi Penelitian Kuantitatif:
Beberapa Konsep Dasar Untuk Penulisan Skripsi &
Analisis Data Dengan SPSS.
Ferdinand, A. (2006). Pengembangan minat beli merek
ekstensi. Semarang: Badan Penerbit Universitas
Diponegoro.
Firmansyah, M. (2019). Pemasaran Produk dan Merek:
Planning dan Strategy. Penerbit Qiara Media.
ICAESS 2021 - The International Conference on Applied Economics and Social Science
380

Ghozali, I. (2012). Aplikasi Analisis Multivariate dengan
Program IBM SPSS 20. Semarang: Badan Penerbit-
Universitas Diponegoro.
Kasmadi, & Sunariah. (2014). Panduan Modern Penelitian
Kuantitatif. Bandung: Alfabeta.
Lee, M., Hong, J. H., Chung, S., & Joon, K. (2020).
Exploring the Roles of DMO’s Social Media Efforts
and Information Richness on Customer Engagement:
Empirical Analysis on Facebook Event Pages. Journal
of Travel Research, 1-17.
doi:https://doi.org/10.1177/0047287520934874
Marthasari, G. I., & Hayatin, N. (2017). ANALISIS
USABILITY TERHADAP SISTEM LECTIVE
GEGULANG BERBASIS. Seminar Nasional
Teknologi dan Rekayasa (SENTRA) 2017, 8.
Muri, Y. (2017). Metode Penelitian. Jakarta: Kencana.
Nasution, S. L., Limbong, C. H., & Nasution, D. A. (2020).
PENGARUH KUALITAS PRODUK, CITRA
MEREK, KEPERCAYAAN,. ECOBISMA, 7.
Analysis of Factors Retailer Brand, Information Richness and Easy of Use on Buying Interest in using ShopeePay
381
