
Combined Method to Determine Shrimp Pond Cultivation Land
Linda Perdana Wanti
1a
, Dwi Murni Handayani
2b
, Abdul Rohman Supriyono
1c
,
Ratih Hafsarah Maharrani
1d
and Nur Wahyu Rahadi
2
1
Department of Informatics, Politeknik Negeri Cilacap, Jln. Dr. Soetomo No. 1 Cilacap Selatan, Cilacap, Indonesia
2
Department of Agro Industry, Politeknik Negeri Cilacap, Jln. Dr. Soetomo No. 1 Cilacap Selatan, Cilacap, Indonesia
Keywords: Decision Support System, Combined Method, Analytical Hierarchy Process, Topsis Method, Shrimp Pond
Land.
Abstract: Shrimp farming has begun to be cultivated in several parts of Indonesia and it is expected to attract some
investments. One of the factors that influence the success of a shrimp pond business is the location of shrimp
pond which must be based on several criteria. This study aims to provide alternative decisions about
appropriate and safe land used as shrimp ponds by taking into account several criteria such as soil texture,
soil pH, water pH, rainfall, beach bottom type, distance and coastline, labour, affordability, security and
marketing the shrimp pond harvest. The method used is a combination of decision-making methods, the
analytical hierarchy process and the technique for order preference by similarity to an ideal solution, while
the system development method is a user-centred design where the system created is tailored to user needs.
The results of this study are a decision support system that provides recommendations for the area that is
suitable for use as a shrimp pond with the highest weight value.
1 INTRODUCTION
The Ministry of Maritime Affairs and Fisheries
through the 2014-2019 strategic plan states the vision
and mission in increasing domestic fisheries
productivity to make Indonesia as a producer of
marine products and to prosper the community
through the improvement offishery products. Exports
of fishery products in 2014 reached USD 4.64 billion.
The achievement of the export value was dominated
by the export value of shrimp commodities which
reached USD 2.09 billion and was followed by the
tuna tongkol cakalang (TTC) commodity of USD
0.69 billion in 2014 (Peraturan Menteri Kelautan Dan
Perikanan Republik Indonesia, 2017).
The large market demand for fish products,
namely fish, shrimp, and seaweed and the higher
selling prices make this business increasingly attract
some people. This is the reason why the products of
the ponds to be one of the fishery commodities which
gives a big profit. It is also what makes the potential
a
https://orcid.org/0000-0002-6679-2560
b
https://orcid.org/0000-0003-0601-0026
c
https://orcid.org/0000-0002-9756-2792
d
https://orcid.org/0000-0002-4960-8944
of the business opportunities for aquaculture pond
products greater (Andriyanto et al., 2013). To meet
the growing market demand, it is necessary to
accelerate the production of sustainable aquaculture
ponds. The development of aquaculture ponds must
be able to utilize cultivation technology in a
sustainable manner by utilizing the potential of
coastal resources through the feasibility of existing
cultivation lands (Hidayat et al., 2014). Sustainable
aquaculture farming is an environmentally friendly
aquaculture activity that takes into account and
considers biophysical conditions in accordance with
the environmental support in the region (Kusuma, W
A; Prayitna, 2017).
Determination of the appropriate coastal areas
used as shrimp farming land must consider several
factors such as demographic, biological, social and
economic factors (Hasnawi, 2009). Analysis of these
factors is used to get the right area to open the shrimp
farms with maximum profit and minimize the impact
on the surrounding environment (Hakim, L; Supono;
94
Wanti, L., Handayani, D., Supriyono, A., Maharrani, R. and Rahadi, N.
Combined Method to Determine Shrimp Pond Cultivation Land.
DOI: 10.5220/0010940600003260
In Proceedings of the 4th International Conference on Applied Science and Technology on Engineering Science (iCAST-ES 2021), pages 94-101
ISBN: 978-989-758-615-6; ISSN: 2975-8246
Copyright
c
2023 by SCITEPRESS – Science and Technology Publications, Lda. Under CC license (CC BY-NC-ND 4.0)
Waluyo, S; Adiputra, 2018), (Prakesakwa et al.,
2019). In determining the appropriate area by taking
into account these factors, a decision support system
is needed by considering each region and selecting
the region with the highest value (Yesmaya et al.,
2018), (Yuwono et al., 2015).
Decision support systems have been implemented
to provide recommendations for decisions on a
problem (L. et al Wanti, 2020), (Kholidasari et al.,
2019), (Azlan et al., 2020), (Linda Perdana Wanti et
al., 2020). Various methods are used such as
analytical hierarchy process in (Kar, 2015), (Balubaid
& Alamoudi, 2015), (Mubarok & Maldina, 2017),
(Mamat et al., 2019), simple additive weighting in
(Vafaei et al., 2018), technique for order preference
by similarity to ideal solution (TOPSIS) method in
(Rakhshan, 2017), (Sun et al., 2018), hybrid methods
of AHP and TOPSIS in (Reddy et al., 2019),
(Pramanik et al., 2017), (Wedagama, 2010).
Combined method in this research are used to
provide recommendations for areas that have the
potential to be used as aquaculture pond. The steps
in the AHP (Analytical Hierarchy Process) method
are used to determine the alternative chosen based
on the weights value of each criterion used because
in the AHP method there isa paired comparison
matrix used to test consistency and rank the
alternatives used (Balubaid & Alamoudi, 2015),
(Benmoussa et al., 2019). While the TOPSIS method
is used to alternative selection chosen based on
value of a negative ideal solution and value of a
positive ideal solution (Wedagama, 2010). The
criteria used in this study are soil texture symbolized
by C1, rainfall with C2, bottom type of beach with
C3, distance and coastline with C4, labour with C5,
affordability with C6, security with C7 and
marketing of shrimp farm yields with C8. The
alternatives selected were 6 areas in the Cilacap
area. The results of this study are recommendations
for areas that have the potential to be used as shrimp
farms with a weighting value of the intervention
which has the closest distance to the value of Di
+
and the farthest distance to the value of a Di
-
.
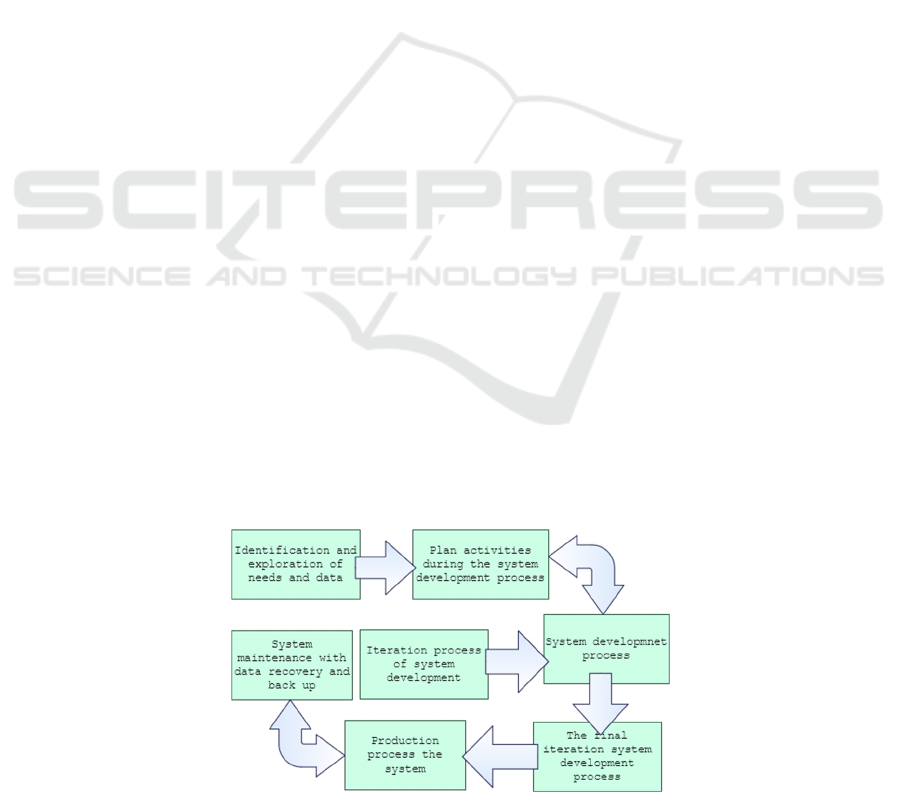
2 RESEARCH METHOD
The system development method used in this study is
user centred design, where all user needs are mapped
into the system design (Schnall et al., 2016), (Luna et
al., 2017), (Linda Perdana Wanti, Azroha, et al.,
2019). Figure 1 explains the research method in
which the system is made oriented to the user in all
stages of the process (Abd Rahman et al., 2020),
(Kautonen & Nieminen, 2018). It starts with defining
the system user context, defining all user
requirements, creating user interface design solutions
and evaluating the system with regard to user
feedback (Georgsson et al., 2019), (Linda Perdana
Wanti, Laksono, et al., 2019). With the evaluation,
the system improvement will be done in accordance
with the feedback from the user until all user needs
are defined and there are no more repairs to be done
(Liu et al., 2016). We strongly encourage authors to
use this document for the preparation of the camera-
ready. Please follow the instructions closely in order
to make the volume look as uniform as possible
(Moore and Lopes, 1999).
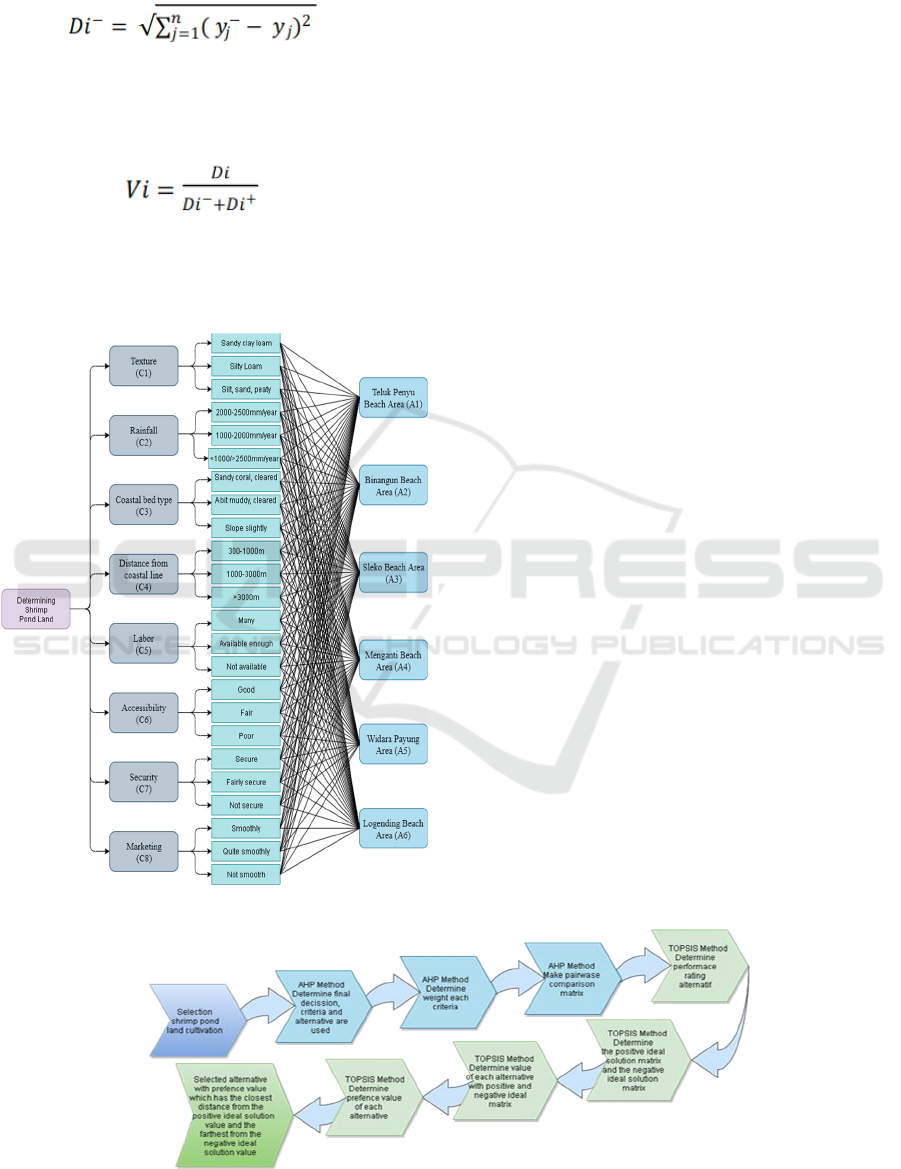
AHP method implementation uses 8 criteria, C1
to C8 namely soil texture,rainfall, beach bottom type,
distance and coastline, labour, affordability, safety
and marketing of shrimp pond harvests with 6
alternatives, A1 to A6, namely the Teluk Penyu
coastal area symbolized by A1, Binangun beach area
with A2, Selok beach area with A3, Menganti beach
area with A4, Widara Payung beach area with A5 and
Logending beach with A6.
The method used is AHP and TOPSIS, with the
aim of combining the decision-making steps available
in AHP and TOPSIS, as well as providing
recommendations for the most potential areas to be
Figure 1: Research Model Stages.
Combined Method to Determine Shrimp Pond Cultivation Land
95
used as shrimp farming land. Analytical hierarchy
process methods provide systematic solutions and
minimize the inconsistency or subjectivity of decision
makers in valuation (Chourabi et al., 2019), (Mamat
et al., 2019). In decision making, it is important to
know how good the consistency is because it is not
necessary to make decisions based on considerations
with low consistency (L P Wanti et al., 2020).
Therefore, it is necessary to check the consistency of
the hierarchy in the decision tree. If the value is more
than 10%, then the judgment assessment must be
corrected. However, if the consistency ratio (CR) is
less or equal to 0.1. Then the calculation results are
declared correct (Yu et al., 2020).
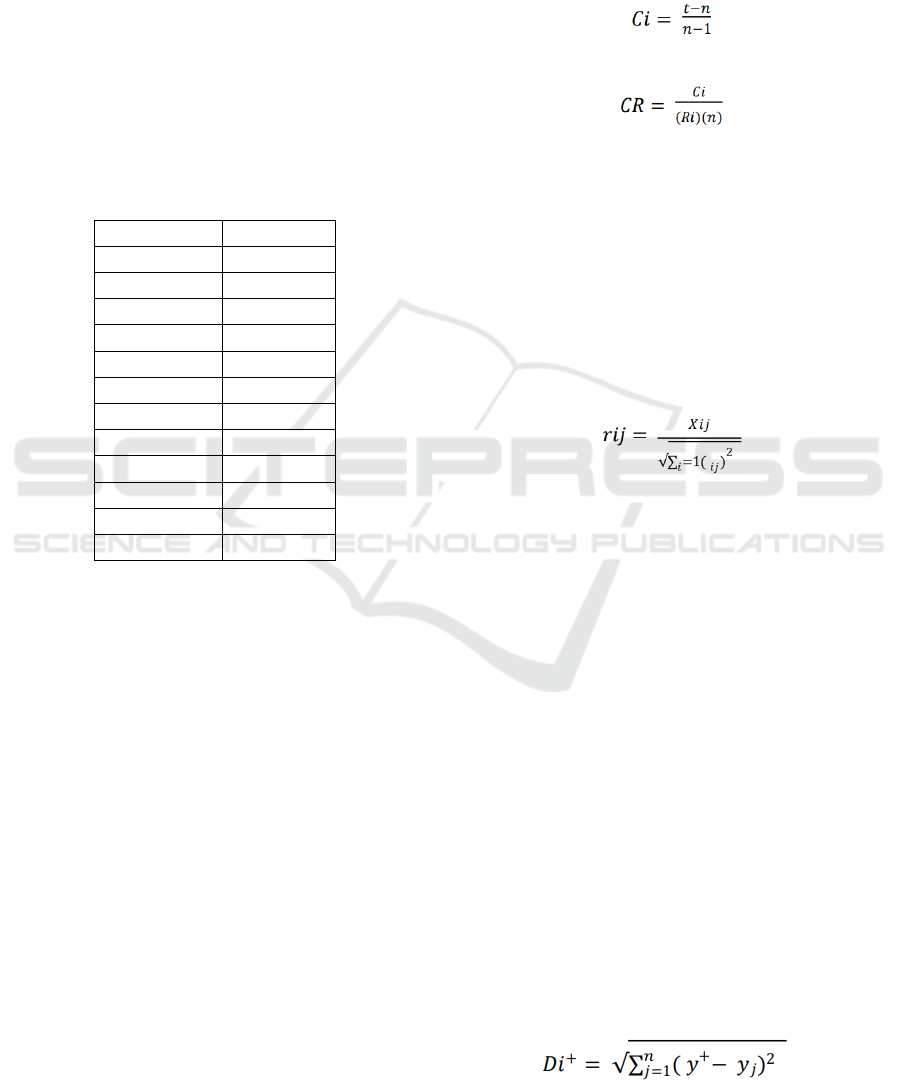
Table 1: Random Index List Consistency.
Matrix Size Ri
1,2 0.00
3 0.58
4 0.90
5 1.12
6 1.24
7 1.32
8 1.41
9 1.45
10 1.49
11 1.51
12 1.48
13 1.56
The stages of the AHP method (Kar, 2015),
namely:
a. Determine the final goal of the decision to be
taken.
b. Develop criteria and alternatives used in the
decision making process.
c. Make a pairwise comparison matrix for each
element involved by selecting the weight of
each criterion oriented to the final goal.
d. Determine the value of the eigenvector vector
and its total using the results of the pairwise
comparison matrix. It starts with normalizing
each column j in matrix A:
∑
𝑖
𝑎(𝑖𝑗) = 1 (1)
e. Calculate the average value of each row i in
matrix A:
𝑊𝑖 = ∑
𝑖
𝑛 (𝑖𝑗) (2)
f. Evaluate each alternative used based on its
weighted value by checking the consistency of
the AHP process hierarchy (Mamat et al., 2019).
Calculate the consistency value of a weight
vector:
(𝐴)(𝑊
𝑇
) = (𝑛)(𝑊
𝑇
) (3)
g. Calculate the consistency index:
(4)
h. Calculate the consistency ratio:
(5)
The value positive ideal solution and value
negative ideal solution only exist in TOPSIS method
is used to select alternatives (Budhi & Wardoyo,
2017). The stages in the TOPSIS method (Sun et al.,
2018), namely:
a. For the first step is normalize the decision
matrix
b. For second step is normalize a weighted
decision matrix where an alternative
performance rating of Ai on each normalized Cj
is calculated using the formula:
(6)
c. For the third step is determine Di+ matrix and
Di-matrix that is determined based on the
normalized weight rating (yij), is calculated
using the formula:
𝑦𝑖𝑗 = (𝑤𝑖)(𝑟𝑖𝑗) (7)
With i=1,2,…,n
And j=1,2,…,m
𝐴
+
= 𝑦1
+
,𝑦2
+
,𝑦3
+
,…,𝑦𝑛
+
(8)
𝐴
−
= 𝑦1
−
,𝑦2
−
,𝑦3
−
,…,𝑦𝑛
−
(9)
Where
𝑦
+
= {max yij with j is profit attribute
{min yij with j is cost attribute
𝑦
−
= {min yij with j is profit attribute
{max yij with j is cost attribute
d. For the fourth step is calculate the distance
between the values of A1 until A6 with Di+
matrix and Di- matrix.
The distance between the alternative Ai and the
positive ideal solution is formulated as:
(10)
iCAST-ES 2021 - International Conference on Applied Science and Technology on Engineering Science
96
The distance for negative ideal solution is
formulated as:
(11)
e. The final step is determine the preference value
for each alternative (Vi), where a larger value
(Vi) indicates that alternative Ai is preferred, Vi
value is calculated using the formula:
(12)
Figure 2 shows the hierarchy of the AHP process
where the final goal of this decision support system is
the recommendation of a region that has the potential
to be a shrimp farm.
Figure 2: Hierarchy of AHP Process.
Figure 3 explains hybrid model to determining the
opening of a shrimp farm. Determination of the final
decision, namely the selection of shrimp farming
areas begins by determining the criteria and
alternatives used. Then give weight to each criterion
(Nasution & Bazin, 2018). Still using the AHP
method, the next step is to determine a pairwise
comparison matrix for each alternative involved. The
next step using the TOPSIS method is determining
alternative performance ratings on each criterion
followed by determining positive and negative ideal
solution matrix. After knowing positive and negative
ideal matrices, then still using the TOPSIS method,
the distance between the values of each alternatives
and the matrix is determined. For final step in
TOPSIS is to determine the preference value for each
area of shrimp farming. The alternative with the
preference value which has the closest distance to Di
+
and the farthest distance to Di
-
is chosen as a feasible
and potential area to be used as a shrimp farm.
3 RESULT AND ANALYSIS
This study uses a combination of TOPSIS and AHP
methods. The result of combination two methods is a
recommended area that is feasible and has the
potential to be used as shrimp farming land. Starting
by weighting the criteria shown in table 2 and table 3.
Table 2 is the result of weighting the criteria using the
analytical hierarchyprocessmethodwhichconsistsof 8
(eight) criteria used to select areas that could
potentially be used as shrimp farms. The priorities for
each criterion are explained, as follows:
a. Soil texture (C1) is less important than beach
bottom type (C3) and distance from coastline
(C4)
b. Rainfall (C2) is more important than soil
texture (C1)
Figure 3: Combined Method for Determination of Shrimp Pond Cultivation Land.
Combined Method to Determine Shrimp Pond Cultivation Land
97

c. The beach bottom type (C3) is as important as
the distance from the coastline (C4)
d. Rainfall (C2) is more important than the beach
bottom type (C3) and the distance from the
coastline (C4)
e. Labor (C5) is less important than affordability
(C6) and marketing (C8)
f. Security (C7) is more important than
workforce (C5)
g. Affordability (C6) is as important as
marketing (C8)
h. Security (C7) is more important than
affordability (C6) and marketing (C8)
i. Security (C7) is equally important as rainfall
(C2)
j. Rainfall (C2) is slightly more important than
labor (C5), affordability (C6), marketing (C8)
k. Security (C7) is slightly more important than
soil texture (C1), beach bottom type (C3),
distance from coastline (C4)
l. The beach bottom type (C3) and distance from
the coastline (C4) are as important as
affordability (C6) and marketing (C8)
m. Labor (C5) is less important than beach
bottom type (C3) and distance from coastline
(C4)
The criteria that have been weighted and
normalized with the final total weighted value per
criterion using the analytical hierarchy process
method then ranked. Ranking of A1 until A6 with the
TOPSIS method using normalized criteria and using
the analytical hierarchy process method. Table 3
shows the weighted normalized matrix using the
TOPSIS method, where the value of each alternative
per criterion is multiplied by the weight or value of
the eigen vector values calculated using the AHP
method.
Table 2: Pairwise Comparison Matrix of Criteria.
Criteria c1 c2 c3 c4 c5 c6 c7 c8
c1 1 0.2 3 3 1 3 0.2 3
c2 5 1 0.14 0.14 0.33 0.33 1 0.33
c3 0.33 7 1 1 0.33 1 0.33 1
c4 0.33 7 1 1 0.33 1 0.33 1
c5 1 3 3 3 1 0.330.2 0.33
c6 0.33 3 1 1 3 1 7 1
c7 5 1 3 3 5 0.1 1 0.14
c8 0.33 3 1 1 3 1 7 1
Table 3: Normalized Matrix with Final Weight Value.
Criteria c1 c2 c3 c4 c5 c6 c7 c8 Eigen Vector Value
c1 0.075 0.008 0.228 0.228 0.071 0.387 0.012 0.385 0.174
c2 0.375 0.040 0.011 0.011 0.024 0.043 0.059 0.042 0.075
c3 0.025 0.278 0.076 0.076 0.024 0.129 0.019 0.128 0.094
c4 0.025 0.278 0.076 0.076 0.024 0.129 0.019 0.128 0.094
c5 0.075 0.119 0.228 0.228 0.071 0.043 0.012 0.042 0.102
c6 0.025 0.119 0.076 0.076 0.214 0.129 0.410 0.128 0.147
c7 0.375 0.040 0.228 0.228 0.357 0.013 0.059 0.018 0.165
c8 0.025 0.119 0.076 0.076 0.214 0.129 0.410 0.128 0.147
iCAST-ES 2021 - International Conference on Applied Science and Technology on Engineering Science
98

Table 4: Normalized Weight Rating.
Alternative
Criteria
c1 c2 c3 c4 c5 c6 c7 c8
a1 0.029 0.015 0.019 0.007 0.016 0.027 0.018 0.021
a2 0.044 0.008 0.019 0.015 0.024 0.027 0.037 0.032
a3 0.029 0.008 0.019 0.022 0.024 0.013 0.037 0.021
a4 0.029 0.008 0.019 0.015 0.016 0.040 0.018 0.021
a5 0.029 0.015 0.009 0.015 0.016 0.013 0.037 0.032
a6 0.015 0.023 0.009 0.022 0.008 0.027 0.018 0.021
The next step is to determine Di
+
matrix and Di
-
matrix using equations (8) and (9). After determining
it, for next step is determine the distance of 6 (six)
alternative areas of shrimp farms with a positive and
negative ideal solution matrix. Determination the
distance of six alternative is carried out with the
normalized matrix using equations (10) and (11).
Preference values indicate alternatives that have the
closest distance to Di
+
and the furthest distance to Di
-
. From the appraisal value, it obtained an alternative
ranking of a suitable area and has the potential to
become shrimp farming land. From the ranking of
preference values obtained A2, namely Binangun
beach area with a value of 0.0473, the highest among
the other alternatives. This means that the Binangun
coastal area, based on calculations using the AHP
method and the TOPSIS method, is a feasible area
and has the potential to be used as a shrimp farm. The
value of the positive ideal solution and the value of
the negative ideal solution along with the distance of
each alternative and the preference value are shown
in Figure 4 in the form of the following diagram. The
value Di
+
shows the distance of alternative values
with positive ideal solution values, Di
-
shows the
Figure 4: Final Results of Shrimp Pond Farming Land
Ranking.
distance of alternative value with negative ideal
solution values, then V shows the preference values
of each alternative from A1 to A6.
4 CONCLUSIONS
Areas that are feasible and potentially used as shrimp
ponds have been successfully determined using a
decision support system with a combination of two
methods namely the analytical hierarchy process
method and the TOPSIS method. The final results
show that an alternative with A2 code, namely the
Binangun beach area, was selected with the highest
preference value of 0.0473.
REFERENCES
Abd Rahman, M. S., Mohamad, E., & Abdul Rahman, A.
A. (2020). Enhancement of overall equipment
effectiveness (OEE) data by using simulation as
decision making tools for line balancing. Indonesian
Journal of Electrical Engineering and Computer
Science, 18(2), 1040–1047. https://doi.org/10.11591/
ijeecs.v18.i2.pp1040-1047
Andriyanto, F., Efani, A., & Riniwati, H. (2013). Analisis
Faktor-faktor Produksi Usaha Pembesaran Udang
Vanname (Litopenaeus vannamei) di Kecamatan
Pacitan Kabupaten Lamongan Jawa Timur. ECSOFIM
(Economic and Social of Fisheries and Marine), 1(1),
82–96.
Azlan, A., Yusof, Y., & Mohamad Mohsin, M. F. (2020).
Univariate Financial Time Series Prediction using
Clonal Selection Algorithm. International Journal on
Advanced Science, Engineering and Information
Technology, 10(1), 151–156. https://doi.org/10.18517/
IJASEIT.10.1.10235
Balubaid, M., & Alamoudi, R. (2015). Application of the
Analytical Hierarchy Process (AHP) to Multi-Criteria
Analysis for Contractor Selection. American Journal of
Combined Method to Determine Shrimp Pond Cultivation Land
99

Industrial and Business Management, 05(09), 581–589.
https://doi.org/10.4236/ajibm.2015.59058
Benmoussa, K., Laaziri, M., Khoulji, S., Kerkeb, M. L., &
El Yamami, A. (2019). AHP-based Approach for
Evaluating Ergonomic Criteria. Procedia
Manufacturing, 32, 856–863. https://doi.org/10.1016/
j.promfg.2019.02.294
Budhi, M. A., & Wardoyo, R. (2017). Group Decision
Support System Determination Of Best Employee
Using Topsis And Borda. IJCCS (Indonesian Journal
of Computing and Cybernetics Systems), 11(2), 165.
https://doi.org/10.22146/ijccs.22773
Chourabi, Z., Khedher, F., Babay, A., & Cheikhrouhou, M.
(2019). Multi-criteria decision making in workforce
choice using AHP, WSM and WPM. Journal of the
Textile Institute, 110(7), 1092–1101.
https://doi.org/10.1080/00405000.2018.1541434
Georgsson, M., Staggers, N., Årsand, E., & Kushniruk, A.
(2019). Employing a user-centered cognitive
walkthrough to evaluate a mHealth diabetes self-
management application: A case study and beginning
method validation. Journal of Biomedical Informatics,
91, 103110. https://doi.org/10.1016/j.jbi.2019.103110
Hakim, L; Supono; Waluyo, S; Adiputra, Y. T. (2018).
Performa Budidaya Udang Vaname (Litopenaeus
Vannamei) Semi Intensif di Desa Purworejo
Kecamatan Pasir Sakti Kabupaten Lampung Timur.
Jurnal Rekayasa Dan Teknologi Budidaya Perairan,
6(2), 691–698.
Hasnawi, U. M. A. R. (2009). Penentuan Lokasi
Pengembangan Budidaya Tambak Udang
Berkelanjutan Dengan Aplikasi Sistem Informasi
Geografis di Kabupaten Lampung Selatan. Journal
Riset
Akuakultur, 4(3), 407–423.
Hidayat, A., Sudarsono, B., & Sasmito, B. (2014). Analisis
Kesesuaian Lahan Tambak Menggunakan Sistem
Informasi Geografis. Jurnal Geodesi Undip, 3(April),
28–43.
Peraturan Menteri Kelautan Dan Perikanan Republik
Indonesia, (2017). https://doi.org/10.1017/CBO97811
07415324.004
Kar, A. K. (2015). A hybrid group decision support system
for supplier selection using analytic hierarchy process,
fuzzy set theory and neural network. Journal of
Computational Science, 6, 23–33.
https://doi.org/10.1016/j.jocs.2014.11.002
Kautonen, H., & Nieminen, M. (2018). Conceptualising
benefits of user-centred design for digital library
services. LIBER Quarterly, 28(1), 1–34.
https://doi.org/10.18352/lq.10231
Kholidasari, I., Setiawati, L., & Tartila. (2019). The
implementation of forecasting method by incorporating
human judgment. International Journal on Advanced
Science, Engineering and Information Technology,
9(6), 1982–1988. https://doi.org/10.18517/ijaseit.9.6.
10640
Kusuma, W A; Prayitna, S. B. A. R. W. (2017). Kajian
Kesesuaian Lahan Tambak Udang Vaname
(litopenaeus vannamei) di Kecamatan Cijulang dan
Parigi, Pangandaran, Jawa Barat dengan Penerapan
Aplikasi Sistem Informasi Geografis. Journal of
AquacultureManagementandTechnology, 4(4),95–
100.
Liu, Y. C., Chen, C. H., Lee, C. W., Lin, Y. S., Chen, H. Y.,
Yeh, J. Y., & Chiu, S. Y. H. (2016). Design and
usability evaluation of user-centered and visual-based
aids for dietary food measurement on mobile devices in
a randomized controlled trial. Journal of Biomedical
Informatics, 64, 122–130.
https://doi.org/10.1016/j.jbi.2016.10.001
Luna, D. R., Rizzato Lede, D. A., Otero, C. M., Risk, M.
R., & Fernán, G. B. de Q. (2017). User-centered design
improves the usability of drug-drug interaction alerts:
Experimental comparison of interfaces. Journal of
Biomedical Informatics, 66, 204–213.
https://doi.org/10.1016/j.jbi.2017.01.009
Moore, R., & Lopes, J. (1999). Paper templates. In
TEMPLATE’06, 1st International Conference on
Template Production (pp. 319-340).
Mamat, A. R., Mohamed, M. A., Azhar, A. F., Saany, S. I.
A., Rawi, N. A., Amin, M. M., Kadir, M. F. A., & Nor,
M. A. M. (2019). Modelling decision support system
for selection maahad tafiz center using analytical
hierarchal analysis. Indonesian Journal of Electrical
Engineering and Computer Science, 13(1), 35–40.
https://doi.org/10.11591/ijeecs.v13.i1.pp35-40
Mubarok, N., & Maldina, E. Y. (2017). Strategi Pemasaran
Islami Dalam Meningkatkan Penjualan Pada Butik
Calista. I-Economic, 3(1), 80–81.
Nasution, F. B., & Bazin, N. E. N. (2018). E-government
maturity model to support systemdynamicsinpublic
policymaking. International Conference on Electrical
Engineering, Computer Science and Informatics
(EECSI), 2018-Octob, 464–471. https://doi.org/10.11
09/EECSI.2018.8752921
Prakesakwa, A., Suryani, A., & Gustriansyah, R. (2019).
Sistem Pendukung Keputusan untuk Subsidi Biaya
Perbaikan Kerusakan Kontainer Menggunakan Naive
Bayes. Jurnal Teknologi Dan Sistem Komputer, 7(3),
98. https://doi.org/10.14710/jtsiskom.7.3.2019.98-102
Pramanik, D., Haldar, A., Mondal, S. C., Naskar, S. K., &
Ray, A. (2017). Resilient supplier selection using AHP-
TOPSIS-QFD under a fuzzy environment.
International Journal of Management Science and
Engineering Management, 12(1), 45–54.
https://doi.org/10.1080/17509653.2015.1101719
Rakhshan, S. A. (2017). Efficiency ranking of decision
making units in data envelopment analysis by using
TOPSIS-DEA method. Journal of the Operational
Research Society, 68(8), 906–918. https://doi.org/10.10
57/s41274-017-0237-0
Reddy, A. S., Kumar, P. R., & Raj, P. A. (2019). Entropy-
based fuzzy TOPSIS framework for selection of a
sustainable building material. International Journal of
Construction Management, 0(0), 1–12.
https://doi.org/10.1080/15623599.2019.1683695
Schnall, R., Rojas, M., Bakken, S., Brown, W., Carballo-
Dieguez, A., Carry, M., Gelaude, D., Mosley, J. P., &
Travers, J. (2016). A user-centered model for designing
consumer mobile health (mHealth) applications (apps).
iCAST-ES 2021 - International Conference on Applied Science and Technology on Engineering Science
100

Journal of Biomedical Informatics, 60, 243–251.
https://doi.org/10.1016/j.jbi.2016.02.002
Sun, W., Li, D., & Liu, P. (2018). A decision-making
method for Sponge City design based on grey
correlation degree and TOPSIS method. Journal of
Interdisciplinary Mathematics, 21(4), 1031–1042.
https://doi.org/10.1080/09720502.2018.1456826
Vafaei, N., Ribeiro, R. A., & Camarinha-Matos, L. M.
(2018). Selection of normalization technique for
weighted average multi-criteria decision making. IFIP
Advances in Information and Communication
Technology, 521, 43–52. https://doi.org/10.1007/978-
3-319-78574-5_4
Wanti, L. et al. (2020). A support system for accepting
student assistance using analytical hierarchy process
and simple additive weighting A support system for
accepting student assistance using analytical hierarchy
process and simple additive weighting. Journal of
Physics. https://doi.org/10.1088/1742-6596/1430/1/ 01
2034
Wanti, L P, Somantri, O., Abda’U, P. D., Faiz, M. N.,
Maharrani, R. H., Prasetya, N. W. A., Susanto, A.,
Purwaningrum, S., & Romadoni, A. (2020). A support
systemfor acceptingstudent assistanceusing analytical
hierarchy process and simple additive weighting.
Journal of Physics: Conference Series.
https://doi.org/10.1088/1742-6596/1430/1/012034
Wanti, Linda Perdana, Azroha, I. N., & Faiz, M. N. (2019).
Implementasi User Centered Design Pada Sistem Pakar
Diagnosis Gangguan Perkembangan Motorik Kasar
Pada Anak Usia Dini. Media Aplikom, 11(1), 1–10.
Wanti, Linda Perdana, Laksono, K. Y., & Purwanto, R.
(2019). Implementasi Metode User Centered Design
Pada Sistem Pendukung Keputusan Peramalan
Penjualan Ikan Hias. Jurnal ICT : Information
Communication
& Technology, 18(1), 26–33.
https://doi.org/10.36054/jict-ikmi.v18i1.39
Wanti, Linda Perdana, Maharrani, R. H., Wachid, N., &
Prasetya, A. (2020). Optimation economic order
quantity method for a support system reorder point
stock. International Journal of Electrical and
Computer Engineering, 10(5), 4992–5000.
https://doi.org/10.11591/ijece.v10i5.pp4992-5000
Wedagama, D. (2010). Determining Regencial Road
Handling Priority Using Fuzzy Analytic Hierarchy
Process (FAHP) and TOPSIS Method (Case Study:
Badung Regency - Bali). Jurnal Teknik Sipil ITB, 17(2),
143–152.
Yesmaya, V., Ronald, A., & Hidajat, M. (2018). Property
exhibition decision support system based on web
application. Telkomnika (Telecommunication
Computing Electronics and Control), 16(2), 766– 770.
https://doi.org/10.12928/TELKOMNIKA.v16i2.760 1
Yu, E., Wang, Y., Fu, Y., Chen, D., & Xie, M. (2020). AHP
integrated TOPSIS and VIKOR methods with
Pythagorean fuzzy sets to prioritize risks in self-driving
vehicles. Optics Communications, 126175.
https://doi.org/10.1016/j.asoc.2020.106948
Yuwono, T., Setiawan, N. A., Nugroho, H. A., Persada, A.
G., Prasojo, I., Dewi, S. K., & Rahmadi, R. (2015).
Decision support systemfor heart diseasediagnosing
using K-NN algorithm. International Conference on
Electrical Engineering, Computer Science and
Informatics (EECSI), 2(August), 160–164.
https://doi.org/10.11591/eecsi.2.544
Combined Method to Determine Shrimp Pond Cultivation Land
101
