
Smart Controller Design of Solar Home System (SHS) for Load
Management with Grid Connected
Mychael Gatriser Pae
1
, Daniel M. D. U. Kasse
1
, and Ronald Enstein Renoat
2
1
Electrical Engineering, State Kupang Polytechnic, Adisucipto Street, Kupang, Indonesia
2
Company Management, State Kupang Polytechnic, Adisucipto Street, Kupang, Indonesia
Keywords: Solar Power, PLTS, PLN, Grid, Management, Renewable.
Abstract: As one of the largest archipelagic countries in the world, Indonesia still faces electricity problems due to
geographical reasons. One of the provinces which have a fairly low electrification ratio is the Province of East
Nusa Tenggara (NTT). In terms of the potential of natural resources, especially renewable energy sources,
NTT has great potential for the development of solar power plants. The ranges intensity of solar energy in
NTT are 4.5 - 5 kWh/M
2
. To take advantage of these renewable energy sources, this research offered the best
solution to reduce community problems by providing electrical energy for residential homes, namely
designing a smart controller by utilizing electricity from a solar power plant connected to the State Power
Station electricity network. A specification of this system is the management of the use of electrical energy
sources for loads. The test results show that the total consumption of electrical energy are 4678 watts/hour,
while the total production of electrical energy from the solar power plant are 3622 watts/hour. With this load
management system, the contribution of the solar power plant can save electricity consumption by 1056
watts/hour. With this system was known that the efficiency of the solar power plant are 77.4%.
1 INTRODUCTION
As one of the largest archipelagic countries in the
world, Indonesia still faces electricity problems due
to geographical reasons. One of the provinces that
have a low electrification ratio is the Province of East
Nusa Tenggara (NTT). Based on the Central Statistics
Agency (BPS) in 2018, the electrification ratio of
NTT under below the national electrification ratio,
which are 68.82%. One of the problems faced by the
government is the limited funding for electricity
infrastructure development and the low interest in
buying Public to meet basic needs and the
geographical conditions of the hilly islands of NTT,
making it difficult to provide access to new electricity
networks.
Until now, there are still 11,944,675 out of
65,254,000 households in Indonesia that have not
received a supply of Electrical Energy Channels
(SEL) with an electrification ratio of 81.70%. Some
provinces even have electrification ratios below 60%
such as Jambi, West Sulawesi, West Papua, and East
Nusa Tenggara (NTT) due to the accessibility of
electricity infrastructure. PLN noted that there were
532,204 out of 1,104,500 households in Province
NTT that had not received SEL supply with an
electrification ratio of 51.81% (PLN, 2015).
Meanwhile, from BPS data in 2015, there were
30,910 out of 78,011 households spread across 32 of
177 villages in Kupang Regency, NTT Province that
had not yet received a supply of SEL (electrification
ratio of 60%) (Sinaga, Tambunan, and Prastowo
1981).
The Government's efforts to increase the
electrification ratio continue to be carried out with
government programs. In Indonesia, the National
Priority for Energy Sustainability includes two
Priority Programs, namely: New and Renewable
Energy (EBT) and Energy Conservation, as well as
Meeting Energy Needs (Winanti et al. 2018). A
follow-up to the government's efforts to utilize
renewable energy such as solar radiation for the
construction of solar power plants. It is proven that
until now there have been additions and expansions
of electricity networks to remote areas. However, the
current problems are the low purchasing power of
electricity from customers due to economic
constraints and the increasing price of electrical
energy. Other problems that are still felt by the
community such as power outages that still often
298
Pae, M., Kasse, D. and Renoat, R.
Smart Controller Design of Solar Home System (SHS) for Load Management with Grid Connected.
DOI: 10.5220/0010944400003260
In Proceedings of the 4th International Conference on Applied Science and Technology on Engineering Science (iCAST-ES 2021), pages 298-303
ISBN: 978-989-758-615-6; ISSN: 2975-8246
Copyright
c
2023 by SCITEPRESS – Science and Technology Publications, Lda. Under CC license (CC BY-NC-ND 4.0)

occur at peak load conditions and other external
disturbances.
In 2018, NTT's electrification ratio increased to
68.82% but was still below the national average
electrification ratio. The increase in the electrification
ratio in 2018 shows the performance of PLN which
continues to improve in a better direction, as
evidenced by the expansion of new networks. When
viewed from the natural potential, NTT is one of the
provinces that have a source of electrical energy from
renewable energy which is quite high, including
electrical energy from the sun and electrical energy
from wind power. The average intensity of solar
radiation in NTT are 5 kWh/m2 with an average wind
speed of 5.5-6.5 m/s (NASA 2017). If that the
potential was utilized optimally, it will have an
impact on increasing the electrification ratio and
meeting the electricity needs of the NTT community.
To take advantage of the natural potential that exists,
this research will offer the best solution to overcome
public problems associated with the provision of
electrical energy for residential homes, namely by
designing a smart controller by utilizing electricity
from a Solar Power Plant that are connected to the
PLN Grid. The existence of this system can meet the
basic lighting needs of households as well as for other
electrical needs. The results of this research will be
recommended were systems are more efficient and
effective to meet the needs of electrical loads with
low cost and high reliability.
2 PURPOSED TECHNOLOGY
DESCRIPTION
A smart home system is a system that provides
service, convenience, and comfort for consumers or
residents. The smart home system provides optimal
service and provides control over the use of electrical
energy so that it has an impact on saving electrical
energy costs. Previous research related to the
management of electrical energy consumption,
namely the management of voltage on the battery.
Arduino acts as switching between local energy
(PLTS) and main energy. When Arduino reads the
voltage on the battery less than 11 volts, the system
will prioritize the use of energy from the main energy.
On the other hand, when the battery charging process
reaches 13 volts, Arduino will prioritize the use of
electrical energy from local energy (PLTS) (Mehdi
et al. 2018).
Figure 1: Smart Energy Management (Mehdi et al. 2018).
The research previously discussed above uses an
on-grid system, namely local energy sourced from
Solar Power Plants (PLTS) which are connected to
the main grid (PLN). That system was equipped with
a GSM SIM900 card to connect to an IoT-based
smartphone for coordinated control and system
interconnection via a mobile application. The results
of this study indicate significant cost savings and
more efficient management of electrical energy
consumption compared to conventional systems (not
using a management system for electricity
consumption). The main disadvantage of an off-grid
solar power plant is the durability of the battery life
must be continuously replaced so that the customer or
user has to replace the battery for about 5 to 6 years
and it will cost 20% - 25% of the total normal project
calculation (Jose and Itagi 2015). The solution to
overcome their problems are to design the control
system for the efficient performance of solar power
plants, both off-grid systems, and on-grid systems.
One such system design, such as the research
conducted by Sam Jose and Dr. Raieshwari L Itagi in
2015 about “Smart solar power plant” as follows:
a) b)
Figure 2: a) Off Grid System. b) Mini Smart Grid for Died
Grid system (Jose and Itagi 2015).
The results show that a smart controller system
was increased battery life, and the efficiency level of
the off-grid and on-grid systems more than higher and
the cost of the customer or user can be reduced. The
Charger controller can also manage costs well. In
addition, it can also provide overcharge protection for
the battery to prevent over discharger in the battery.
Smart Controller Design of Solar Home System (SHS) for Load Management with Grid Connected
299

Based on the literature study described above, the
framework for designing a Solar Home System (SHS)
with the Application of a Smart Grid Controller are
shown in Figure 3.
Figure 3: Blog Diagram Smart Solar Home System.
Overall, the Solar Home System (SHS) Design
System with the Implementation of the Smart Grid
Controller consists of three main parts. The first part
is the source of power generation, namely PLTS
which are connected to the PLN network. The second
part is load power management. In this section,
current and voltage measurements will be carried out
using current and voltage sensors. The results of the
measurements will be processed by Arduino to
determine which power plant source will supply the
electrical load. Switching between PLTS and PLN
Grid was automatically controlled using an automatic
transfer switch (ATS). The PLN grid will back up the
PLTS system to supplying the load when the load
capacity has exceeded the PLTS capacity. When the
capacity of PLTS produces electrical energy more
than the load capacity, the main energy source used
comes from PLTS. The third part are the electrical
loads. Electrical loads in the form of electronic
equipment and other electrical equipment.
Meanwhile, the PLN grid power was adjusted to the
900 Watt kWh meter electric power.
3 DESCRIPTION OF THE
TECHNOLOGY
The first step in this research are the design of Solar
Power Plant (PLTS). The PLTS system design
consists of several components, namely solar panels,
solar charge controllers, batteries and inverters. The
next step are the design of the ATS system. The ATS
system was designed using 3 contactors that will
work based on current and voltage sensors. The next
stage is the design of the load management system.
Load management system using Arduino. The current
sensor will provide an input signal for the Arduino
and the Arduino will turn on which contactor will
work.
The way system works in the management of
electrical energy consumption was shown in Figure 4.
The sensor will measure the current and voltage at the
load by prioritizing the main source of the PLTS. The
maximum power was set from Arduino for PLTS are
400 Watts. When the load was less than 400 watt,
PLTS will take over the load. If the load more than
400 Watts. For example, 500 watts, the PLTS will
still supply 400 watts of power and the remaining 100
watt will be taken from the PLN grid.
Figure 4: The Working Principle of Energy Management
Solar Home System.
3.1 Load Profile
Based on the measurement results of the load data
was known that the total power requirement for one
day are 11,709 Watt with a total consumption of
electrical energy of 11.27 kWh/day. The
measurement results were known that the peak and
load are 890 Watt which occurs from 18.00 to 19.00.
This is because all electronic and lighting equipment
starts operating. While the lowest power requirement
of the load are 114 Watt from 07.00 until 09.00. In
this state, some lighting loads have been turned off
and some electronic equipment has not been
operating.
Figure 5: Daily Load Profile.
3.2 Determination of Solar Power Plant
To calculate the capacity of solar panels, it is
necessary to know the total electrical load that will be
supplied by the PLTS. In addition to the load
capacity, it is necessary to calculate the peak solar
131
114
114
114
392
600
660
600
504
516
594
640
890
890
790
829
491
623
502
470
380
310
310
245
1357911131517192123
Load (Watt)
Hour
iCAST-ES 2021 - International Conference on Applied Science and Technology on Engineering Science
300

radiation that occurs in one day. Another parameter to
determine the capacity of solar panels are the
efficiency of the system. Efficiency can be calculated
based on solar panel losses, battery losses, inverter
losses, and cable losses. To maintain stability in
producing electrical energy, the total system losses
are 30% so that the system efficiency are 70%
(Sreewirote and Leelajindakrairerk 2016). To
calculate the power of solar panels can use the
equation:
P
pv =
E
load
/
(PSH X
n
system )
(1)
When:
Ppv = PV panel nominal peak power (W)
E
load
= Total energy demand for a day (Wh)
PSH
= Peak sun hour (hr)
n
system
= overall system efficiency
With a total load power of 400 watts and an
assumed operating time of 2.5 hours, the total energy
required by the load are 1 kWh. While the peak solar
radiation (PSH) for the NTT area is an average of 5
hours starting from 09.00-14.00 (NASA 2017). From
the calculation results, it is known that the solar panel
power should not be less than 286 Wp so that in this
design a solar panel with a capacity of 310 Wp is
used.
To determine the battery capacity, it can be
calculated using equation 2 (Sreewirote and
Leelajindakrairerk 2016) (Duan et al. 2018).
BC = (P
load
x h ) / (V
batt
x n
system
x DOD) (2)
When:
BC = Battery capacity (Ah)
P
load =
Demand power (W)
V
batt
= Battery voltage (v)
h = Discharge times (h)
n
system =
Battery efficiency
DOD = Dead of Discharge
From the results of calculations with a battery
voltage capacity of 12 volts and battery efficiency of
80%, it is known that the battery capacity that must
be used should not be less than 100 Ah. Thus, in this
study, the battery used was 100 Ah.
The type of inverter used is a Grid Tie inverter
which was connected to the PLN electricity network.
Inverter capacity is adjusted to the capacity of PLTS,
so this study using an inverter with a capacity of 600
Watt. While the Solar Charge Controller used in this
design is MPPT type with a capacity of 12/24 V 30
Ampere.
3.3 PV and Main Grid Switching
System
The switching system between the PLTS and the PLN
Grid to supply electrical energy to the load will be
taken over by the Automatic Transfer Switch (ATS)
system. The ATS circuit was equipped with sensors
and relays that will be ordered by Arduino based on
current and voltage sensors on the load. In this design,
2 relays are used namely relay one for PLTS and relay
two for the PLN grid. Both relays will work based on
current and load voltage sensors. The value of
current, voltage, and electric power generated from
the load will be displayed on the LCD. Power is set in
this design process are when the load is greater than
400 watts, PLN will help supply excess electrical
energy to the load. When the load is less than 400
watts, PLTS will take over the load.
ATS circuits are equipped with 3 contactors and a
timer. In this design, the system only uses two
contactors, namely a contactor for PLTS and a
contactor for PLN. While the third contactor is
planned for the use of a generator set. The timer
functions as a delay time setting when switching
between PLTS and PLN sources.
Figure 6: PLTS and PLN Grid Switching.
For electrical power to the load, the two relays are
connected with 2 different conditions. PLTS is
prioritized as the main source of electrical energy so
that the PLTS relay was installed in the Normally
Closed (NC) position while the PLN relay was in the
Normally Open (NO) state. The PLTS relay will be
directly connected to the load through the PLTS
contactor, while the PLN relay will work when there
input signal from Arduino when the load is more than
400 watts. Relay installation in this system are shown
in Figure 7.
Smart Controller Design of Solar Home System (SHS) for Load Management with Grid Connected
301
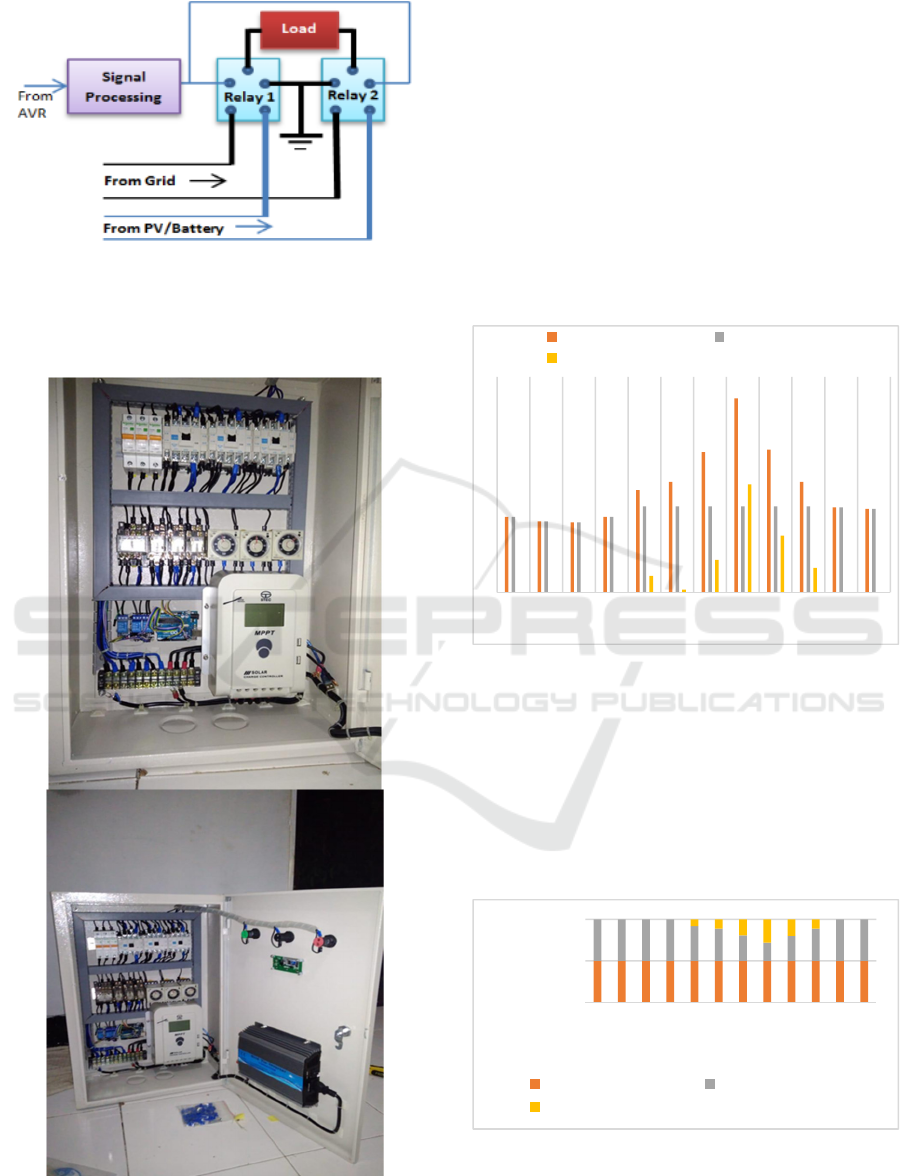
Figure 7: Relay installation.
Overall, the electrical installation of a smart solar
Home system for electrical load management with a
grid-connected system are shown in Figure 8.
Figure 8: System Electricity Smart Controller SHS for Load
Management.
4 PERFORMANCE OF THE
SYSTEM
The test results show a significant contribution to
saving electricity consumption. However, in this test,
the inverter did not work optimally. The 600-watt
inverter capacity was only capable of producing a
maximum output power of 319 watts. Thus, the
inverter efficiency can be calculated by 53%.
Because the maximum output power of the inverter is
below 400 watts, the Arduino algorithm for the load
power priority switching system was reduced to 300
watts. The test results are shown in Figure 9.
Figure 9: System Test Results.
The test results show that the total consumption of
electrical energy are 4678 watts/hour, while the total
production of electrical energy from the solar power
plant are 3622 watts/hour. Thus, with this load
management system, the contribution of the solar
power plant can save electricity consumption by 1056
watts/hour. Thus, are known that the efficiency of the
solar power plant was 77.4%.
Figure 10: System Efficiency.
The total efficiency of the system is highest when
the total electrical energy of the load can be taken
over by the solar power plant. While the lowest
280
263
260
280
380
410
520
720
530
410
315
310
280
263
260
280
319
319
319
319
319
319
315
310
0
0
0
0
61
10
120
401
211
91
0
0
123456789101112
POWER (WATT)
HOUR
Load (watt) Power PV (Watt)
Power Grid (Watt)
0%
50%
100%
123456789101112
EFFICIENCY
HOUR
Load (watt) Power PV (Watt)
Power Grid (Watt)
iCAST-ES 2021 - International Conference on Applied Science and Technology on Engineering Science
302

efficiency occurs at peak load, namely the
consumption of electric power of 720 watts. At this
peak load, the total purchase of electrical energy from
the PLN Grid are 401 watts while the contribution
from the solar power plant are 319 watts.
5 CONCLUSION
The Smart Controller Design of Solar Home System
(SHS) for Load Management With Grid Connected
has a performance efficiency of 77%. By saving
electricity consumption of 1.5 kWh of the total
electrical energy consumption of 4,678 kWh. The
highest electricity consumption from the PLN Grid
are 720 watts while the total electricity production
from the solar power plant are 319 watts. One of the
obstacles that occur in this design is the performance
of the inverter not optimal. In addition, the lack of
sensitivity of current and voltage readings from the
sensor so that the need for a proper calibration
system. The above constraints can be an open
problem for further system development.
REFERENCES
Duan, Xiaoyu, Sirui Wu, Rui Diao, and Aobo Yang. 2018.
“Design of Hybrid Solar-Hydro Microgrid for Village
School in China.” 2018 IEEE Global Humanitarian
Technology Conference (GHTC), 1–7.
Jose, Sam, and Rajeshwari L. Itagi. 2015. “Smart Solar
Power Plant.” 2015 International Conference on
Communication and Signal Processing, ICCSP 2015,
850–54. https://doi.org/10.1109/ICCSP.2015.7322615.
Mehdi, Laraki, Yassine Ouallou, Oussa Mohamed, Aawatif
Hayar, Smart City, Team Ritm, Ensem Greentic,
Université Hassan, and I I Casablanca. 2018. “New
Smart Home ’ s Energy Management System Design
and Implementation for Frugal Smart Cities.” 2018
International Conference on Selected Topics in Mobile
and Wireless Networking (MoWNeT), 149–53.
https://doi.org/10.1109/MoWNet.2018.8428865.
NASA. 2017. “NASA Surface Meteorology and Solar
Energy.” 2017. https://eosweb.larc.nasa.gov/cgi-
bin/sse/grid.cgi?&num=291082&lat=-
8.5&submit=Submit&hgt=100&veg=17&sitelev=&e
mail=&p=grid_id&p=swvdwncook&p=swv_dwn&p=
sol_noon&p=ret_tlt0&p=mnavail1&p=surplus1&p=da
y_cld&p=T10M&p=wspd50m&p=pct10m_wnd&p=R
H10M&step=2&lon=110.
Sinaga, Rusman, Armansyah Halomoan Tambunan, and
Prastowo. 1981. “Analisis Alternatif Solusi Penyediaan
Sumber Energi Listrik Studi Kasus: Kabupaten
Kupang.” Journal of Chemical Information and
Modeling Bintang Charles Hamonangan
Simangunsong 53 (9): 1689–99.
Sreewirote, B, and M Leelajindakrairerk. 2016. “Design
and Development of Solar Water Pump.” IEEE.
Winanti, Naftalin, Burhanuddin Halimi, Agus Purwadi, and
Nana Heryana. 2018. “Study and Design of Energy-
Saving Solar Lamp for Rural Area in Indonesia.”
Proceedings - 2018 2nd International Conference on
Green Energy and Applications, ICGEA 2018, no. 79:
98–102. https://doi.org/10.1109/ICGEA.2018.8356307.
Smart Controller Design of Solar Home System (SHS) for Load Management with Grid Connected
303
