
IoT based Lithium-ion Battery Pack Performance Monitoring
Murie Dwiyaniti
1
, Luthfi Rahman Nova Kusuma
2
, Tohazen
2
, Nuha Nadhiroh
1
and Sri Lestari K.
3
1
Program Studi Teknik Otomasi Listrik Industri Listrik, Jurusan Teknik Elektro, Politeknik Negeri Jakarta
Jl Prof. Dr. GA Siwabessy, Kampus Baru UI Depok 16425, Depok, Indonesia
2
Program Studi Teknik Listrik, Jurusan Teknik Elektro, Politeknik Negeri Jakarta
Jl Prof. Dr. GA Siwabessy, Kampus Baru UI Depok 16425, Depok, Indonesia
3
Program Studi Telekomunikasi, Jurusan Teknik Elektro, Politeknik Negeri Jakarta
Jl Prof. Dr. GA Siwabessy, Kampus Baru UI Depok 16425, Depok, Indonesia
Keywords: Battery Pack, Blynk, Internet of Things, Lithium-ion.
Abstract: Lithium-ion batteries are the latest battery technology that claims to have a long lifetime. However, if using
a lithium-ion battery exceeds the state of health voltage, the lifetime of the lithium-ion battery will decrease
faster. In order to have a long lifetime, the lithium-ion battery requires a continuous, real-time, and mobile
monitoring system for battery electrical parameters. In this study, we created an IoT-based battery electrical
monitoring system applied to a lithium-ion battery pack with a capacity of 60 Ah, 12 Volt. This monitoring
system can monitor the current, voltage, power, and battery capacity data through the LCD on the panel and
smartphone every minute. As a result, during charge and discharge, the monitor system that has been created
successfully monitors all electrical data on the battery pack. The battery pack can supply 57Watt AC load at
discharge for 7 hours and 50Watt DC load for 9 hours. When charging, the battery pack takes 24 hours with
a charging current of 2 A. If the battery condition is low, the system will notify via smartphone. In addition,
electrical parameter data is well recorded through the Blynk application and google spreadsheet.
1 INTRODUCTION
Lithium-ion batteries are the latest battery technology
claimed to have a long lifetime and minimal
maintenance (Scrosati & Garche, 2010). So that
lithium ion batteries are widely used as energy
storage for electric cars (Xiong et al., 2017)(Berecibar
et al., 2016) or renewable energy power plants (Diouf
& Pode, 2015)(Wu et al., 2015). However, lithium ion
batteries must always be in the state of health to avoid
critical safety, reliability, and decreased performance
of Li-ion batteries. (Lu et al., 2013)(Xiong et al.,
2018). Some large-scale batteries generally use a
battery management system (BMS) to manage the
charge discharge process (Lin et al., 2019)(Carkhuff
et al., 2018). However, the current BMS design has
not monitored battery performance in real time and
mobile. BMS does not yet have the feature to connect
with Internet of Things (IoT) technology. IoT-based
monitoring system aims to increase scalability, cost-
effectiveness and flexibility in monitoring (Vermesan
& Friess, 2014).
Researchers have implemented an IoT-based
battery monitoring system, including a cloud-based
condition monitoring platform (Adhikaree et al.,
2017), cloud-based fault diagnosis (Kim et al., 2018),
dan android phone (Menghua & Bing, 2017). The
three studies present fairly complex programming
algorithms.
This article proposes to monitor the performance
of IoT-based battery packs with a simple
programming algorithm, using the Blynk platform.
One of the advantages of using the Blynk platform is
the ease of connectivity between field devices
(sensors) and microcontrollers, ease of programming,
and stability in the internet network to minimize data
loss. The Blynk platform is applied to monitor the
condition of the battery packs that have been made in
previous studies (Wiguna et al., 2021).
With an IoT-based monitoring system on the
battery pack, the battery pack's current, voltage,
power, and capacity can be monitored and recorded
in real time. If the battery pack condition is outside
the specified range, the system will notify the
smartphone owner.
668
Dwiyaniti, M., Kusuma, L., Tohazen, ., Nadhiroh, N. and K., S.
IoT based Lithium-ion Battery Pack Performance Monitoring.
DOI: 10.5220/0010950800003260
In Proceedings of the 4th International Conference on Applied Science and Technology on Engineering Science (iCAST-ES 2021), pages 668-673
ISBN: 978-989-758-615-6; ISSN: 2975-8246
Copyright
c
2023 by SCITEPRESS – Science and Technology Publications, Lda. Under CC license (CC BY-NC-ND 4.0)
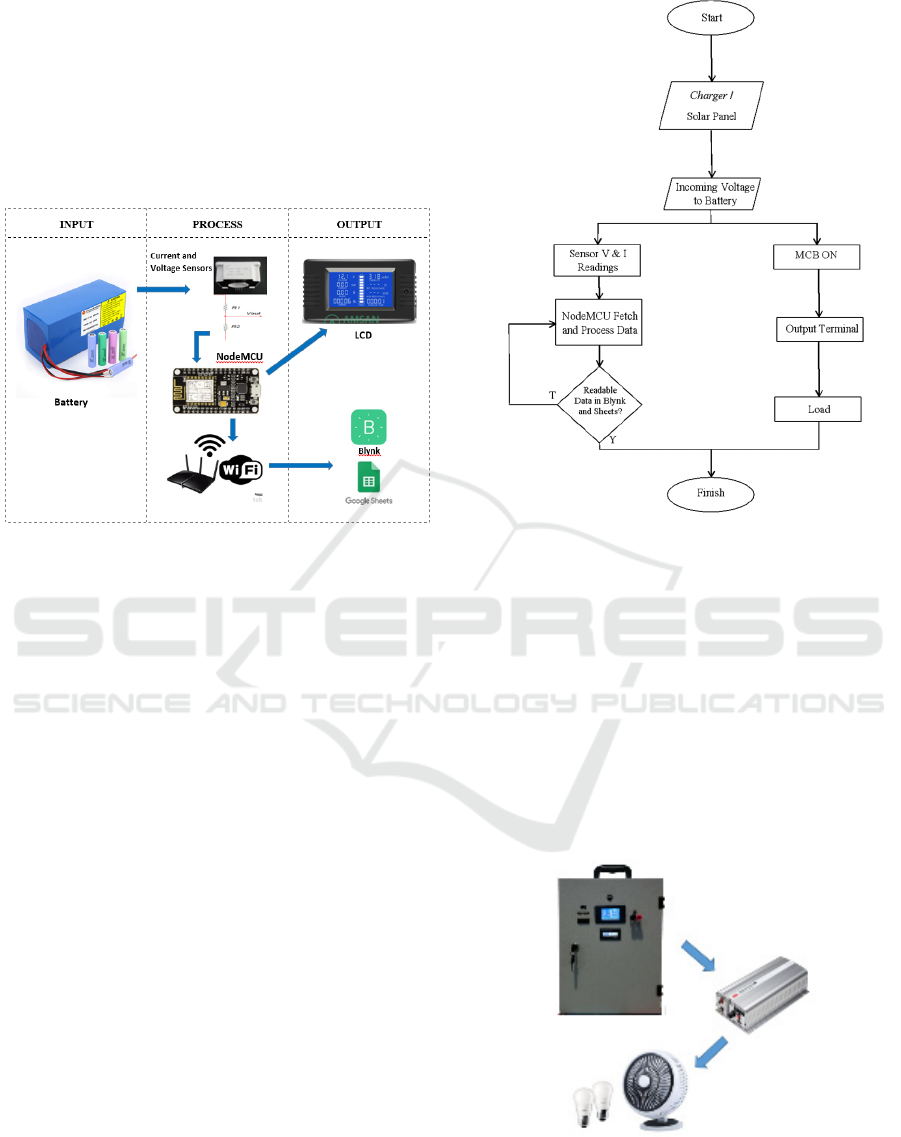
2 RESEARCH METHODOLOGY
The research method used is the design or
experimental method. The components of this
research consist of a voltage sensor, a current sensor,
an ADC module, an internet-connected NodeMCU,
and an LCD as shown in the general overview of the
study (Figure 1).
Figure 1: Monitoring system of the battery pack
performance.
The stages of the research:
1. Design the monitoring system.
2. Microcontroller programming and IoT platform.
The microcontroller used is NodeMCU ESP8266
with Arduino IDE software and Blynk for the IoT
platform. The parameters displayed on Blynk are
the voltage, current, power, total battery capacity
and the voltage graph. In addition, the data is
recorded on a google spreadsheet where the data
will be updated automatically every 1 minute
(figure 2).
3. Do the test for the battery performance monitoring
system.
The goal is to determine battery performance in
real-time, and the data can be monitored and
appropriately recorded. The tests carried out are
(1) discharge the battery pack with AC and DC
loads, (2) charging the battery pack, (3) sending
and displaying data on Blynk and google
spreadsheets, (5) fault conditions or low battery.
Figure 2: Battery pack flowchart.
3 RESULTS AND DISCUSSION
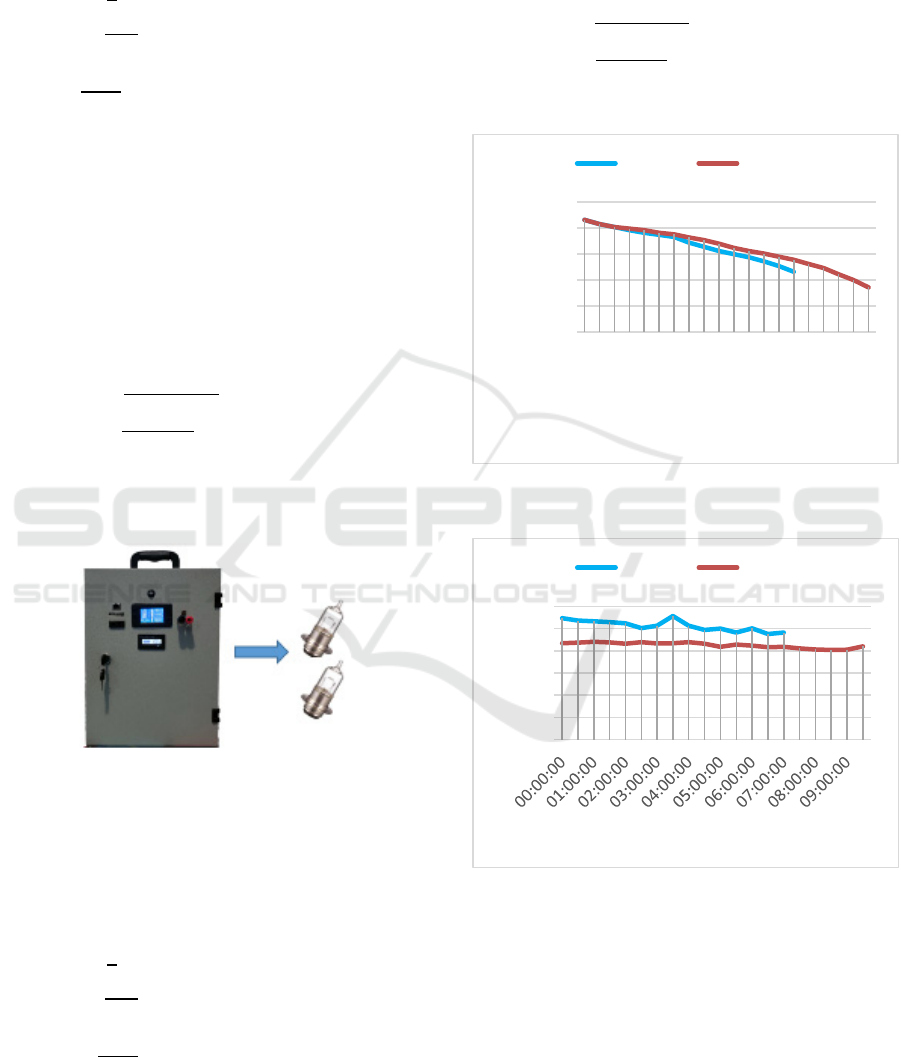
3.1 Discharging Battery Pack with AC
and DC Load
This test is a battery discharge test using an AC load
and a DC load alternately. The total AC load used was
57W, consisting of 9 W lamps, 18 W lamps, 5 W
lamps and 25 W fans. To convert the DC voltage of
the battery pack into AC, we use an inverter, as shown
in Figure 4.
Figure 3: Discharge test circuit with AC load.
The discharging test with AC load has been
carried out until the battery capacity indicator on the
IoT based Lithium-ion Battery Pack Performance Monitoring
669
LCD remaining 20%. This testing process takes 7
hours. According to the specifications, the designed
battery pack has a capacity of 60 Ah. While the AC
load current used is:
𝐼 =
(1)
𝐼 =
= 4,75 𝐴
So that by calculation this battery can be used:
𝑡 =
,
=12,6 ℎ𝑜𝑢𝑟𝑠
However, this test can only be used for up to 7 hours
because it was only tested until the battery capacity
indicator shows 20%. In addition, the inverter was
suspected to be the cause of the large current
consumption so that the battery discharge becomes
faster.
The test is complete when the battery capacity is
at 20% to keep the battery condition safe. SOC
calculation, the lowest battery voltage is 9.91. So the
test is stopped when the voltage is 10.38 V or when it
is already 20%.
SOC =
× 100 % (2)
SOC =
,,
,,
× 100 % = 20,17 %
While discharge testing using the DC load was
two lamps of 25 W, the total load was 50 W. The test
circuit is shown in Figure 4.
Figure 4:
Discharge test circuit with DC load.
Testing using a DC load are carried out until the
battery capacity indicator on the LCD shows 15%.
This testing process takes 9 hours and 30 minutes.
According to the specifications, this designed battery
pack has a capacity of 60 Ah. While the DC load
current used is:
𝐼 =
(3)
𝐼 =
= 4,16 𝐴
by calculation, this battery can be used:
𝑡 =
,
= 14,4 ℎ𝑜𝑢𝑟𝑠
However, this test can only be used up to 9 hours
30 minutes because it is only tested until the battery
capacity indicator shows 15%.
The test is complete when the battery capacity is
at 15% to keep the battery condition safe. SOC
calculation, the lowest battery voltage is 9.91. So the
test is stopped when the voltage is 10.27 V or when
it's already 15%.
SOC =
× 100 % (4)
SOC =
,,
,,
× 100 % = 15,45 %
The test results using an AC load and a DC load
are shown in Figures 5, 6 and 7.
Figure 5: Voltage versus Time on AC and DC Load
Discharge Test.
Figure 6: Current versus Time on AC and DC Load
Discharge Test.
Figure 5 shows a graph of the voltage value versus
the time of the total battery output. These data show
that the longer the running time, the voltage value
decreases from 12.16 V to 11.27 V when using an AC
load and the voltage drops from 12.16 V to 10.86 V
on DC load. The difference in voltage drop on AC and
DC loads occurs due to different SOC level settings.
However, the voltage drop that occurs is still in the
standard battery pack range, which is at least 9.91 V.
10
10,5
11
11,5
12
12,5
00:00:00
01:00:00
02:00:00
03:00:00
04:00:00
05:00:00
06:00:00
07:00:00
08:00:00
09:00:00
Voltage (V)
Time (hours)
Load AC Load DC
0
1
2
3
4
5
6
Current (A)
Time (hours)
Load AC Load DC
iCAST-ES 2021 - International Conference on Applied Science and Technology on Engineering Science
670
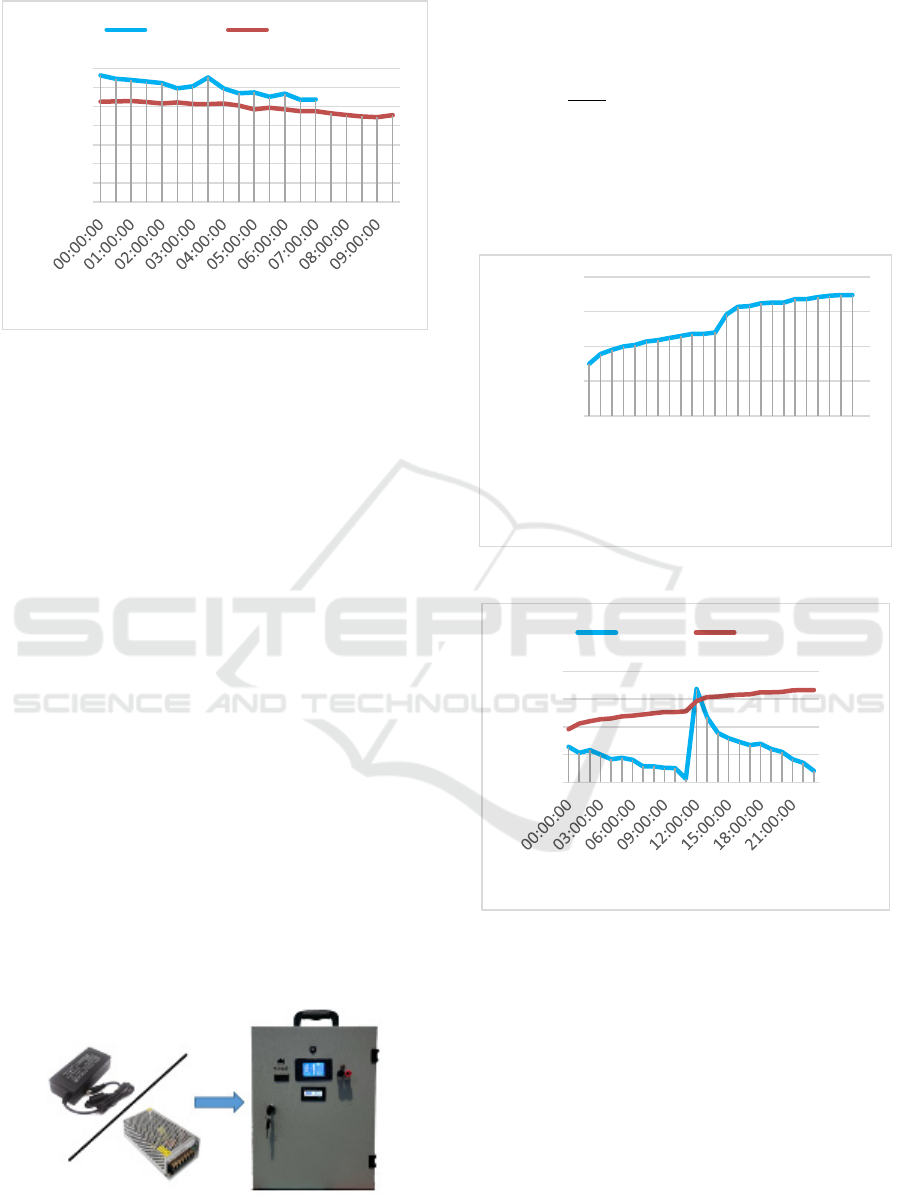
Figure 7: Power versus Time on AC and DC Load
Discharge Test.
Figure 6 shows a graph of the current value versus
the time of the total battery output. Based on Figure
6, the current flowing from the battery pack to the
load tends to be stable because the load is constant.
The current is greater than the calculation result at the
AC load because there is an additional current from
the inverter. While at DC load, the load current that
occurs is following the calculation. At 4 o'clock there
is a sudden increase in current due to a change in AC
load, the lamp breaks. After replacing the lamp, the
current returns to normal.
Figure 7 shows a graph of the power value versus
the time of the total battery output. Based on figure 7,
the power consumption corresponds to the load. The
AC power consists of 2 loads, the lamp load is 57 W,
and the rest is the inverter. While on DC power, only
50 W lamp. Power consumption also tends to
decrease due to a decrease in battery pack voltage
3.2 Charging Battery Pack
After completing the discharge test, the next test is to
charge the battery pack using a 2 A adapter. The
adapter is connected to the battery pack through the
charging socket located on the door of the battery
pack panel (figure 8).
Figure 8: Charge test circuit.
Based on calculations with a constant charging
current of 2A, the charging process from null to full
takes time:
𝑡 =
= 30 ℎ𝑜𝑢𝑟𝑠
Nevertheless, in this test, the battery pack
charging process was 23 hours. It happened because
the charging process starts when the battery capacity
condition is 20% instead of zero. The test results are
shown in Figures 9, 10, and 11.
Figure 9: Voltage versus Time on Charge Test.
Figure 10: Current capacity versus Time on Charge Test.
Based on figure 9, the battery charging process is
successful. The voltage continues to rise from 11.25
V to a full battery pack of 12.24 V, and the voltage
increase tends to be constant ± 0.2V. At 12.00, there
is a significant change in voltage. The cause of this is
the replacement of the 2A adapter with a 4 A power
supply.
Figure 10 shows the current charging and capacity
battery pack. The current charging condition is
inversely proportional to the battery pack capacity.
The charging current decreases as the battery capacity
increases. This condition is the same as the
0
10
20
30
40
50
60
70
Power (W)
Time (hours)
Load AC Load DC
10,5
11
11,5
12
12,5
00:00:00
02:00:00
04:00:00
06:00:00
08:00:00
10:00:00
12:00:00
14:00:00
16:00:00
18:00:00
20:00:00
22:00:00
Voltage (V)
Time (hours)
0%
20%
40%
60%
80%
100%
120%
0
1
2
3
4
Current (A)
Time (hours)
Current Capacity
IoT based Lithium-ion Battery Pack Performance Monitoring
671
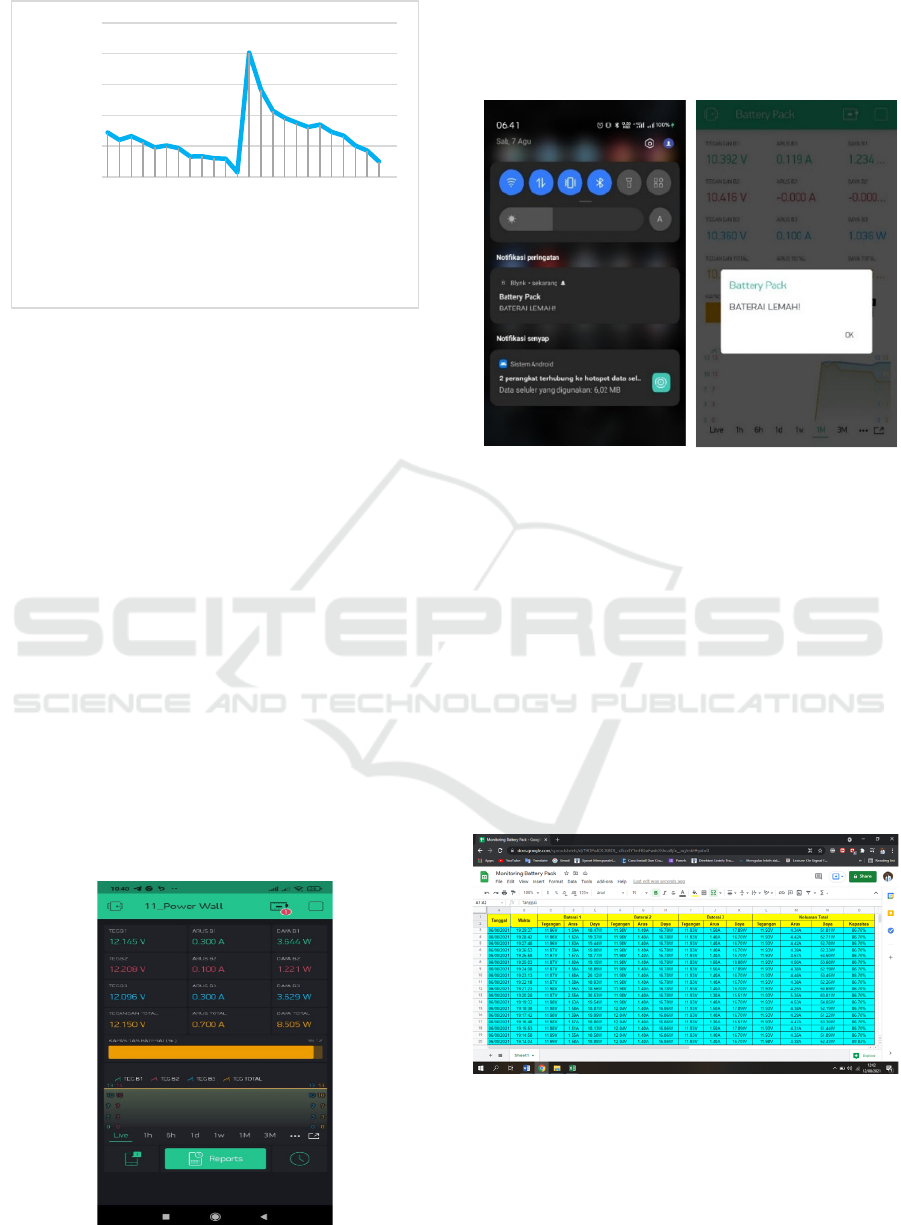
Figure 11: Power versus Time on Charge Test.
characteristics of battery charging. At 12.00, there
is a significant change in current of around 3.4 A. It
happened to cause the replacement of the 2A adapter
with a 4 A power supply. However, this condition is
still safe because the battery pack can accept up to
4.19 A currents.
The charging current strongly influences the
power at the time of charging. The smaller the current,
the smaller the power generated, as shown in figure
11.
3.3 IoT-based Performance Monitoring
Results
3.3.1 Monitoring Results through the Blynk
Application
1. Display on the Blynk application
The data on the charging and discharging process can
be viewed with the Blynk application on a
smartphone. Figure 12 shows the Blynk display when
connected.
Figure 12: Blynk Display.
2. Notifications when the battery is low
When the remaining battery capacity is 20%, the
Blynk app will give a "Low Battery!" notification on
a smartphone, as in Figure 13.
(
a
)
(
b
)
Figure 13: (a) Notification display on the smartphone
notification bar and (b) notification display when opening
the Blynk app.
3.3.2 Google Sheets Monitoring Results
Figure 14 is a display on a google spreadsheet in
which data contain the results of sensor readings from
the tool. The data displayed in the google spreadsheet
are the date, time, voltage, current, and power values
of each battery pack, the total battery output on the
device, and the battery capacity value or state of
charge (SOC) of the total battery output. The data in
the google spreadsheet will be updated automatically
every 1 minute.
Figure 14: Monitoring view via a google spreadsheet.
4 CONCLUSIONS
The monitoring system of the performance battery
pack based on IoT has been functioning correctly by
0
10
20
30
40
50
00:00:00
02:00:00
04:00:00
06:00:00
08:00:00
10:00:00
12:00:00
14:00:00
16:00:00
18:00:00
20:00:00
22:00:00
Power (W)
Time (hours)
iCAST-ES 2021 - International Conference on Applied Science and Technology on Engineering Science
672

displaying data on the current, voltage, power, and
capacity of the battery pack and recording the data in
a google spreadsheet. However, the charging and
discharging process takes a long time because it
depends on the load; the system built on this battery
pack can be monitors and records data for analysis
purposes. For further research, this battery pack
system can be used to store energy from solar panels.
ACKNOWLEDGMENTS
The authors would like to acknowledge the financial
support provided by the vocational higher education
strengthening program Teknik Otomasi Listrik
Industri Study Program and a research grant from
UP2M PNJ.
REFERENCES
Adhikaree, A., Kim, T., Vagdoda, J., Ochoa, A.,
Hernandez, P. J., & Lee, Y. (2017). Cloud-based battery
condition monitoring platform for large-scale lithium-
ion battery energy storage systems using internet-of-
things (IoT). 2017 IEEE Energy Conversion Congress
and Exposition (ECCE), 1004–1009.
Berecibar, M., Gandiaga, I., Villarreal, I., Omar, N., Van
Mierlo, J., & Van den Bossche, P. (2016). Critical
review of state of health estimation methods of Li-ion
batteries for real applications. Renewable and
Sustainable Energy Reviews, 56, 572–587.
Carkhuff, B. G., Demirev, P. A., & Srinivasan, R. (2018).
Impedance-based battery management system for
safety monitoring of lithium-ion batteries. IEEE
Transactions on Industrial Electronics, 65(8), 6497–
6504.
Diouf, B., & Pode, R. (2015). Potential of lithium-ion
batteries in renewable energy. Renewable Energy, 76,
375–380.
Kim, T., Makwana, D., Adhikaree, A., Vagdoda, J. S., &
Lee, Y. (2018). Cloud-based battery condition
monitoring and fault diagnosis platform for large-scale
lithium-ion battery energy storage systems. Energies,
11(1), 125.
Lin, Q., Wang, J., Xiong, R., Shen, W., & He, H. (2019).
Towards a smarter battery management system: A
critical review on optimal charging methods of lithium
ion batteries. Energy, 183, 220–234.
Lu, L., Han, X., Li, J., Hua, J., & Ouyang, M. (2013). A
review on the key issues for lithium-ion battery
management in electric vehicles. Journal of Power
Sources, 226, 272–288.
Menghua, W., & Bing, X. (2017). A real-time android-
based monitoring system for the power Lithium-Ion
battery used on EVs. 2017 10th International
Conference on Intelligent Computation Technology
and Automation (ICICTA), 245–249.
Scrosati, B., & Garche, J. (2010). Lithium batteries: Status,
prospects and future. Journal of Power Sources, 195(9),
2419–2430.
Vermesan, O., & Friess, P. (2014). Internet of things-from
research and innovation to market deployment (Vol.
29). River publishers Aalborg.
Wiguna, A. R., Tohazen, Nadhiroh, N., Lestari, S., &
Dwiyaniti, M. (2021). Rancang bangun dan pengujian
battery pack lithium ion. Electrices, 3 (1).
Wu, L., Gao, W., Cui, Z., & Kou, X. (2015). A novel
frequency regulation strategy with the application of
energy storage system for large scale wind power
integration. 2015 Seventh Annual IEEE Green
Technologies Conference, 221–226.
Xiong, R., Cao, J., Yu, Q., He, H., & Sun, F. (2017). Critical
review on the battery state of charge estimation
methods for electric vehicles. Ieee Access, 6, 1832–
1843.
Xiong, R., Li, L., & Tian, J. (2018). Towards a smarter
battery management system: A critical review on
battery state of health monitoring methods. Journal of
Power Sources, 405, 18–29.
IoT based Lithium-ion Battery Pack Performance Monitoring
673
