
Optimization of Irrigation Water using System of Rice Intensification
(SRI) Method in the Kereloko Irrigation Area West Sumba Regency
Stefen Ndun, Yacob Victor Hayer and Fabianus Jawal S. Nope
Department of Civil Engineering, State Polytechnic of Kupang, Indonesia
Keywords: Optimation, Kereloko, Conventional Method, System of Rice Intensification, Water Requirement.
Abstract: Sumba Island is a semi-arid climate with an average annual rainfall of 800 mm. Low rainfall has an impact
on the low potential of water resources needed for agriculture. This study was conducted to compare existing
irrigation water supply techniques and water saving supply techniques. The water supply applied in the study
area is a conventional technique, while the new technique that will be compared is SRI (System of Rice
Intensification). The SRI technique is expected to save irrigation water and thereby increase the planted area.
The available discharge data is used to calculate the irrigation water balance. The conventional method results
show that the area of rice fields that can be irrigated for the first planting season to third planting season were
57.5 hectares, 32 hectares, and 19 hectares, respectively. The area of rice fields that can be irrigated by the
SRI method for the first and second planting season is 85.5 hectares, and third planting season is 54.9 hectares.
Compared with the conventional method, applying the SRI method can increase the planted area by 155.8%
in the first and second planting season.
1 INTRODUCTION
According to the Schmidth-Fergudon climate
classification, the island of Sumba is an area with
climate type E, which is a semi-arid climate with a
large area of savanna. As a semi-arid area, Sumba
island is an area with low rainfall, with an average
annual rainfall of 1200 mm. The eastern part of the
island of Sumba is the area with the lowest rainfall. In
the west, the average annual rainfall is 2,500 mm,
while along the north and east coasts the average
annual rainfall is only 800 mm (Nuri, 1985).
Low rainfall has an impact on the low potential of
water resources. Limited water resources affect the
agricultural sector, especially rice irrigated
agriculture. The irrigation method applied on the
island of Sumba is a conventional method, guided by
the criteria for irrigation planning (KP/Kriteria
Perencanaan Irigasi), from the Ministry of Public
Works. This conventional method uses a continuous
watering technique (continuous inundation),
therefore it requires the large availability of water.
To anticipate the limited availability of water, it is
necessary to apply water-saving rice cultivation
methods. One method of water-saving rice cultivation
that can be applied to optimize water use in areas with
limited water resources is the System of Rice
Intensification (SRI). SRI has the advantage, that it
saves water (during the vegetative phase the land is in
a saturated state to the micro crack state), entering the
generative phase the land is irrigated a maximum of 2
cm. This inundated state is cultivated until 25 days
before harvest (Rozen, 2018).
Many studies about the application of the SRI
method have been carried out, including by Puteriana
S. A. et.al (2016), in her study, comparing the
conventional LPR-FPR (Luas palawija relatif -
Faktor palawija relatif) method with the SRI method.
The results of his study showed that the irrigation
water supply system using the SRI method could
increase cropping intensity by 300% and had a saving
rate of 88.65% when compared to the conventional
method. Hidayat YR & Suciaty T. (2019), in their
study, compared income between SRI rice cultivation
and conventional methods. The results of his study
showed that with the SRI method, rice production
increased by 20% compared to the conventional
method. SRI rice production is 6.2 tons/ha, while the
conventional method is 5.7 tons/ha.
This study compares irrigation water consumption
between the Ministry of Public Works' conventional
method and the SRI method. The aim of this study is
740
Ndun, S., Hayer, Y. and Nope, F.
Optimization of Irrigation Water using System of Rice Intensification (SRI) Method in the Kereloko Irrigation Area West Sumba Regency.
DOI: 10.5220/0010952700003260
In Proceedings of the 4th International Conference on Applied Science and Technology on Engineering Science (iCAST-ES 2021), pages 740-747
ISBN: 978-989-758-615-6; ISSN: 2975-8246
Copyright
c
2023 by SCITEPRESS – Science and Technology Publications, Lda. Under CC license (CC BY-NC-ND 4.0)

to determine cropping intensity and irrigation water
savings.
2 STUDY AREA
The study location is the Kereloko Ricefield Area
(DI/Daerah Irigsi) in the District of Kota
Waikabubak, West Sumba Regency (Fig 1).
Administratively, DI Kereloko is located in the
Wailingan Village, Kota Waikabubak sub district,
West Sumba Regency, East Nusa Tenggara Province.
The water source for irrigating the rice fields is taken
from the Kereloko River. The total area of land that
can be irrigated is about 54.9 ha. In DI Kereloko,
three planting seasons were applied with the planting
scheme in each season being paddy – paddy –
secondary crops (crops planted as 2d crop in dry
season). Limited water sources cause the area of rice
fields that can be cultivated for each season is not
maximal, especially in the third planting season, due
to low water availability, only secondary crops can be
planted.
3 MATERIALS AND METHODS
3.1 Data
The data used in this study include: (a) daily rainfall
and temperature data – from Indonesian Meteorology
and Geophysics Agency. Only 1 rainfall and
temperature data is used. Rainfall data obtained from
the Kota Waikabubak rainfall station gauge, while the
weather data is taken from the Umbu Mehang Kuda
Meteorological Station gauge, East Sumba Regency;
(b) streamflow data and irrigation network scheme –
from Water Resources division, West Sumba
Regency Public Works Service.
3.2 Conventional Method Description
The irrigation method applied on the island of Sumba
is a conventional method, guided by the criteria for
irrigation planning (KP/Kriteria Perencanaan
Irigasi), from the Ministry of Public Works. This
method requires rainfall data and temperature data.
Rainfall data is used to calculate the effective rainfall
and temperature data is used to calculate
evapotranspiration. Conventional method calculates
net field water requirement according to the equation
(
Kementerian Pekerjaan Umum, 2013):
NFR ET
P WLR – R
Where NFR is the net rice field water requirement
(mm/day), P is percolation (mm/day), ET
is crop
Figure 1: Study Area.
Optimization of Irrigation Water using System of Rice Intensification (SRI) Method in the Kereloko Irrigation Area West Sumba Regency
741

water requirement (mm/day), WLR is Water layer
replacement (mm/day), and Re is effective rainfall
(mm/day).
Crop
water requirement (ET
) obtained from
evapotranspiration (ET
) multiplied by the crop
coefficient (K
). Evapotranspiration is calculated by
the Pennman-Modification formula. Pennman-
Modification calculates evapotranspiration according
to the equation (Doorenbos, 1977):
ET
c
W∙Rn
1W
∙f
u
∙
ea ed
Where ET
is reference crop evapotranspiration
(mm/day); W is temperature-related weighted factor;
Rn is net radiation in equivalent evaporation
(mm/day); f(u) is wind-related function; (ea – ed) is
difference between the saturation vapour pressure at
mean air temperature and the mean actual vapour
pressure of the air (both in mbar); and c is adjustment
factor to compensate for the effect of day and night
weather conditions. Based on the guidelines from the
KP, the amount of percolation (P) is between 1-3
mm/day, while Water layer replacement (WLR) is
performed 2 times, each 50 mm during the first month
and the second month after transplantation.
The time required for land preparation is 30-45
days. The water requirement for land preparation is
calculated using the formula:
IR Me
/e
1
Where IR is the water requirement at the rice field; M
is the water requirement to replace water loss due to
evaporation and percolation in saturated rice fields. M
is calculated by the formula
ME
P
Where E
is open water evaporation during land
preparation (mm/day) (E
is taken as 1,1 ET
); and P
is percolation (mm/day). K is calculated by the
formula:
K M ∙ T/S
Where T is the land preparation time (days); and S is
the water requirement for saturation plus 50 mm
water layer.
3.3 SRI Description
In SRI rice cultivation, the condition of water
availability in the land is regulated so that the land is
slightly dry but still sufficient for plant water needs.
Water supply for SRI method is based on 3 stages,
namely, nursery, land preparation, and breeding. The
breeding stage is divided into a vegetative phase and
a generative phase. After the breeding stage, which is
10 days before harvest, the land is left to dry.
The nursery time was 10 days with the interval of
watering is every 5 day and the thickness of the water
layer was 75 mm. The land area for the nursery is 5%
of the total land area. The time required for land
preparation is 30 days, with the watering interval is
every 5 days and the thickness of the water layer is 23
mm. Land area for land preparation is 95% of the total
land area. The time required for breeding stage is 90
days. At the breeding stage the thickness of the water
layer is 20 mm. The watering interval at the breeding
stage was different between planting seasons I, II, and
III. The watering intervals for the vegetative phase for
each planting season are every 8 day, every 5 day, and
every 5 day. Meanwhile, in the generative phase, the
watering intervals for each planting season are every
10 day, every 7 day, and every 7 day.
4 RESULTS AND DISCUSSION
4.1 Conventional Method Analysis
Land preparation time was adjusted according to the
SRI method, which was 30 days. Water requirements
during land preparation can be seen in the table 1.
Before calculating the water requirement for rice
plants, the effective rainfall and evapotranspiration
are calculated first. The results of the calculation of
effective rainfall can be seen in table 2 while
evapotranspiration can be seen in table 3. Three
planting seasons were applied with the
planting
scheme
in each season being paddy – paddy – paddy.
The beginning of planting is on November I. The
results of calculating of net field water
requirement
(NFR) can be seen in table 4. The intake water
requirement is calculated by dividing the net water
requirement in the fields (NFR) by the overall
irrigation efficiency (eff). According to KP the
overall irrigation efficiency is 65%. By dividing the
NFR by eff and multiplied by the fields area (54,9
hectares), the water demand at the intake
(liter/second) is obtained. The water demand at the
Table 1: Water requirements for land preparation (mm/day).
Month Jan Feb Ma
r
A
pr
Ma
y
Jun Jul Au
g
Se
p
Oct Nov Dec
IR 13.0 13.0 12.8 13.0 12.9 13.2 13.2 13.8 14.5 14.6 14.0 13.4
iCAST-ES 2021 - International Conference on Applied Science and Technology on Engineering Science
742
Table 2: Effective rainfall (mm/day).
Month
November December January February March April
Period
I II II I II II I II II I II II I II II I II II
Re 4.5 4.5 4.1 3.8 3.8 4.7 3.5 3.5 3.2 1.2 1.2 1.2 0.7 0.7 0.7 0.0 0.0 0.0
Month Ma
y
June Jul
y
Au
g
ustus Se
p
tembe
r
Octobe
r
Period I II II I II II I II II I II II I II II I II II
Re 0.0 0.0 0.0 0.0 0.0 0.0 0.0 0.0 0.0 0.7 0.7 0.6 1.9 1.9 1.9 6.0 6.0 5.4
Table 3: Evapotranspiration (Mm/Day).
Month
November December January February
March
April
Period I II II I II II I II II I II II I II II I II II
Et0 7.8 7.8 7.8 7.0 7.0 7.0 6.5 6.5 6.5 6.5 6.5 6.5 6.2 6.2 6.2 6.5 6.5 6.5
Month May June July Augustus Septembe
r
Octobe
r
Period I II II I II II I II II I II II I II II I II II
Et0 6.4 6.4 6.4 6.8 6.8 6.8 6.8 6.8 6.8 7.6 7.6 7.6 8.4 8.4 8.4 8.5 8.5 8.5
Table 4: Net field water requirement / NFR (liter/second/hectare).
Month Novembe
r
Decembe
r
Januar
y
Februar
y
March April
Period
I II III I II III I II III I II III I II III I II III
NFR 1.3 1.3 1.4 0.9 0.9 0.9 1.0 0.9 1.0 1.1 1.0 1.6 1.6 1.6 1.6 1.3 1.2 1.4
Month May June July Augustus Septembe
r
Octobe
r
Period I II III I II III I II III I II III I II III I II III
NFR 1.4 1.3 1.4 1.3 1.5 1.9 1.9 1.8 1.8 1.3 1.3 1.5 1.5 1.4 1.5 0.9 0.8 1.3
Table 5: Water demand at the intake (liter/second).
Month Novembe
r
Decembe
r
Januar
y
Februar
y
March A
p
ril
Period I II III I II III I II III I II III I II III I II III
Water
deman
d
103 103 107 69 67 68 78 69 78 85 79 123 126 126 126 97 94 104
Month May June July Augustus Septembe
r
Octobe
r
Period 1 2 31 1 212312312 3 1 2 3
ater
deman
d
107 98 105 100 113 146 146 136 136 103 102 112 116 106 112 68 59 100
intake can be seen in table 5.
4.2 SRI Analysis
The calculation of irrigation water requirements using
the SRI method is simpler than the conventional
method. The SRI method does not require rainfall
data and climate data. As a substitute for the influence
of rainfall and evaporation, in the first planting season
(high rainfall), during the breeding stage, the interval
of watering is longer than the second and third
planting seasons, i.e. every 8 days for the vegetative
phase and every 10 days for the generative phase.
During planting season II and III (very little rain/no
rain and high evaporation), watering interval is
shorter, i.e. every 7 days for the vegetative phase and
every 5 days for the generative phase. The nursery
stage coincides with field preparation, starting in
November I. The results of the calculation of
irrigation water requirements using the SRI method
can be seen in table 6.
The intake water requirement is calculated by
dividing the water requirement in the fields (by the
overall irrigation efficiency (eff). The irrigation
efficiency is the same as the conventional method
which is 65%. By dividing the water requirement in
the fields by eff, the water demand at the intake is
obtained. The water demand at the intake can be seen
in table 7.
4.3 Optimization
The Kereloko irrigation area gets its water supply
from the Kereloko river. The discharge data of the
Kereloko river is very limited. The river discharge
data is a manual measurement from the Water
Resources division, West Sumba Regency Public
Works Service. River discharge measurements were
Optimization of Irrigation Water using System of Rice Intensification (SRI) Method in the Kereloko Irrigation Area West Sumba Regency
743
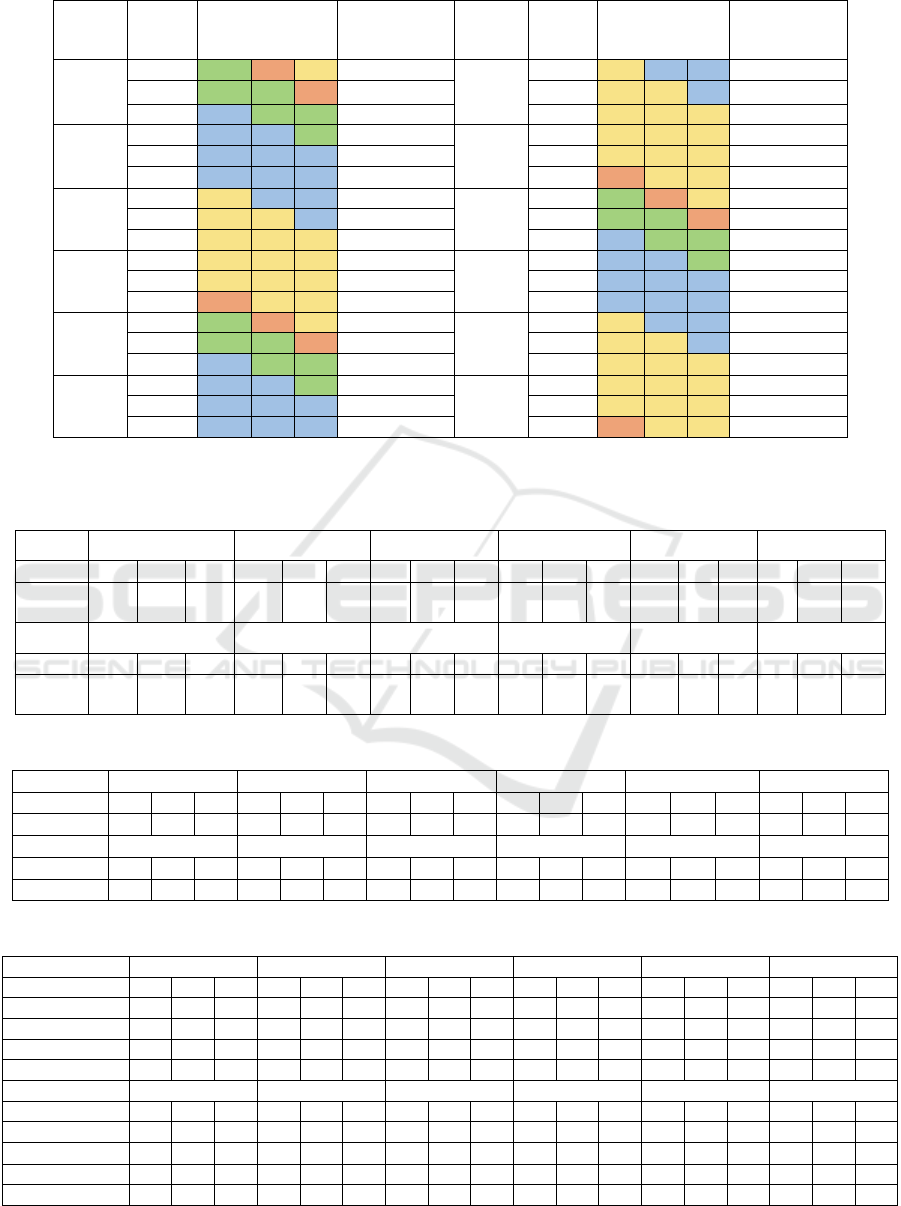
Table 6: Crop water requirements using the SRI method (liters/second).
Month Period
Cropping
scheme
Water
requirement
Month Period
Cropping
scheme
Water
requirement
Nov
I PL
K
G 19.08
May
I G V V 7.94
II PL PL
K
29.72 II G G V 7.41
III V PL PL 32.36 III G G G 6.88
Des
I V V PL 20.19
June
I G G G 6.35
II V V V 7.94 II G G G 6.35
III V V V 7.94 III
K
G G 4.24
Jan
I
G V V 7.41
July
I PL
K
G 16.97
II G G V 6.88 II PL PL
K
29.70
III G G G 6.35 III V PL PL 32.34
Feb
I
G G G 6.35
Agust
I V V PL 20.14
II G G G 6.35 II V V V 7.94
III
K
G G 4.24 III V V V 7.94
Mar
I
PL
K
G 17.01
Sept
I G V V 7.41
II PL PL
K
29.70 II G G V 6.88
III V PL PL 32.34 III G G G 6.35
Apr
I V V PL 20.14
Okt
I G G G 6.35
II V V V 7.94 II G G G 6.35
III V V V 7.94 III
K
G G 4.24
Note: PL is nursery and field preparation; V is the vegetative phase; G is the generative phase; and K is when the land is
allowed to dry.
Table 7: Water demand at the intake (liter/second).
Month
November December January February March April
Period
I II III I II III I II III I II III I II III I II III
Water
deman
d
29 46 50 31 12 12 11 11 10 10 10 7 26 46 50 31 12 12
Month
May June July Augustus September October
Period I II III I II III I II III I II III I II III I II III
Water
deman
d
12 11 11 10 10 7 26 46 50 31 12 12 11 11 10 10 10 7
Table 8: Kereloko river discharge.
Month Nov Dec Jan Feb Ma
r
Ap
r
Perio
d
I II III I II III I II III I II III I II III I II III
Discharge 125 125 125 142 142 143 127 127 127 129 129 129 122 122 122 106 106 106
Month May Jun Jul Aug Sep Oct
Perio
d
I II III I II III I II III I II III I II III I II III
Dischar
g
e 89 89 89 74 74 74 56 56 61 83 83 83 113 113 113 118 118 129
Table 9: Water Balance (conventional method).
Month Novembe
r
Decembe
r
Januar
y
Februar
y
March A
p
ril
Perio
d
I II III I II III I II III I II III I II III I II III
Availabilit
y
125 125 125 142 142 143 127 127 127 129 129 129 122 122 122 106 106 106
Re
q
uirement 103 103 107 69 67 68 78 69 78 85 79 123 126 126 126 97 94 104
Water Balance 22 22 18 73 75 75 48 58 48 44 50 6 -4 -4 -4 9 11 2
Information S S S S S SSSSSSSDD D S SS
Month Ma
y
June Jul
y
Au
g
ust Se
p
tembe
r
Octobe
r
Perio
d
I II III I II III I II III I II III I II III I II III
Availabilit
y
89 89 89 74 74 74 56 56 61 83 83 83 113 113 113 118 118 129
Re
q
uirement 107 98 105 100 113 146 146 136 136 103 102 112 116 106 112 68 59 100
Water Balance -19 -9 -16 -26 -39 -72 -90 -80 -75 -21 -19 -29 -3 7 1 50 58 29
Information D D D D D DDDDDDDDS S S S S
Note: S is Surplus; D is deficit.
iCAST-ES 2021 - International Conference on Applied Science and Technology on Engineering Science
744

Figure 2: Water balance curve (conventional method).
Table 8: Water Balance (SRI method).
M
onth Nov Dec Jan Feb Ma
r
A
pr
P
erio
d
I II III I II III I II III I II III I II III I II III
A
vailabilit
y
125 125 125 142 142 143 127 127 127 129 129 129 122 122 122 106 106 106
R
e
q
uirement 33 51 56 35 14 14 13 12 11 11 11 7.3 29 51 56 35 14 14
W
ater Balance 92 74 69 107 128 129 114 115 116 118 118 122 93 71 66 71 92 92
I
nformation S S S S S S S S S S S S S S S S S S
M
onth Ma
y
Jun Jul Au
g
Se
p
Oct
P
erio
d
I II III I II III I II III I II III I II III I II III
A
vailabilit
y
89 89 89 74 74 74 56 56 61 83 83 83 113 113 113 118 118 129
R
e
q
uirement 13.7 13 12 11 11 7.3 29 51 56 35 14 14 13 12 11 11 11 7.3
W
ater Balance 75 76 77 63 63 66 26 4 5 48 69 69 100 101 102 107 107 122
I
nformation S S S S S S S D D S S S S S S S S S
Note: S is Surplus; D is deficit
Figure 3: Water balance curve (SRI method).
carried out only once in 2016. The data on the
Kereloko river discharge can be seen in table 8.
Based on requirement discharge in the field and the
available discharge data, then a water balance
analysis is carried out to determine the balance of
irrigation water. The irrigation water balance for
conventional methods can be seen in table 9 and
figure 2. While the water balance of the SRI method
can be seen in table 10 and figure 3.
I to October III there was a surplus of water
because at that time it had entered the beginning of
the rainy season. In order to avoid water shortages, in
the second and third planting seasons, the cropping
intensity is reduced. The appropriate planting
intensity to avoid water shortages was 58.29% (32
hectares) for the 2nd planting season, and 34.61% (19
hectares) for the 3rd planting season. For the first
planting season (November-February) the availability
of water is greater than the need, therefore the
planting intensity can be increased by 104.71% (57.5
hectares). The water balance with a planting intensity
of 104.71% for the first planting season, 58.29% for
the second planting season, and 34.61% for the third
planting season can be seen in Figure 4.
0
20
40
60
80
100
120
140
160
I II III I II III I II III I II III I II III I II III I II III I II III I II III I II III I II III I II III
Nov Des Jan Peb Mar April May June Jul Ags Sept Oct
Discharge (Liters/second)
Availability
Requirement
0
20
40
60
80
100
120
140
160
I II III I II III I II III I II III I II III I II III I II III I II III I II III I II III I II III I II III
Nov Dec Jan Feb Mar Apr May Jun Jul Aug Sep Oct
Discharge (Liters/second)
Availability
Requirement
Optimization of Irrigation Water using System of Rice Intensification (SRI) Method in the Kereloko Irrigation Area West Sumba Regency
745
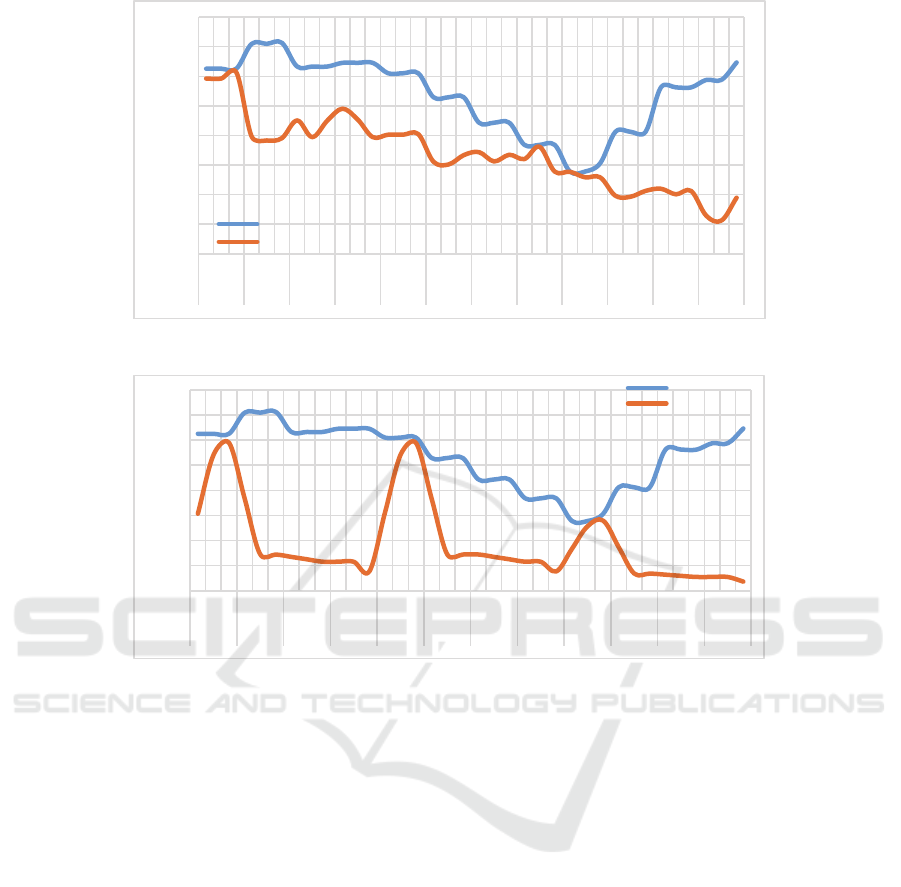
Figure 4: Water balance (planting intensity 104.71%, 58,29%, and 34,61%).
Figure 5: Water balance (planting intensity 155.8%, and 100%).
Meanwhile, by applying the SRI method (table 8
and figure 3), the availability of water for the entire
growing season is sufficient. For the first and second
planting seasons, the planting intensity can be
increased, while for the third planting season, the
planting intensity cannot be increased because the
disparity between the availability of discharge and the
discharge of demand is very low. As shown in table 8
and figure 5, the surplus of water in July II was only
4 liters/second and July III was only 5 liters/second.
For the first and second planting seasons, each
planting intensity can be increased by 155.8% (85.5
hectares). In other words, for the first and second
planting seasons, the land area can be increased by
30.6 hectares from the existing condition (54.9
hectares). The water balance with a planting intensity
of 155.8% for the first and second planting seasons,
and 100% for the third planting season can be seen in
Figure 5.
5 CONCLUSION
This study shows that the rice fields that can be
irrigated is not optimal when using conventional
methods. For the first planting season, the planting
intensity can be increased to 104.71% or the rice field
area can be increased to 57,5 hectares, an increase of
2,6 hectares from the existing rice field area (the
existing rice field area is 54.9 hectares). Meanwhile,
in the second planting season, the planting intensity
was only 58.29% (32 hectares of rice field that can be
irrigated). In the third planting season, the planting
intensity was lower than the second planting season,
which was 34.61% (the area of rice field that could be
irrigated was 19 hectares). With the SRI method, the
planting intensity for the first and second planting
seasons can be increased, while in the third planting
season, the planting intensity cannot be increased, but
the available water discharge is enough to irrigate the
entire existing land area (54.9 hectares). For the first
and second planting seasons, each planting intensity
0
20
40
60
80
100
120
140
160
I II III I II III I II III I II III I II III I II III I II III I II III I II III I II III I II III I II III
Nov Dec Jan Feb Mar Apr May Jun Jul Aug Sep Oct
Discharge (Liters/second)
Availability
Requirement
0
20
40
60
80
100
120
140
160
I II III I II III I II III I II III I II III I II III I II III I II III I II III I II III I II III I II III
Nov Dec Jan Feb Mar Apr May Jun Jul Aug Sep Oct
Discharge(Liters/second)
Availability
Requirement
iCAST-ES 2021 - International Conference on Applied Science and Technology on Engineering Science
746

can be increased by 155.8% (the area of rice field that
can be irrigated is 85.5 hectares).
ACKNOWLEDGEMENTS
The leading author of this paper would like to thank
to State Polytechnic of Kupang as a sponsor of the
author's research through the State Polytechnic of
Kupang DIPA fund.
REFERENCES
Doorenbos J & Pruitt W. O. (1977). Guidelines for
predicting crop water requirements. Rome, Italy: FAO
irrigation and Drainage Paper, Food and Agriculture
Organization of The United Nations.
Fuadi N. A., Purwanto2 M. Y. J., Tarigan S. D. (2016).
Kajian kebutuhan air dan produktivitas air padi sawah
dengan sistem pemberian air secara SRI dan
konvensional menggunakan irigasi pipa. Jurnal Irigasi,
Vol. 11(1), 23-32.
Hidayat YR & Suciaty T. (2019). The comparison analysis
of farming income between system of rice
intensification (SRI) technology innovation and
conventional agriculture, IOP Conf. Series: Journal of
Physics: Conf. Series 1360 (2019).
Kementerian Pertanian. (2014). Pedoman teknis
pengembangan system of rice intensification TA. 2014.
Jakarta: Direktorat Perluasan dan Pengelolaan Lahan
Direktorat Jenderal Prasarana dan Sarana Pertanian
Kementerian Pertanian.
Kementerian Pekerjaan Umum. (2013). Kriteria
perencanaan: Bagian perencanaan jaringan irigasi
KP-01. Jakarta: Direktorat Jenderal Sumberdaya Air,
Direktorat Irigasi dan Rawa.
Nuri R. (1985). Geografi budaya dalam wilayah
pembangunan Nusa Tenggara Timur. Jakarta:
Departemen Pendidikan dan Kebudayaan Direktorat
Sejarah dan Nilai Tradisional Proyek Inventarisasi dan
Dokumentasi Kebudayaan Daerah.
Puteriana S. A., Harisuseno D., Prayogo T. Budi. (2016).
Kajian sistem pemberian air irigasi metode
konvensional dan metode sri (System of rice
intensification) pada daerah irigasi pakis Kecamatan
Pakis Kabupaten Malang. Jurnal Teknik Pengairan,
7(2), 236-247
Ravichandran VK., Nayar V., Prakas KC. (2016). An
evaluation of the SRI on increasing yield, water
productivity and profitability: Experiences from TN-
IAMWARM project. Journal of Irrigate Drainage Sys
Eng, 4, 2.
Rozen N & Kasim. (2018). Teknik budidaya tanaman padi
metode sri (The system of rice intensification). Depok:
PT Raja Grafindo Persada.
Optimization of Irrigation Water using System of Rice Intensification (SRI) Method in the Kereloko Irrigation Area West Sumba Regency
747
