
Decision Support Systems for Employee Performance Assessment
Darius Shyafary
1
, Wahyuni Eka Sari
2
, Dwi Cahyadi
1
and Rony H.
1
1
Department of Design, Politeknik Negeri Samarinda, Samarinda, Indonesia
2
Department of Information Technology, Politeknik Negeri Samarinda, Samarinda, Indonesia
Keywords: Employee, Performance, SAW, Profile, Matching, Decision.
Abstract: Quality employees are an essential resource in a company. Employees who have qualification standards that
match the company's profile cause company productivity increased. PT. Pertamina (Persero) is one of the
state companies that manage the oil and gas sector in Indonesia, which maintains the quality of its employees.
PT. Pertamina always considers discipline, health, safety, and employee performance. Employee Performance
Assessment is needed to maintain the quality and profile of the company. Employee performance assessment
using the decision support systems method is Simple Additive Weighting (SAW) and Profile Matching (PM)
can be suitable for assessing employees. It can reduce errors in determining the best employees and obtain a
fair decision. In this study, a comparison between SAW and PM was built to find the best method. The SAW
and PM methods were chosen because they are not complicated in calculations and are suitable for small data.
The results showed that the accuracy of PM was 73% compared to SAW was 46%.
1 INTRODUCTION
Business industries are faced with changing dynamics
to compete with technological advances. Creating
organizational excellence in the company through
employee development is one of the best steps to deal
with today (Chiu et al., 2021) (Bezdrob & Šunje,
2021) (Lei et al., 2021). Employees who have
standards following the company's qualifications, the
company's productivity will indeed be maintained
and increase. Employee performance assessment is
one of the most efficient development, motivation,
and evaluation methods in a company. A performance
assessment system is used to measure the
effectiveness and efficiency of employees (Islami et
al., 2018).
PT Pertamina is one of the state companies with
an important sector, managing oil and gas in
Indonesia. Discipline, Health, safety, and
Performance of employees are always be prioritized
in PT. Pertamina. An employee performance
assessment needs to upgrade and maintain the quality
and profile of the company. In order to support this,
it is necessary to evaluate the quality of employees by
using a decision support system. Employee
performance assessment is a human resource
management activity in a company which is an
essential point in terms of the sustainability of a
company.
One of the leading values of PT. Pertamina is
"Capable," which means it is managed by
professional, skilled, and highly qualified leaders and
workers and is committed to building research and
development capabilities. Employees with these
criteria can improve the quality of the company that
must be appropriately managed. Human Resources
management is a determining aspect of the company's
success. Employee performance assessment is
collected subjectively. The problem for companies in
selecting the best employees is in the subjective and
manual assessment. Companies are challenging to
determine the employees with a good qualification in
a measurable. So this problem can be solved by
building a Decision Support System (Komsiyah et al.,
2019).
The simple Additive Weighting (SAW) method
and Profile Matching were used in this study. The
SAW method was chosen because it is able to select
the best alternative based on the specified criteria
(Roszkowska & Kacprzak, 2016). Research using the
SAW method includes determining the best
ambulance location (Abdullah et al., 2018) and the
best cornfield location (Seyedmohammadi et al.,
2018). The Profile Matching method is the most
appropriate method used in the process of comparing
individual competencies into the competencies of a
position so that differences in competencies can be
known. The initial process is carried out by
determining the aspects and sub-aspects, as well as
766
Shyafary, D., Sari, W., Cahyadi, D. and H., R.
Decision Support Systems for Employee Performance Assessment.
DOI: 10.5220/0010953200003260
In Proceedings of the 4th International Conference on Applied Science and Technology on Engineering Science (iCAST-ES 2021), pages 766-773
ISBN: 978-989-758-615-6; ISSN: 2975-8246
Copyright
c
2023 by SCITEPRESS – Science and Technology Publications, Lda. Under CC license (CC BY-NC-ND 4.0)

finding the weight value for each sub-aspect, looking
for the gap between the profile and data from the
employee (Rahim, 2017) (Atmanegara et al., 2017).
Several studies with profile matching are for the
position placement of employees (Dhammayanti et
al., 2019), selection of new employees (Sunarti et al.,
2017), and employee performance assessment
(Safrizal et al., 2019)
2 THEORETICAL REVIEW
In this study, two methods are used. Simple Additive
Weighting (SAW) and Profile Matching (PM). There
are eight steps calculating for the SAW method and
seven steps for the Profile Matching method.
2.1 Simple Additive Weighting (SAW)
The step by step SAW (Abdullah et al., 2018) method
calculating are:
1. Determine alternatives.
2. Determine the criteria that will be used as a
reference in making decisions.
3. Converting alternative values into the value of
the match rating on each criterion.
4. Determine the weight of preference or level of
importance (W) of each criterion W=[ W_1
W_2 W_3….W_j]
5. Make a decision matrix X which is formed from
the suitability rating table of each alternative on
each criterion.
6. Normalize the decision matrix by calculating the
value of the normalized performance rating r_ij
from alternative A_i on criteria C_j.
𝑟
⎩
⎪
⎨
⎪
⎧
𝑥
𝑚𝑎𝑥
𝑥
𝑖𝑓 𝑗 𝑖𝑠 𝑏𝑒𝑛𝑒𝑓𝑖𝑡
𝑚𝑖𝑛
𝑥
𝑥
𝑖𝑓 𝑗 𝑖𝑠 𝑐𝑜𝑠𝑡
(1)
7. The results of the normalized performance
rating form a normalized matrix (R)
𝑅
𝑟
𝑟
… 𝑟
𝑟
𝑟
…𝑟
(2)
The final result of the preference value is obtained
from the sum of the normalized matrix row elements
(R) with the preference weights (W) corresponding to
the matrix column elements (W). The results of the
calculation if the Preference value of the larger
alternative identifies that the alternative is the best
alternative.
2.2 Profile Matching
Profile matching started with defining the minimum
value for each assessment variable. The difference
between each test data value against the minimum
value of each variable is a gap. Then the gap is
weighted. The weight of each variable will be
calculated on average based on the Core Factor (CF)
and Secondary Factor (SF) variable groups. The
composition of CF plus SF is 100%, depending on the
interests of the user of this method. The last stage of
this method is accumulating CF and SF values based
on the values of the testing data variables
(Dhammayanti et al., 2019), (Tharo & Utama
Siahaan, 2016). The smaller the gap produced by the
weight of significant value, the greater opportunity
for employees was occupying these positions (Sunarti
et al., 2017). The competency assessment system will
describe the achievements and potential of human
resources by their work units. Employee achievement
and competence can be a measure of employee
success in completing work.
The weighting of the Profile Matching method is
a definite value that is firm on a certain value because
the existing values are members of the crisp set. In a
crisp set, the membership of an element in the set is
stated explicitly, whether the object is a member of
the set or not, by using a characteristic function.
The steps for the profile matching method are:
1. Determine the required data variables.
2. Determine the aspects used for the assessment.
3. Gap profile mapping.
With the formula:
𝐺𝑎𝑝 𝐶𝑟𝑖𝑡𝑒𝑟𝑖𝑎𝑎𝑠𝑝𝑒𝑐𝑡𝑣𝑎𝑙𝑢𝑒 – 𝑇𝑎𝑟𝑔𝑒𝑡 𝑣𝑎𝑙𝑢𝑒
(3)
4. After obtaining the Gap value, then the weight
is given to each Gap value.
5. Calculation and grouping of Core Factor and
Secondary Factor. After determining the weight
of the gap value, then they are grouped into two
groups, namely:
Core Factor, which is the most important
or prominent or most needed criteria
(competence) by an assessment that is
expected to obtain optimal results.
𝑁𝐶𝐹
∑
𝑁𝐶
∑
𝐼𝐶
(4)
Information:
NFC : Average core factor
NC : Total value of core factor
IC : Number of the items core factor
Secondary Factors (Supporting Factors)
are items other than aspects that exist in the
Decision Support Systems for Employee Performance Assessment
767

core factor. To calculate the secondary
factor, the formula is used.
𝑁𝑆𝐹
∑
𝑁𝑆
∑
𝐼𝑆
(5)
Information:
NFS : Average secondary factor
NS : Total value of secondary factor
IS : Number of secondary factor items
6. Calculation of Total Value. Total value is
obtained from the percentage of core factors and
secondary factors that are estimated to affect the
results of each profile.
𝑁 𝑥 % 𝑁𝐶𝐹 𝑥 % 𝑁𝑆𝐹
(6)
Information:
N : Total score of criteria
NFS : Average secondary factor
NFC : Average core factor
(x) % : Entered percent value
7. Calculation of ranking determination. The final
result of the profile matching process is ranking.
Determination of ranking refers to the results of
certain calculations.
𝑅𝑎𝑛𝑘𝑖𝑛𝑔 𝑥 % 𝑁𝑀𝐴 𝑥 % 𝑁𝑆𝐴
(7)
Information:
NMA : Total score of Main Aspect criteria
NSA : Total score of Supporting Aspect criteria
(x) % : Entered percent value.
3 METHODOLOGY
Section 3 describes the design of the proposed
method and the steps to be completed. There are 4
criteria that influence employee performance
assessment. The alternatives used in the study were
15 employees.
3.1 Design Method
The study was designed to compare the output of the
use of the SAW and PM methods. It is measured
based on the results of alternative rankings. In the
SAW and PM methods, the criteria, alternatives, and
initial weights are prepared in advance, and then all
are presented in the form of a normalized matrix.
Furthermore, the normalized matrix can be processed
using SAW and PM methods. The design method of
this study is presented in Figure 1.
Figure 1: Design Method.
3.2 Criteria
In Table 1, the weight value of the criteria is based on
guidelines from the HRD of PT. Pertamina. The
greatest weight to the criteria of job security. The
lowest value weight is for the active criteria. In Table
2, the assessment uses a Likert scale between 1 – 5
for each choice. Safety criteria are compliance in
applying Safety operational standards during work.
Performance criteria are the ability of employees to
carry out their duties and awards achieved.
Achievement can be measured from discipline,
problem-solving ability, and the resulting product for
the company. Health criteria are the health condition
of employees for a certain period. Health conditions
include regular medical check-ups. Participation
criteria are the activeness of employees in responding
to a problem. Participation includes roles in
discussions, obeying orders from higher
management, and cooperating with the team.
iCAST-ES 2021 - International Conference on Applied Science and Technology on Engineering Science
768

Table 1: Alternative.
Table 2: Criteria.
Criteria Weight Type Scale Values
Safety 0,3 Benefit
Excellent
Good
Fair
Poor
Very
poo
r
5
4
3
2
1
Performance 0,25 Benefit
Excellent
Good
Fair
Poor
Very
poo
r
5
4
3
2
1
Health 0,25 Benefit
Excellent
Good
Fair
Poor
Very
poo
r
5
4
3
2
1
Participation 0,2 Benefit
Excellent
Good
Fair
Poor
Very
poo
r
5
4
3
2
1
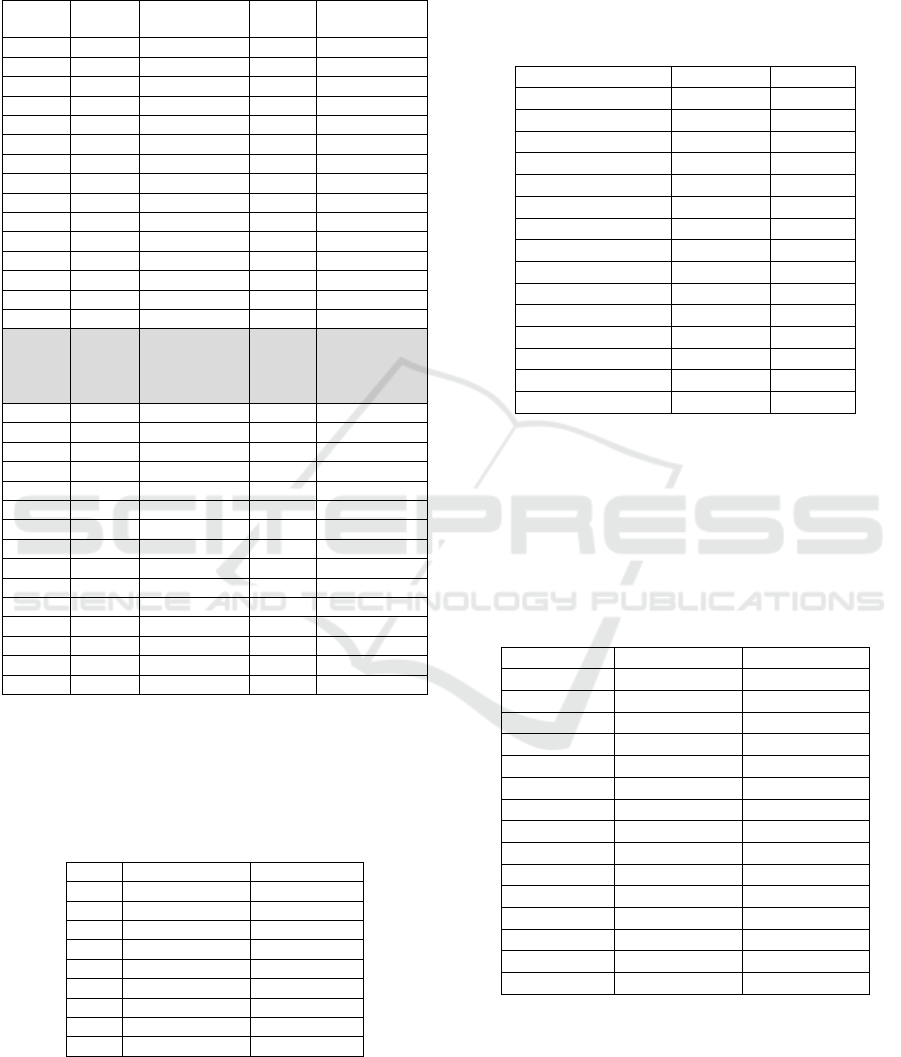
3.3 Alternative
The alternative used is permanent employees at PT
Pertamina RU V Balikpapan. In this study, fifteen
alternative data were used. Alternative data are
presented in Table 2. Employee assessment is carried
out on employees with a tenure of more than five
years and a minimum position of Officer Head.
4 RESULT AND DISCUSSION
Section 4 contains the steps of the calculation Profile
Matching, SAW, and data testing. The selected test is
to calculate the accuracy of the method compared
with the selection results manually.
4.1 Simple Additive Weighting
The criteria and alternative data have been defined
based on Tables 1 and 2, so the next step is to
normalize the matrix. The step is to calculate the
value of the normalized performance rating 𝑟_𝑖𝑗 from
the alternative 𝐴_𝑖 on the criteria 𝐶_𝑗. If it is a benefit
criterion, then the value of 𝑥_𝑖𝑗 is divided by the value
of Max 𝑥_𝑖𝑗 from each column, while the criteria are
No Name Department Position Safety
Performanc
e
Health
Participatio
n
1 SR Equipment Overhaul Section Head EO Goo
d
Poor Goo
d
Fai
r
2 IS MA 3 Supervisor
Instrument
Good Fair Poor Fair
3 ABW HSC Shift Supervisor
Distill
Good Fair Fair Poor
4 AI Workshop Section Head
Workshop
Fair Good Poor Fair
5 NH HC Business Partner Officer II HC
Business Partne
r
Fair Good Poor Fair
6 BD Marine Region VI Assistance
Manager Plan
Fair Good Poor Good
7 L
K
Marine Region VI Officer PQC Fai
r
Goo
d
Fai
r
Poo
r
8 DW Project Engineering Sr Supervisor
Cost. Eng
Good Good Fair Poor
9 SH Laboratory Supervisor
Quality', N'Eng
Fair Poor Fair Fair
10 YM Laboratory Shift Supervisor
CONAL Gas',
N'Eng
Fair Fair Fair Fair
11 KM Laboratory Shift Supervisor
CONAL Gas
Fair Good Good Fair
12 IS Dis & Wax Section Head Dis
& Wax
Fair Fair Good Good
13 DEP General Maintenance Supervisor Elect
& Ins
t
Excellent Good Fair Good
14 BK Oil Movement Shift Supervisor
North Tank Farm
Fair Good Good Good
15 AF Dis & Wax Sr Supervisor
EWTP/DHP
Good Good Fair Fair
Decision Support Systems for Employee Performance Assessment
769

cost, the Min value of 𝑥_𝑖𝑗 from each column is
divided by the value of 𝑥_𝑖𝑗.
Table 3: Normalization Matrix.
Alt
Criteria
Safety Performance Health
Participatio
n
SR 0.80 0.50 1.00 0.75
IS 0.80 0.75 0.50 0.75
ABW 0.80 0.75 0.75 0.50
AI 0.60 1.00 0.50 0.75
NH 0.60 1.00 0.50 0.75
BD 0.60 1.00 0.50 1.00
L
K
0.60 1.00 0.75 0.50
DW 0.80 1.00 0.75 0.50
SH 0.60 0.50 0.75 0.75
YM 0.60 0.75 0.75 0.75
KM 0.60 1.00 0.50 0.75
IS 0.60 0.75 1.00 1.00
DEP 1.00 1.00 0.75 1.00
B
K
0.60 1.00 1.00 1.00
AF 0.80 1.00 0.75 0.75
The normalized matrix based on Table 3 is
multiplied by the weight criteria in Table 1 to get the
preference value. Furthermore, the final result or the
total preference value is obtained from the sum of the
normalized matrix row elements (R) and the weights.
The following Table 4 is the total preference value
and the ranking order based on the largest preference
value for each alternative.
Table 4: Preferences Value of Alternative.
No Alternative Preference Value Rank
1 SR 0.770 6
2 IS 0.700 14
3 ABW 0.720 9
4 AI 0.712 12
5 NH 0.714 11
6 BD 0.760 7
7 L
K
0.722 8
8 DW 0.780 5
9 SH 0.640 15
10 YM 0.710 13
11 KM 0.715 10
12 IS 0.820 4
13 DEP 0.940 1
14 B
K
0.880 2
15 AF 0.830 3
In Table 4, preference values based on the
calculation of the Simple Additive Weighting method
shown that Alternative 13 is ranked 1 with a value of
0.94, Alternative 14 is ranked 2 with a value of 0.88,
and Alternative 15 is ranked 3 with a value of 0.83,
and the following ranking with the preference value
of each employee.
4.2 Profile Matching
In the employee performance assessment calculation
using the profile matching method, the assessment
criteria are first defined. Assessment criteria contain
information about each variable's weight and type of
factor for each variable—the following Table 5 shows
information about the criteria.
Table 5: Assessment Criteria.
Criteria Wei
g
ht T
yp
e
C1 Safet
y
30% Core Facto
r
C2 Performance 45% Core Facto
r
C3 Health 45% Secondary Facto
r
C4 Partici
p
ation 20% Secondar
y
Facto
r
There are two variables as core factors are Safety
and Performance. Two other variables as secondary
factors are Health and Participation. The weights for
each criterion have been presented in Table 5. The
Competency Standards used are 5 for Safety, 4 for
Performance, 4 for Health, 4 for Participation.
Aspects of the assessment criteria are defined as Very
Good equal to 5, Good equal to 4, Neutral equal to 3,
Poor equal to 2, Very Poor equal to 1. The following
in Table 6 describes the aspects of employee
assessment
Table 6: Aspects of Employee Assessment.
Alt
Safety
(C1)
Performance
(C2)
Health
(C3)
Participation
(C4)
SR 4 2 4 3
IS 4 3 2 3
ABW 4 3 3 2
AI 3 4 2 3
NH 3 4 2 3
BD 3 4 2 4
L
K
34 3 2
DW 4 4 3 2
SH 3 2 3 3
YM 3 3 3 3
KM 3 4 2 3
IS 3 3 4 4
DEP 5 4 3 4
B
K
34 4 4
AF 4 4 3 3
Based on the data on the aspect of the criterion
value, it can be seen that the ideal criterion is the Gap
value. The gap value is obtained from the standard
competency value, subtracted from each value aspect,
then the calculation of the gap value will be obtained
as shown in Table 7. The step to calculate the GAP
value is the standard competency value reduced by
the value of each criterion. For example, the
alternative SR has a GAP value of -1. This is because
SR has a safety value of 4-5, so that a value of -1 is
iCAST-ES 2021 - International Conference on Applied Science and Technology on Engineering Science
770
obtained. GAP calculations were carried out for all
alternatives against 4 criteria.
Table 7: Gap Value.
Alt Safety
(K1)
Performanc
e (K2)
Healt
h (k3)
Participatio
n (K4)
SR 4 2 4 3
IS 4 3 2 3
ABW 4 3 3 2
AI 3 4 2 3
NH 3 4 2 3
BD 3 4 2 4
L
K
3 4 3 2
DW 4 4 3 2
SH 3 2 3 3
YM 3 3 3 3
KM 3 4 2 3
IS 3 3 4 4
DEP 5 4 3 4
B
K
3 4 4 4
AF 4 4 3 3
Comp
etency
Stand
ard
5 4 4 4
SR -1 -2 0 -1
IS -1 -1 -2 -1
ABW -1 -1 -1 -2
AI -2 0 -2 -1
NH -2 0 -2 -1
BD -2 0 -2 0
L
K
-2 0 -1 -2
DW -1 0 -1 -2
SH -2 -2 -1 -1
YM -2 -1 -1 -1
KM -2 0 -2 -1
IS -2 -1 0 0
DEP 0 0 -1 0
B
K
-2 0 0 0
AF -1 0 -1 -1
After obtaining the Gap value for each criterion,
each employee's profile is assigned a weight value by
matching the Gap. The weight value based on PM
Method as shown as in Table 8.
Table 8: Weight Value for Gap.
No Gap Weight
1 4 5
2 3 4,5
3 2 4
4 1 3,5
5 0 3
6 -1 2,5
7 -2 2
8 -3 1,5
9 -4 1
The weight value based on the gap has been
obtained based on the guidelines from Table 8
(Dhammayanti et al., 2019). The next step is to
calculate the NCF and NSF values. NCF and NSF
calculation steps are based on formulas 4 and 5. Gap
values for all alternatives are based on Table 7. The
results of NCF and NSF calculations can be seen in
Table 9.
Table 9: NCF and NSF Value.
Alternative NCF NSF
SR
2,25 2,75
IS
2,5 2,25
ABW
2,5 2,25
AI
2,5 2,25
NH
2,5 2,25
BD
2,5 2,5
LK
2,5 2,25
DW
2,75 2,25
SH
2 2,5
YM
2,25 2,5
KM
2,5 2,25
IS
2,25 3
DEP
3 2,75
BK
2,5 3
AF
2,75 2,5
NCF and NSF values are obtained for each
alternative. The next step is to calculate the total
value. The results of calculating the total weight and
ranking for the Profile Matching method are
presented in Table 10. The formula to calculate the
total value is based on Formula 6, and to get the
ranking value is based on Formula 7.
Table 10: Total Value and Rank.
Alternative Total Rank
SR
2,4750 7
IS
2,3871 10
ABW
2,3873 9
AI
2,3870 11
NH
2,3869 12
BD
2,5000 6
LK
2,3866 13
DW
2,5250 5
SH
2,2250 15
YM
2,3625 14
KM
2,3875 8
IS
2,5875 4
DEP
2,8875 1
BK
2,7250 2
AF
2,6375 3
Based on the calculation of the Profile Matching
method, it was found that Alternative 13 was ranked
1 with a total value is 2.8875, Alternative 14 was
ranked 2 with a total value is 2.725, and Alternative
15 was ranked 3 with a total value is 2.6375, as well
as other rankings with a value of each employee. The
Decision Support Systems for Employee Performance Assessment
771
highest-ranking is based on the most significant total
value. All data can be seen in Table 10.
4.3 Discussion
The accuracy between the SAW and PM methods is
influenced by many factors. It can be caused by the
conversion of scale values which can affect the
difference in the ranking results and the far accuracy
results between the two methods. The completion
stage in PM is more effectively used in terms of
determining the best employees at PT Pertamina RU
V Balikpapan, compared to SAW. This can be seen
from the results of testing the method with data in the
field. The accuracy value of the PM method is higher
than the SAW method. In some conditions that
require accuracy of results, it is necessary to focus on
the final total score obtained, not only focus on
ranking. In more significant cases, other methods or
algorithms can be used so that the input value can
match the real conditions.
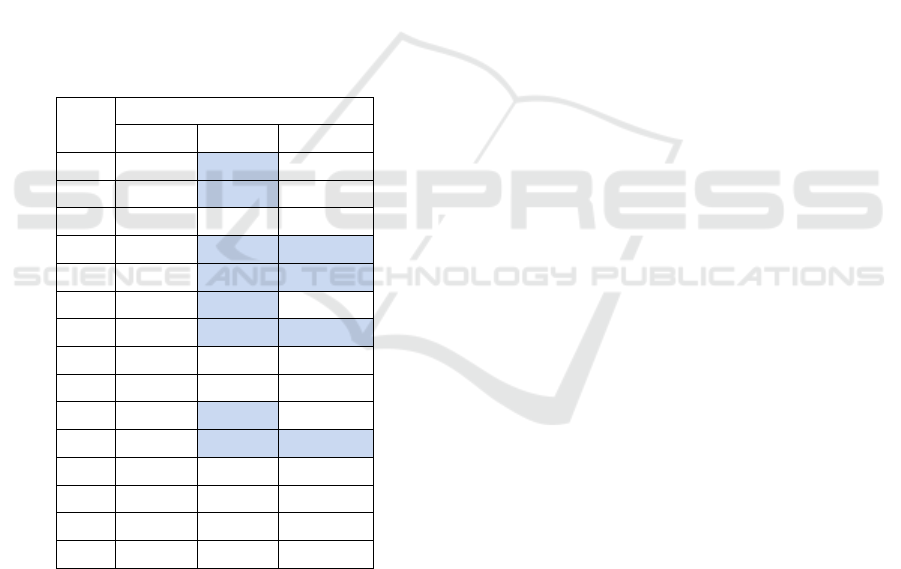
Table 11: Results of SAW and PM Method.
Alt
Results
Manual SAW
PM
SR
7
6
7
IS
10
14
10
ABW
9
9
9
AI
8
12
11
NH
13
11
12
BD
6
7
6
LK
12
8
13
DW
5
5
5
SH
15
15
15
YM
14
13
14
KM
11
10
8
IS
4
4
4
DEP
1
1
1
BK
2
2
2
AF
3
3
3
The accuracy is made by comparing the
calculation of manual data with the proposed method.
SAW method obtained conformity with the manual
data is 7 data. In contrast to SAW, for the PM method,
the similarity with the original data is 11 data. Based
on the similarity of data, the accuracy of the SAW
method is 46%, and PM is 73%. The test results are
described in Table 11. The coloured line indicates that
there is a discrepancy in the calculation results.
5 CONCLUSIONS
The decision support system was successfully
designed to select the best employees at PT Pertamina
RU V Balikpapan by applying the Simple Additive
Weighting and Profile Matching methods. Based on
the results of manual and system tests, the results
show that the SAW ranking method provides an
accuracy of 46% and the PM ranking method shows
an accuracy of 73%. In the cases of the best
employees at PT Pertamina RU V Balikpapan, the
Profile Matching method is more effectively used
because the method test provides a greater level of
accuracy than the Simple Additive Weighting
method. Providing criteria by combining methods
and machine learning such as naive Bayes or fuzzy in
the data analysis process so that the results obtained
are more accurate. The decision support system is
expected to be developed online so that employees
can access the calculation results in a transparent
assessment.
ACKNOWLEDGEMENTS
The collected data was obtained from PT. Pertamina
RU V Balikpapan, Indonesia.
REFERENCES
Abdullah, L., Adawiyah, C. W. R., & Kamal, C. W. (2018).
A decision-making method based on interval type-2
fuzzy sets: An approach for ambulance location
preference. Applied Computing and Informatics, 14(1),
65–72. https://doi.org/10.1016/j.aci.2017.04.003
Atmanegara, F. D. S., Putri, R. R. M., & Sutrisno. (2017).
Implementasi Metode Profile Matching untuk Seleksi
Penerimaan Anggota Asisten Praktikum ( Studi Kasus :
Laboratorium Pembelajaran Kelompok Praktikum
Basis Data FILKOM ). Jurnal Pengembangan
Teknologi Informasi Dan Ilmu Komputer, 1(12), 1804–
1812.
Bezdrob, M., & Šunje, A. (2021). Transient nature of the
employees' job satisfaction: The case of the IT industry
in Bosnia and Herzegovina. European Research on
Management and Business Economics, 27(2).
https://doi.org/10.1016/j.iedeen.2020.100141
Chiu, Y. Te, Zhu, Y. Q., & Corbett, J. (2021). In the hearts
and minds of employees: A model of pre-adoptive
appraisal toward artificial intelligence in organizations.
International Journal of Information Management,
60(June), 102379. https://doi.org/10.1016/j.ijinfomgt.
2021.102379
Dhammayanti, K., Wicaksana, A., & Hansun, S. (2019).
Position placement dss using profile matching and
iCAST-ES 2021 - International Conference on Applied Science and Technology on Engineering Science
772

analytical hierarchy process. International Journal of
Scientific and Technology Research, 8(11), 204–207.
Islami, X., Mulolli, E., & Mustafa, N. (2018). Using
Management by Objectives as a performance appraisal
tool for employee satisfaction. Future Business
Journal, 4(1), 94–108. https://doi.org/10.1016/j.fbj.
2018.01.001
Komsiyah, S., Wongso, R., & Pratiwi, S. W. (2019).
Applications of the fuzzy ELECTRE method for
decision support systems of cement vendor selection.
Procedia Computer Science, 157, 479–488.
https://doi.org/10.1016/j.procs.2019.09.003
Lei, C., Hossain, M. S., Mostafiz, M. I., & Khalifa, G. S. A.
(2021). Factors determining employee career success in
the Chinese hotel industry: A perspective of Job-
Demand Resources theory. Journal of Hospitality and
Tourism Management, 48(September 2020), 301–311.
https://doi.org/10.1016/j.jhtm.2021.07.001
Rahim, R. (2017). A Study Approach of Decision Support
System with Profile Matching. International Journal of
Recent Trends in Engineering and Research, 3(2), 31–
44. https://doi.org/10.23883/ijrter.2017.3001.zl93n
Roszkowska, E., & Kacprzak, D. (2016). The fuzzy saw
and fuzzy TOPSIS procedures are based on ordered
fuzzy numbers. Information Sciences, 369, 564–584.
https://doi.org/10.1016/j.ins.2016.07.044
Safrizal, Tanti, L., Puspasari, R., & Triandi, B. (2019).
Employee Performance Assessment with Profile
Matching Method. 2018 6th International Conference
on Cyber and IT Service Management, CITSM 2018,
Citsm, 1–6. https://doi.org/10.1109/CITSM.2018.
8674256
Seyedmohammadi, J., Sarmadian, F., Jafarzadeh, A. A.,
Ghorbani, M. A., & Shahbazi, F. (2018). Application of
SAW, TOPSIS, and fuzzy TOPSIS models in
cultivation priority planning for maize, rapeseed, and
soybean crops. Geoderma, 310(September 2017), 178–
190. https://doi.org/10.1016/j.geoderma.2017.09.012
Sunarti, S., Rangga, R. Y., & Marlim, Y. N. (2017).
Application Profile Matching Method for Employees
Online Recruitment. IOP Conference Series: Earth and
Environmental Science, 97(1). https://doi.org/10.1088/
1755-1315/97/1/012035
Tharo, Z., & Utama Siahaan, A. P. (2016). Profile Matching
in Solving Rank Problem. IOSR Journal of Electronics
and Communication Engineering, 11(05), 73–76.
https://doi.org/10.9790/2834-1105017376
Decision Support Systems for Employee Performance Assessment
773
