
Clean Water Supply Policy to Support Tourism Activities
in Gianyar Regency
I Gusti Lanang Made Parwita
1
, Made Mudhina
1
, I Wayan Wiraga
1
,
I G. B. Sila Dharma
2
, Mawiti Inftri Yekti
2
and I Putu Gustave Sryantara
2
1
Civil Department, Polytechnic State of Bali, Jimbaran, Bali, Indonesia
2
Civil Department, Udayana University, Jimbaran, Bali, Indonesia
Keywords: Clean Water, Water Potential, Water Balance, Tourism, Water Fulfillment.
Abstract: Gianyar is one of the districts with the most tourist visits in the Province of Bali. In this area there are several
tourism objects that are well known throughout the world with the center of development in the Ubud area.
Tourist visits based on the strategic study of the Gianyar Regency tourism office in 2018 amounted to 4.3
million people with an estimated water need of 71.94 liters/second. The development of tourism causes an
increase in the need for water provided in the future. Water provided for various purposes such as hotels,
villas, restaurants and other tourist facilities the tourism sector has a big influence on the regional income of
Gianyar Regency so that the Gianyar Regency Government carries out various efforts to develop facilities
continuously. One important issue that needs careful attention is a reliable clean water supply system in terms
of quantity, quality and continuity. At this time the largest use of water in Gianyar Regency is used for
agricultural activities, especially irrigation for rice plants. The problem in this research is the strategy of
meeting the increasing demand for clean water in Gianyar Regency which is caused by the growing population
and tourism sector by utilizing the potential of rivers and deep wells that can be developed.Furthermore, water
users that are quite large are the use of domestic water for the community and non-domestic water, especially
for tourism. Based on the analysis, in 2020 the shortage of clean water is 298.27 liters/second and it is
estimated that in 2030 the shortage of clean water is 398.88 liters/second. This research was conducted using
the method of inventorying water resources, analyzing water needs, fulfillment systems, infrastructure and
policies from the Gianyar district government. Currently, the main source of water from the regional drinking
water company in Gianyar Regency is ground water and from springs taken upstream in the Tampaksiring
area. On the other hand, water sources in the form of river water are still widely available and have not been
utilized optimally in the downstream. The purpose of this study is to determine a strategy for fulfilling water
in Gianyar Regency by utilizing the current potential either through rivers or groundwater by making deep
wells. The fulfillment of water in the future can be done by utilizing water downstream of the river with a
very large potential, namely 25.55 m
3
/second and with the construction of deep wells in the southern region.
1 INTRODUCTION
The tourism sector is one of the leading sectors of the
Gianyar Regency Government to obtain regional
income in addition to other sectors such as agriculture
and trade (Gianyar Regency, 2018) (Sudarmini, Sri
Widari and Sukartini, 2017). This sector has a great
influence in absorbing labor and has an effect on other
sectors. Gianyar with the Ubud tourism area has
become an icon of world tourism that brings in both
domestic and foreign tourists (Suhendra, Agung and
Maba, 2019). In an effort to increase the
competitiveness of the tourism sector in Gianyar
Regency, various arrangements related to facilities
and infrastructure have been carried out, one of which
is through a sustainable clean water supply system in
coordination with other agencies. The clean water
supply system concerns water potential, water
availability and its development system.
In general, non-domestic water needs are
calculated based on domestic water needs which
range from 20-25 percent, but in some cases this
amount can be exceeded due to very high non-
domestic needs. Under these conditions, careful
mapping is needed regarding the potential that can be
utilized and a tourism development system based on
Parwita, I., Mudhina, M., Wiraga, I., Dharma, I., Yekti, M. and Sryantara, I.
Clean Water Supply Policy to Support Tourism Activities in Gianyar Regency.
DOI: 10.5220/0010956400003260
In Proceedings of the 4th International Conference on Applied Science and Technology on Engineering Science (iCAST-ES 2021), pages 901-907
ISBN: 978-989-758-615-6; ISSN: 2975-8246
Copyright
c
2023 by SCITEPRESS – Science and Technology Publications, Lda. Under CC license (CC BY-NC-ND 4.0)
901
a balanced tourism development system by taking
into account the existing carrying capacity.
The growing population and the development of
the tourism sector require an increase in the amount
of water in the future. Preliminary studies that have
been carried out show that up to now there is a large
water potential with a total discharge of 25.55 m
3
/sec
in five rivers in the southern part of Gianyar is very
potential to be developed as raw water. In addition,
the alternative of making deep wells can be one
solution in increasing the amount of water needed.
With this condition, it is very necessary to conduct an
analysis of the clean water supply policy in Gianyar
regency to support tourism activities as a leading
sector.
2 METHOD
The research was conducted by collecting primary
data in the form of instantaneous discharge
measurements carried out on five rivers. Secondary
data was obtained from the recognized institutions,
namely the regional water supply company, the Bali
Penida River Council and from the Central Statistics
Agency. From the data collected, an analysis is
carried out to determine the existing water potential,
water needs for the community and water needs for
tourism and water loss during distribution. Based on
the calculation data, it is found that the availability of
water and the demand for it are the basis for the water
management policy in Gianyar Regency. The
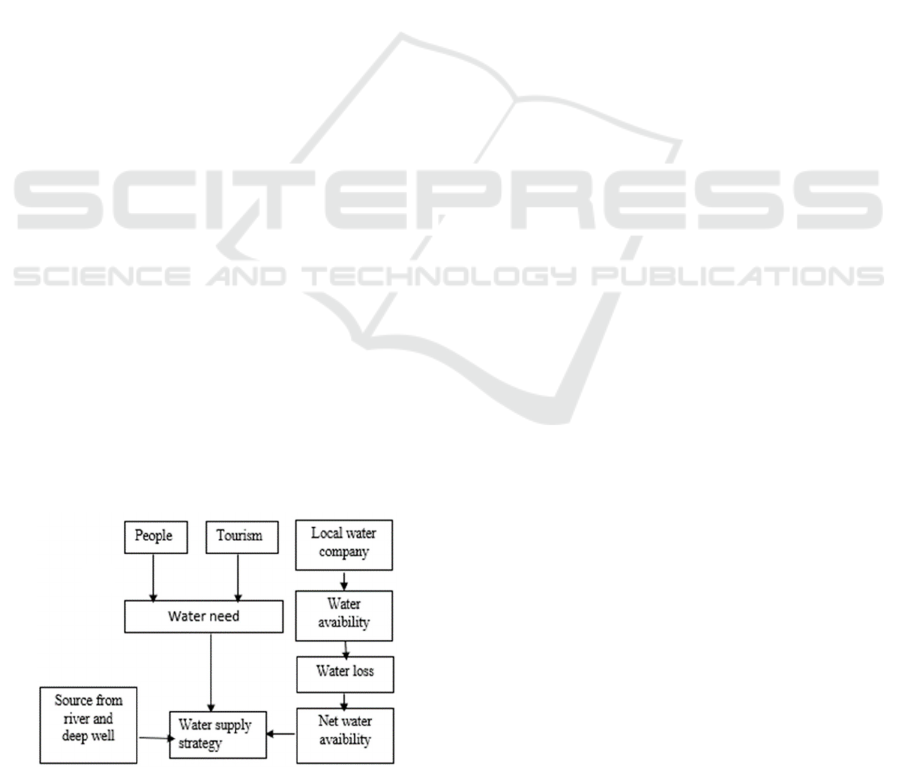
research workflow is more clearly shown in Figure 1
below
The proposed hypothesis is that the increase in
the need for clean water due to the development of the
population and the tourism sector can be met by
utilizing the potential of five rivers in the southern
part of Gianyar Regency and by developing deep
wells.
Figure 1: Research activity flow.
3 RESULTS AND DISCUSSION
3.1 Water Supply System
The clean water service system in Gianyar Regency
is divided into two groups, namely those organized by
the Regional Drinking Water Company and
organized by the community or often called rural
drinking water companies.
3.2 Water Resources
The sources of water used in the drinking water
supply system of the regional drinking water
company of Gianyar Regency are 55 water sources,
with details of 10 springs that use pumps, 3 springs
that use gravity, and 42 drilled wells. In general, it can
be seen that the water source used by the regional
drinking water company of Gianyar Regency is still
concentrated in the central region, while in the
southern part it is more dominant to use the drilled
well system. Utilization of water sources whose
distribution system uses the pump method is
generally evenly distributed in the northern region.
The use of this pump method tends to be caused by
the undulating topography of the area so that the
water distribution cannot use the gravity method. The
condition of topographic factors also has an impact
on the lack of use of the gravity method by regional
drinking water companies in Gianyar Regency.
The regional drinking water company in Gianyar
Regency utilizes two water treatment plants (WTP),
namely Bali Bangun Tirta.Ltd (BBT WTP) and the
Petanu Integrated Service Unit (PISU). The raw water
treatment is in collaboration with the private sector
and the Bali Provincial Government. Currently, the
available capacity for BBT WTP is 200 liters/second,
but that is utilized by regional drinking water
companies of 162.62 liters/second. On the other hand,
the PISU has an available capacity of 50 liters/second,
but the utilization is 14.92 liters/second. The BBT
WTP supplies water to the Gianyar Regency in eleven
zones, while the Petanu WTP supplies water to the
Gianyar, Badung and Denpasar areas.
Production efficiency is the real production
volume in m
3
compared to the installed capacity in
m3 owned by Gianyar regional water company. The
current source capacity is 784.44 liters/second or
24,399,532 m
3
with an installed capacity of 866.25
liters/second or 26,463,965 m3. With an installed
capacity of that size, it is only able to produce a real
production capacity of 743.72 liters/second or
23,391,194 m3. Thus, the production efficiency of
Gianyar Regional water is 88.39%. Source, installed
iCAST-ES 2021 - International Conference on Applied Science and Technology on Engineering Science
902

and production capacity of Gianyar Regional water
company can be seen in Table 1.
Table 1: The water source of the regional company of the
Ginayar district.
Source: Gianyar Regional Water Company, 2021
3.3 Water Quality Analysis
Sampling of water quality is carried out on several
rivers that have sufficient discharge downstream. The
rivers are Sangsang, Pakerisan, Melangit, Petanu and
Oos rivers. Water quality must comply with physical,
chemical and biological standards. In general, river
water quality still meets the requirements to be used
as raw water (WHO, 2017) (Murcott et al., 2015) (Gu
et al., 2014) . Several parameters seen in this water
quality test are physical (DHL, TSS, turbidity),
chemical (PH, KMNO
4
, BOD
5
, Zn) and bacteriology
(E-Coli). Herschy, 2012), (Sandiford et al., 1989),
The complete water quality test results are as follows:
1. Physical requirements (Physical Parameters)
In this case, it is obtained a further understanding of
the elements contained in the physical requirements
of raw water quality including Electrical
Conductivity (Conductivity), Turbidity (Turbidity),
Total Dissolved Solids (TSS: Total Suspended Solid)
a. DHL (Electrical Conductivity)
The result of the highest water quality test for DHL
(Electrical Conductivity) in the Tukad Melangit River
is 1,173 mg/ltr, exceeding the established
Environmental Quality Standard.
b. Turbidity
Normal turbidity in river water ranges from 0.01 to
20 Newton Total Units (NTU) equal to milligrams per
liter. The requirements in the Bali Governor
Regulation Number 16 of 2016 Environmental
Quality Standards stipulate the standard set for raw
water is 5 milligrams per liter, while if we look at the
Regulation of the Minister of Health of the Republic
of Indonesia Number 32/Menkes/Per/VI/2017
Environmental Health Quality Standards and
Requirements Water for Sanitation, set at 25
milligrams per liter. In the test results the Petanu and
Oos rivers have turbidity qualities of 43.3 and 29.6
milligrams/liter, both rivers from 5 (five) rivers in
Gianyar exceed the established Environmental
Quality Standards.
c. TSS (Total Suspended Solid) Total Suspended
Solids
The amount of dissolved solids can give an
unpleasant taste to the tongue, nausea caused by
sodium sulfate, magnesium sulfate and can cause
cardia disease toxemia in pregnant women. The value
indicated in the Environmental Quality Standard is
1000 milligrams per liter and all rivers in Gianyar
Regency are still far below the Environmental Quality
Standard.
2. Chemical Terms
Chemical substances dissolved in excessive drinking
water, apart from being toxic, can also damage
concrete materials, pipes, household appliances and
others. Therefore, it is necessary to limit the content
of chemical substances, including:
a. Degree of Acidity (pH) and Total Hardness (Total
hardness)
pH is a term used to express the intensity of the acidic
or basic state of a solution. In water supply, pH is one
of the factors that must be considered because the
degree of acidity of the water will greatly affect the
processing activities to be carried out, for example in
chemical coagulation, disinfection, softening of water
and in preventing corrosion.
As an environmental factor, the degree of acidity
is a very important factor because pH can affect the
growth of microbes in water. Most microbes will
grow well in a pH of 6.0 – 8.0, besides that pH will
also cause chemical changes in water. If the pH is
greater or less than that, it will cause corrosion in
water pipes made of hardness in water, most of which
comes from soil contact and rock formation. All pH
for rivers in Gianyar Regency are still within the
threshold of the established Environmental Quality
Standards.
b. Organic Substance (as KMnO
4
)
Organic substances contained in water include those
from nature (eg vegetable oils, oil fibers, animal fats,
cellulose alcohol, sugar, starch and so on), from
synthesis (eg various compounds and fruits produced
from processes in water). factory), from fermentation
(eg alcohol acetone, glycerol, antibiotics, acids and
No Sub Distric
Source Istalled Produkction
1 Gianyar 193.84 223.60 178.96
2 Blahbatuh 99.21 116.26 106.22
3 Sukawati 149.56 156.78 136.75
4 Ubud 36.44 44.76 35.78
5 Payangan 188.78 189.08 181.98
6 Tegalalang 42.20 45.95 39.35
7 Tampaksiring 74.41 89.82 64.68
Capacity (liters/second)
Clean Water Supply Policy to Support Tourism Activities in Gianyar Regency
903

the like derived from the activity of microorganisms
on organic materials).
Organic substances in water are caused by
wastewater from households, agriculture, industry
and mining as described above, their presence in
water can be measured by the number of
permanganate (KMnO4). The health effects that can
be caused by deviations from this standard are the
emergence of an unpleasant odor and can cause
stomach pain. The content is under the Regulation of
the Minister of Health of the Republic of Indonesia
Number 32/Menkes/Per/VI/2017 Environmental
Health Quality Standards and Water Requirements
for Sanitation set KMnO4 is 10 milligrams per liter.
The reading on the tool is still far below the Quality
Standard, which is 1.75.
c. BOD (Biological Oxygen Demand)
The results of the overhaul of organic substances by
certain bacteria will produce mineral substances, one
of which is aggressive CO2. This substance is soluble
in water so that it can cause corrosiveness to metal
water pipes. This CO2 gas can be removed by
aeration process and adding CaO or both. The five
rivers in Gianyar exceeded the Quality Standards for
the BOD5 value with results above 50 milligrams per
liter, where the Regulation of the Minister of Health
of the Republic of Indonesia Number
32/Menkes/Per/VI/2017 Environmental Health
Quality Standards and Water Requirements for
Sanitation states the threshold value is 12 milligrams
per liter . Both the Jinah and Unda rivers exceed the
Environmental Quality Standards.
d. Zinc (Zn)
The element of iron in water in a certain amount is
needed by the human body for the formation of red
blood cells, but excess of this element will cause an
odor and a reddish color change so that the water is
not pleasant to drink, but it can also form deposits in
pipes. metal and laundry. The test results for Zinc are
still far below the Environmental Quality Standards.
3. Microbiological requirements (E-Coli)
Environmental pollution by biological contaminants
must be prevented because it can pose a hazard to
public health. So that drinking water must be free
from parasitic germs and pathogenic bacteria at all as
well as coli group bacteria to exceed the
predetermined limits, namely 1 coli. Rivers in
Gianyar Regency detected more than 100 E-Coli
bacteria. These results were read from samples taken
per 100 milliliters of water sample and allowed to
stand for 5 days. This result is still below the
Environmental Quality Standard for river water
treatment as raw material.
3.4 Projected Population and Water
Demand
3.4.1 Population Projection
Population projection is one way to estimate the
amount of water needed in the future. From the
population data range from 2010 to 2019 it is known
that the population growth rate in Gianyar Regency is
0.89% which includes Sukawati District 1.37%,
Blahbatuh District 0.95%, Gianyar District 0.89%,
Tampaksiring District 0.64%, Ubud District 0.72%,
Tegalalang District 0.682%, Payangan District
0.50%. The population of Gianyar Regency in 2019
was 512,200 people which included Sukawati District
125,470 people, Blahbatuh District 72,140 people,
Gianyar District 94,580 people, Tampaksiring
District 48,740 people, Ubud District 74,320 people,
Tegalalang District 53,760 people, Payangan District
43,190 people.
3.4.2 Water Demand Analysis
Domestic Water Needs
The need for water for households/domestic is the use
of water for activities in the household environment.
Provision of raw water for household purposes is
calculated based on the population, the percentage of
the population to be served, the method of water
service, the consumption of water usage
(L/person/day) (Lu, 2007) (Pender, 1998) (Asian
Development Bank, 2016)
Non-Domestic Water Needs
What is meant by water needs for non-domestic
purposes is the use of water other than household use.
Included in the group of water needs for non-
domestic purposes include commercial, health,
social, office, education and worship. Non-domestic
water needs are calculated at 20% of domestic water
needs.
3.4.3 Water Loss
In the provision of clean water, it is very difficult to
avoid possible water loss from the system. Water loss
is caused by technical and non-technical factors.
Technical factors, including pipe leaks and water
meter damage. Meanwhile, non-technical factors
include meter reading/recording errors and
addition/subtraction errors. In planning a clean water
supply system, a volume of water is always taken into
iCAST-ES 2021 - International Conference on Applied Science and Technology on Engineering Science
904
account to avoid the possibility of water loss. This is
intended so that the supply of water for consumers
will not be disrupted in the event of water loss either
caused by technical factors or by non-technical
factors. Pipeline water losses in Indonesia are
assumed to be 20%-30% of the average population's
clean water needs. This amount of water loss is
estimated to be constant from the beginning until the
design year. The complete population and water
demand projection table can be seen in Table 2
Table 2: Population projection table and water demand.
Source: Analysis,2021
3.4.4 Water Balance Analysis
The availability of water that has been sought in
Gianyar Regency is currently 743.72 lt/s from the
regional drinking water company in Gianyar Regency
and 55.15 lt/s from the community. Based on the
projected water demand and water availability in
Gianyar Regency, the Water Balance can be
calculated as shown in the Table. 3
Table 3: Water Balance.
Source: analysis, 2021
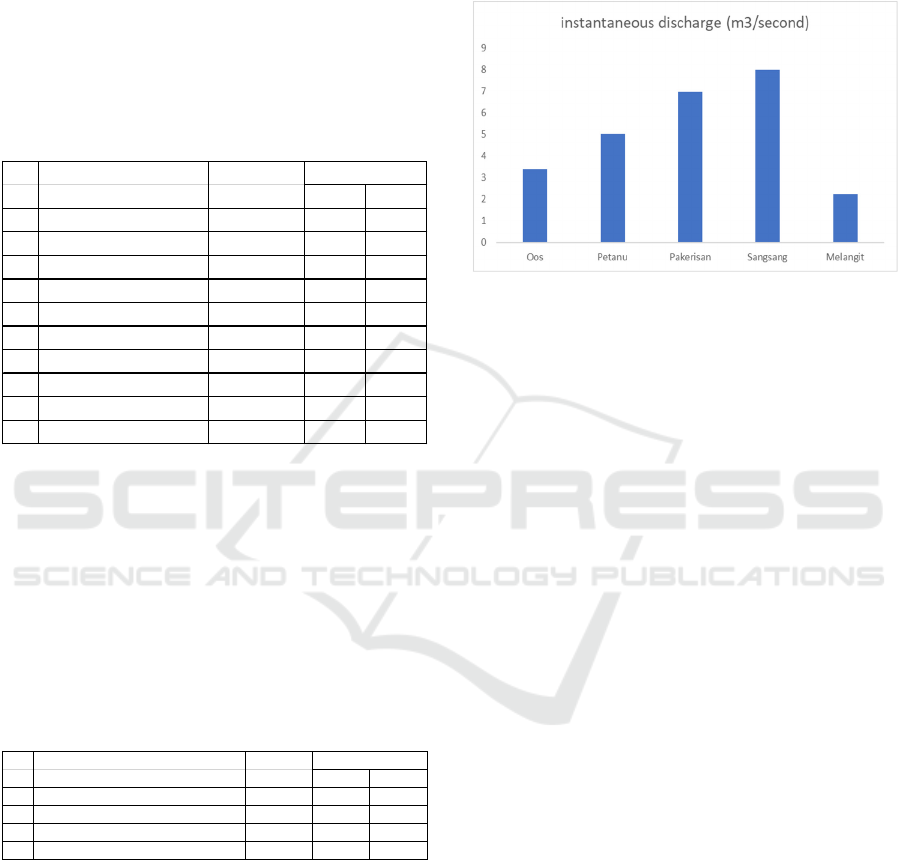
3.4.5 River Water Potential
The potential of water in several rivers downstream
of Gianyar Regency is still possible to be developed
into raw water reserves. Potential measurements were
carried out using the instantaneous discharge
measurement method (Dastorani et al., 2013),
(Clasing and Muñoz, 2018). Based on the results of
instantaneous discharge measurements in the field,
the average discharge in five rivers in Gianyar
Regency is 5.11 m3/sec with the largest discharge in
the Sangsang river at 7.97 m
3
/second and the smallest
discharge in the Melangit river at 2, 23 m
3
/second.
Complete data regarding the potential for the
downstream of the river as shown in Figure 2 below:
Figure 2: Instantaneous discharge measurement results.
3.4.6 Tourism Water Needs in Gianyar
Regency
Gianyar Regency is one of the main tourist
destinations in Bali Province with an estimated tourist
arrivals visiting this area in 2018 of 4.3 million people
consisting of 2.5 million foreign tourists and 1.8
million domestic tourists. The center of tourism
activities in Gianyar Regency is the Ubud area with
Ubud Palace as the center of its activities. Outside the
Ubud area, there are many tourist attractions such as
the Tirta Empul Temple Complex, Goa Gajah, Gung
Kawi Temple Complex, Tegenungan Waterfall, Bali
Safari And Marine Park, Bali Zoo and tourist villages
scattered in almost all areas. Likewise, this area has
been supported by an art market that sells various
souvenirs for tourists.
Based on data from the Tourism Office of Gianyar
Regency in 2015, there were 22 star hotels and 367
non-star hotels with a total of 11099 rooms. From the
analysis carried out with the assumption that the
water requirement for rooms is 400 liters/room/day,
the amount of water needed based on the number of
rooms is 51.38 liters/second. The water requirement
for villas is 10.28 liters/second, the need for
restaurants and bars is 5.14 liters/second and the
water needs for tourism purposes is 5.14
liters/second, so the total water demand for tourism in
Gianyar Regency is 71.94 liters/second. This value is
smaller than the allocation of non-domestic water
needs in Gianyar Regional water company which is
152.78 liters/second in 2020.
No. Des cription Unit
2020 2030
1 Population People 516,300 563,646
2 Percentage Service % 85 95
3 Serviced Residents People 438,885 479,099
4 Consumption Rate liter/people/day 150 150
5 Domestic Water Needs liter/second 762,00 832,000
6 Non Domesctic Water Needs liter/second 152,00 166,00
7 Non Doestic Percentage % 20 20
8 Total Water Needs liter/second 914 998
9 Water Loss liter/second 183 200
10 Water Los s % 20 20
Year
No Des cription Unit
2020 2030
1 Production Of Local water compan y liter/second 743.72 743.72
2 Production Of Non Local water company liter/second 55.15 55.15
3 Water Needs liter/s econd 1097.14 1197.75
4 Balance liter/s econd 298.27 398.88
Year
Clean Water Supply Policy to Support Tourism Activities in Gianyar Regency
905

3.4.7 Plan to Improve Water Supply in
Gianyar Regency
Based on the analysis of the water balance for the time
period 2020 to 2030, the results show that there is still
a shortage of drinking water for the community. As
previously mentioned, water supply in Gianyar
Regency is carried out through regional companies
and the community, both by pipelines and non-
pipeline networks. Meanwhile, regional companies
are further divided into 7 service units for each sub-
district. The plan for the development and
improvement of drinking water services will be based
on the area of the service unit as follows:
1. Gianyar region
The current production capacity of raw water sources
is 157.59 liters/second. It can still serve until 2020
with a service level of 85%, while the projected water
demand in 2030 is 264.53 liters/second, requiring
additional water supply of 106.94 liters/second.
second. This additional water supply is carried out by
optimizing existing water sources owned by regional
companies and by utilizing the Geroh spring and
water from the Unda river.
By optimizing existing water sources, it is
expected that water production can be increased to
160.27 liters/second. The Geroh Spring is located in
the upstream of Pakerisan river with a water
discharge ranging from 35 to 40 liters/second with
small springs around it which when combined, the
spring discharge becomes 75 liters/second. The
discharge to be taken is based on the projected water
demand in 2030, which is 60 liters/second. Water will
be accommodated in the Madangan distribution
reservoir with an increase in reservoir capacity from
500 m3 to 1000 m3 which is flowed by gravity. In
addition, the WTP development plan on the Unda
River is expected to provide an additional discharge
of 50 liters/second. Water from the Unda river will be
accommodated in the Bukit Jati Distribution
Reservoir with an additional capacity from 500 m3 to
1000 m3 and flowed through gravity.
2. Blahbatuh region
The current capacity of raw water produced is 61.63
liters/second. To increase the production capacity to
meet the demand in 2030 with a service level of 95%,
an additional discharge of 132.81 liters/second is
required. Efforts to meet these water needs can be
done by utilizing water from the Petanu River WTP
and building a reservoir in Wanayu with a capacity of
250 m3 and optimizing existing water sources. By
optimizing existing water sources, water production
can be increased to 66.20 liters/second. WTP in
Petanu river provides additional water supply of 50
liters/second. Construction of a reservoir in Wanayu
with a capacity of 250 m3 with a Wanayu discharge
of 24.18 liters/second.
3. Tegalalang region
The current production capacity of raw water is 69.8
l/s serving Kedisan Village, Kenderan Village, Keliki
Village, Tegalalang Village. In 2030, according to the
projected results, the water required is 87.42
liters/second so that an additional water supply of
17.62 liters/second is needed. For Taro Village,
Sebatu Village and Pupuan Village, drinking water
services are optimized by using services from the
community. Additional fulfillment of drinking water
supply can be obtained by utilizing the Bayad spring
located in Kedisan Village. The water discharge at the
Bayad spring is 75 – 90 liters/second. The Kedisan
Distribution Reservoir is used for water storage by
increasing the capacity from 50 m3 to 100 m3 which
will then be distributed by gravity.
4. Sukawati region
The current drinking water production capacity is
136.76 liters/second. Based on the projected drinking
water needs, with service coverage 85% of water
needs will be fulfilled until 2021. In 2030 water
demand will increase to 285.54 liters/second so that
additional supply is needed. water is 148.78
liters/second. Additional water supply is planned to
utilize water from the Tukad Petanu WTP, increase
the capacity of the Abianseka reservoir and optimize
existing water sources. By optimizing existing water
sources, water production can be increased to 141.49
liters/second. Utilization of water from WTP in
Petanu river will provide additional water supply for
Gianyar Regency by 50 liters/second. In Sukawati
District, the water supply from the Petanu River WTP
is used at 25 liters/second. To maximize the flow of
water by gravity, it is necessary to build a distribution
reservoir in Batubulan Kangin Village with a capacity
of 250 m3. Increased Abianseka Reservoir Capacity
with an existing capacity of 200 m3 to 1000 m3 which
will accommodate water from the Lodtunduh well at
9 liters/second, Abianseka well 17.91 liters/second
seconds, and the Cangi well of 14.27 liters/second
will be able to improve the service of the Gianyar
regional water company at the Sukawati Branch.
5. Tampaksiring region
The existing raw water capacity is 67.19 liters/second
and is currently experiencing a water shortage. In
2030 the amount of water needed is 164.86
iCAST-ES 2021 - International Conference on Applied Science and Technology on Engineering Science
906

liters/second so that an additional water supply of
97.67 liters/second is needed. It is planned to utilize
the Bayad spring and the relocation of the Tirta
Empul spring to provide additional water supply. By
optimizing existing water sources, water production
can be increased to 78.48 liters/second. Take
advantage of the Bayad spring with a flow rate of 75
– 90 liters/second. The point of taking the Tirta
Empul spring is moved, at the new point of collection
it is planned to take 35 liters/second
4 CONCLUSION
Based on the results of the analysis, it can be
concluded that several things related to the provision
of clean water to support the tourism sector in
Gianyar Regency are as follows:
a. The need for clean water for the tourism sector in
Ginyar Regency in 2020 is 71.94 liters/second or
47.09% of the estimated total non-domestic water
needs of 152.78 liters/second.
b. In general, the quality of water produced by
regional clean water companies is clean water that
has not been drunk directly. In some rivers, the
quality of the water is of inadequate quality
c. The strategy of increasing water supply in Gianyar
Regency due to the growing population and
tourism can be carried out by utilizing water in
five rivers downstream, namely the Oos, Petanu,
Sangsang, Pakerisan and Melangit rivers with a
total capacity of 25.55 m
3
/second. In addition to
the use of river water in the downstream,
additional water sources can be done by making
deep wells.
ACKNOWLEDGEMENTS
On this occasion the author would like to thank all
those who have helped, namely the Bali State
Polytechnic, the Bali Provincial Research and
Innovation Agency, the Central Statistics Agency for
Gianyar Regency.
REFERENCES
Asian Develovment Bank (2016) ASIAN
DEVELOPMENT BANK INDONESIA Country
Water assessment Indonesia Country Water
assessment. Available at: www.adb.org.
Clasing, R. and Muñoz, E. (2018) ‘Estimating the optimal
velocity measurement time in rivers’ flow
measurements: An uncertainty approach’, Water
(Switzerland), 10(8). doi: 10.3390/w10081010.
Dastorani, M. T. et al. (2013) ‘River instantaneous peak
flow estimation using daily flow data and machine-
learning-based models’, Journal of Hydroinformatics,
15(4), pp. 1089–1098. doi: 10.2166/hydro.2013.245.
Gianyar Regency (2018) Gianyar Regency Tourism
Strategic Study. 1st edn. Edited by G. Regency. Gianyar
Regency.
Gu, Q. et al. (2014) ‘Identification and assessment of
potential water quality impact factors for drinking-
water reservoirs’, International Journal of
Environmental Research and Public Health, 11(6), pp.
6069–6084. doi: 10.3390/ijerph110606069.
Sudarmini, N. M., Sri Widari, C. I. and Sukartini, N. W.
(2017) ‘Sustainable Tourism Management Model for
Tegenungan Waterfall, Gianyar’, International Journal
of Applied Sciences in Tourism and Events, 1(2), p. 126.
doi: 10.31940/ijaste.v1i2.652.
Suhendra, I. W. G. Y., Agung, A. A. P. and Maba, W.
(2019) ‘Development Strategy Of Village Tourism
Area In Petulu Village, Gianyar Regency’,
International Journal of Contemporary Research and
Review, 10(02), pp. 21364–21375. doi:
10.15520/ijcrr.v10i02.665.
Herschy, R. W. (2012) ‘Water quality for drinking: WHO
guidelines’, Encyclopedia of Earth Sciences Series, pp.
876–883. doi: 10.1007/978-1-4020-4410-6_184.
Lu, T. (2007) ‘Research of domestic water consumption : a
field study in Harbin , China by’, A research project
report submitted in partial fulfilment of the
requirements for the award of the degree of Master of
Science of Loughborough University, (SEPTEMBER),
pp. 1–89. Available at:
http://www.switchurbanwater.eu/outputs/pdfs/W3-
1_GEN_PHD_Research_of_domestic_water_consump
tion_-_a_field_study_in_Harbin_China.pdf.
Murcott, S. et al. (2015) ‘Evaluation of Microbial Water
Quality Tests for Humanitarian Emergency and
Development Settings’, Procedia Engineering, 107, pp.
237–246. doi: 10.1016/j.proeng.2015.06.078.
Pender, et Al (1998) ‘The incidental nonhyperfunctioning
adrenal mass: An imaging algorithm for
characterization’, Clinical Radiology, 53(11), pp. 796–
804. doi: 10.1016/S0009-9260(98)80189-X.
Sandiford, P. et al. (1989) ‘Determinants of drinking water
quality in rural Nicaragua’, Epidemiology and
Infection, 102(3), pp. 429–438. doi:
10.1017/S0950268800030144.
Smith, J. (1998). The book, The publishing company.
London, 2
nd
edition.
WHO (2017) ‘Drinking Water Parameter Cooperation
Project’, pp. 1–228. Available at:
http://ec.europa.eu/environment/water/water-
drink/pdf/20171215_EC_project_report_final_correcte
d.pdf.
Clean Water Supply Policy to Support Tourism Activities in Gianyar Regency
907
