
Maintenance Analysis of Boiler Feed Water Pump using
Quantitative Methods
Hendrik Elvian Gayuh Prasetya, Wilda Rahmania and Fifi Hesty Sholihah
Powerplant Engineering Department, Politeknik Elektronika Negeri Surabaya, Surabaya, Indonesia
Keywords: Steam Power Plant, BFP, Maintenance, Quantitative Methods, Reliability, MTTF.
Abstract: The boiler feedwater pump is a multistage pump driven by a boiler feed pump steam turbine on a steam power
p plant. A boiler feedwater pump has many failures, the example high temperature and vibration in bearing
and mechanical seal, leak in valve and line connection, etc. The failure in every component in the boiler
feedwater pump could be reduced by maintenance analysis. There are many methods for maintenance
analysis, one of that is quantitative analysis methods. Maintenance analysis with quantitative methods uses
downtime data on the BFP component as reference data. The downtime data is simulated using Weibull 6 ++
software to get the right distribution to determine the value of Reliability (R (t)), MTTF (Mean Time To
Failure), and failure rate. The result of maintenance analysis using quantitative methods is the reliability of
the Boiler Feed Water Pump components decreases over time, the result of the Mean Time To Failure
calculation is the value on the BFP component obtained the lowest MTTF value is the solenoid valve with the
MTTF value 408.62 and the highest MTTF value on the accumulator and regulator with MTTF value
57428.358. The maintenance recommendation on BFP components are the components that have CFR failure
rate characteristics the maintenance recommendations are corrective maintenance, and the maintenance
recommendation for components that have failure rate IFR and DFR are preventive maintenance.
1
INTRODUCTION
The development of coal production in 2009-2018
increased significantly with the production of 557
million tons in 2018. One of the factors which cause
the low realization of coal consumption is the operation
of the steam power plant in a 35,000 MW program is
not according to the plan and declining of the industry
activities. In 2018, power plant production reached
283,8 TWh which was derived from 56.4% coal,
20.2% gas, 6.3% fuel, and 17.1% NRE (New
Renewable Energy) ( Secretariat General National
Energy Council, 2019).
Steam Power Plant is a thermal power plant where
water is converted into steam high temperature to
rotate the steam turbine at a required rpm to generate
electricity. The Steam power plant has many critical
components there are boiler, low and high-pressure
turbine, condenser, feed water pump, etc (Ahmed and
Billah, 2012). Feedwater Pump or boiler feed water
pump (BFP) is the main pump of a steam power plant,
and it is the critical component of a steam power
plant.
The Boiler feedwater pump (BFP) is a pump
driven by a steam turbine boiler feed pump, the steam
of the turbine boiler feed pump is from the extraction
main steam turbin (PLTU 1 Jawa Tengah). The
function of this pump is to supply feed water to
boilers from the deaerator to the steam drum
bypassing the high-pressure heater (HPH). This is the
main pump in steam power plant so When this pump
is tripped, the steam power plant can not produce
electricity because this pump cannot be operated it
can affect the performance of the other components.
The failures on the boiler feedwater pump can be
resolved by maintenance.
Maintenance is a routine activity to keep a
particular machine at its normal condition so, it can
deliver the expected performance without causing any
looses and failure (Tadi and Ouali, 2011).
Maintenance has 3 types there are preventive
maintenance, corrective maintenance, and predictive
maintenance. The maintenance analysis method to
determine the reliability of the BFP component could
use quantitative methods (Dhilon, 2006).
Maintenance analysis with quantitative methods
uses downtime data on the BFP component as
reference data for quantitative analysis. The downtime
Prasetya, H., Rahmania, W. and Sholihah, F.
Maintenance Analysis of Boiler Feed Water Pump using Quantitative Methods.
DOI: 10.5220/0010968100003260
In Proceedings of the 4th International Conference on Applied Science and Technology on Engineering Science (iCAST-ES 2021), pages 1507-1514
ISBN: 978-989-758-615-6; ISSN: 2975-8246
Copyright
c
2023 by SCITEPRESS – Science and Technology Publications, Lda. Under CC license (CC BY-NC-ND 4.0)
1507
data is simulated using Weibull 6 ++ software to get
the right distribution to determine the value of
Reliability (R (t)), MTTF (Mean Time To Failure),
and failure rate. the types of distributions used in
reliability calculations are lognormal distribution,
normal distribution, Weibull distribution, and
exponential distribution
The previous study entitled “A study of the
quantitative methods that support RCM operation”
this research discusses investigates the quantitative
methods to support the Reliability Centered
Maintenance (RCM) operation. The result of this
research is the quantitative method especially
probability theory is commonly used to the RCM
method to identify the maintenance analysis. the
probability theory in quantitative methods can
determine the distribution used to calculate reliability
and the Mean Time to Failure in the RCM method
(Mendes and Ribeiro, 2015).
The previous study entitles “Availability Analysis
of Heat Recovery Steam Generators Used in Thermal
Power Plants” discusses the method for reliability and
availability evaluation in HRSG, especially two
HRSG in 500 MW combines-cycle power plant. The
first step is knowing the generator functional tree and
FMEA analysis, the second step involves reliability
and availability based on the time to failure data after
that it could be obtained the availability value for each
HRSG components. After that, the maintenance
analysis will be improved through the use of reliability
centered maintenance (RCM) concepts (Carazas and
Salazar, 2011 ).
1.1 Maintenance on Boiler Feed Pump
Turbine
A.
Boiler Feed Water Pump
The boiler feed Water Pump (BFP) is one of the
critical rotating machinery on steam power plants
(Yoshikawa, 2016).
The Boiler feedwater pump is the
application of large- sized centrifugal pumps in the
steam power plant. The Boiler feedwater pump serves
to control and supply water from the water tank (feed
water tank) to the boiler with certain pressure
specifications.
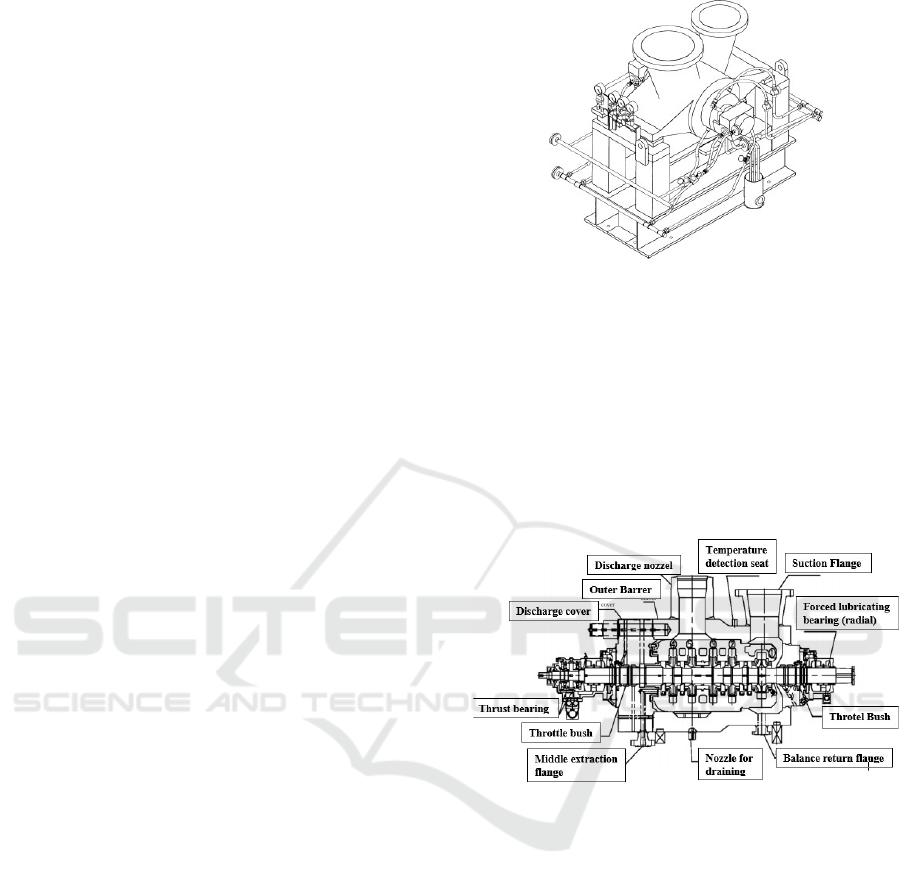
Figure 1: Boiler Feedwater Pump.
The boiler feedwater pump is driven by a small
turbine, turbine boiler feed pump driven by steam from
extraction in the main turbine. The workings of the
boiler feedwater pump (BFP) are a shaft from the
turbine boiler feed pump coupled with the boiler feed
pump turbine shaft so the pump can be driven. When
the BFP’s shaft rotated, the impeller attached to the
shaft also rotated, and then the water can enter through
the suction pump.
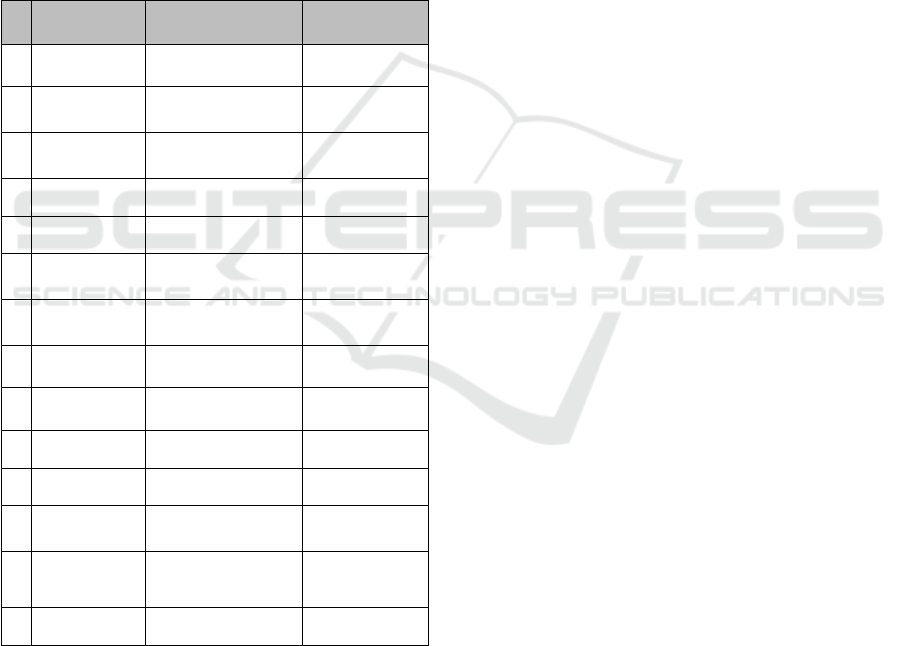
Figure 2: Components of the boiler feedwater pump.
The components of the boiler feed pump water pump
are coupling, bearing, turning gear, mechanical seal,
selenoid valve, sensor LCV, control valve,
transmitter, regulator, etc (Dhilon, 2006). These
components mutually affect the performance of this
boiler feed water pump, when one of the components
has a failure then the performance of the BFP will
decrease or this BFP will be trip.
B.
Maintenance
The definition of maintenance is the technical and
managerial action taken during component or asset
usage period to maintain and restore the function
(Shin and Jun, 20015).
Maintenance has a function
or influence on components, i.e (Patton and Joseph,
1995) :
1.
Every component has a useful life and in the
future could have many failures.
iCAST-ES 2021 - International Conference on Applied Science and Technology on Engineering Science
1508

2.
To find out precisely the equipment will be has
a failure
3.
To increase the lifetime of an operating unit.
Maintenance applications can be divided into several
types, among others :
a.
Corrective Maintenance
Corrective maintenance is maintenance
activities are carried out on machines that fail
and cannot function properly (Dhilon, 2006). The
characteristic of corrective maintenance is
replacing parts that are failing and the failure will
affect the performance of other components or
units.
b.
Preventive Maintenance
Preventive maintenance is maintenance that is
scheduled and periodically (Dhilon, 2006).
Preventive maintenance aims to expedite the
production process and reduce the possibility of
failures that will occur in the operating unit.
Preventive maintenance can also determine the
maintenance schedule so it can maintain the
performance of equipment and prevent
equipment from failing (MathWorks,2019).
Figure 3: Preventive Maintenance.
c.
Predictive Maintenance
Predictive maintenance is a method that can predict
the lifetime of a component, based on inspection
or diagnosis so that the component's lifetime can
be known (Dhilon, 2006). Knowing the predicted
failure time will help to find the optimum time to
schedule maintenance for the equipment.
Figure 4: Predictive Maintenance.
C.
Quantitative Analysis Method
The quantitative analysis method is a numerical
method that can be used to determine the level of
reliability of equipment by using mathematical
calculations based on the distribution formula
(Ebelling,1997).
1.
Normal Distribution
A normal distribution is used to model the
phenomenon of wear and tear of the equipment or
operating unit. The parameter used is μ (middle
value) σ (standard deviation).
The reliability function is:
- Failure Distribution Function:
𝑓
(
𝑡
)
=
√
𝑒
[
(
)
]
(1)
- Reliability Function:
𝑅
(
𝑡
)
= 1 − 𝜙
(2)
- Failure Rate Function :
𝜆
(
𝑡
)
=
𝑓(𝑡) (3)
𝑅(𝑡)
- Mean Time to Failure :
𝑀𝑇𝑇𝐹 = 𝜇 (4)
t : Failure Time
𝜇 : Mean
𝜙 : Normal Distribution Table
𝜎 : Standard Deviation
2.
Lognormal Distribution
The lognormal distribution uses two parameters,
namely (μ) (shape parameter) and (σ) (location
parameter) which is the middle value of a failure
distribution. The reliability function is:
-
Failure Distribution Function :
𝑓
(
𝑡
)
=
√
𝑒
[
(
)
]
(5)
- Reliability Function :
𝑅
(
𝑡
)
= 1 − 𝜙 (
)
(6)
- Failure Rate Function :
𝜆
(
𝑡
)
=
()
()
(7)
- Mean Time to Failure:
𝑀𝑇𝑇𝐹 = 𝑒
(𝜇+
)
(8)
t : Failure Time
µ : Mean
σ : standard Deviation
Ф : normal distribution table
3.
Exponential Distribution
An exponential distribution is used to calculate
reliability which has a constant failure rate. The
Maintenance Analysis of Boiler Feed Water Pump using Quantitative Methods
1509

parameter used in the exponential distribution is λ
which indicates the average failure on the
component. The reliability function is0:
-
Failure Distribution Function :
𝑓
(
𝑡
)
= 𝜆𝑒
−𝜆𝑡
(9)
-
Reliability Function:
𝑅
(
𝑡
)
= 𝑒
−𝜆𝑡
(10)
-
Failure Rate Function:
𝜆
(
𝑡
)
=
𝜆
(11)
-
Mean Time to Failure:
𝑀𝑇𝑇𝐹 =
λ
(12)
t : Failure time
λ: lambda
4.
Weibull Distribution
Weibull distribution is the most widely used
distribution, this distribution is used for increasing
failure rates and decreasing failure rates. In this
Weibull distribution, there are 2 types, Weibull 2
parameter distribution, and Weibull 3 parameter
distribution. The reliability Weibull 2 parameter
distribution function is:
-
Failure Distribution Function:
𝑓
(
𝑡
)
=
(
)
𝑒
(
)
(13)
-
Reliability Function:
𝑅
(
𝑡
)
= 𝑒
(
)
(14)
-
Failure Rate Function:
𝜆
(
𝑡
)
=
(
)
(15)
β : beta
t : failure time
θ : teta
In addition to calculating reliability, the quantitative
analysis also analyzes the availability, availability is
the probability that a component carries out its
function within a certain period of time when used
during operating conditions (Dhilon, 2006).
𝐴
(
𝑖
)
=
(16)
MTBF : Mean time between failure
MTTF : Mean time to failure
MTTR : Mean time to repair
The availability value can change with time, it can be
written in the equation (Dhilon, 2006).
𝐴
(
𝑡
)
= 1 − [
− (
)𝑒
[
(
)
]
]
(17)
2
RESEARCH METHOD
The objective of this study is to determine the
reliability, Mean Time to Failure, type of maintenance,
and preventive maintenance scheduling on a boiler
feedwater pump by using quantitative methods. the
steps carried out in this study can be explained by this
flowcharts.
Figure 5: Flowchart Research.
This research to know the probability distribution and
the parameter by using ReliaSoft Weibull 6++
software. ReliaSoft Weibull6++ software is a data
analysis tool that performs utilizing lifetime
distribution, warranty, and degradation data analysis
geared toward reliability engineering.
The data input ReliaSoft Weibull 6++ software is
the time to failure (TTF) and time to repair (TTR) data
obtained form the industry. TTF and TTR data are
obtained from the length of time to repair and
vulnerable time between one failure and subsequent
failure.
iCAST-ES 2021 - International Conference on Applied Science and Technology on Engineering Science
1510

2.1 Procedure
There are several processes in simulating this Weibull
6 ++ software, i.e. Calculate the value of the TTF and
TTR from the downtime data on the BFP components.
Table 1: Transmitter downtime data.
Actual Start Actual Finish TTF TTR
3/9/12 9.00 AM 3/9/12 3.00 PM 0 6
5/16/12 10.26 AM 5/21/12 1.22 PM 1627 123
10/9/12 4.42 PM 10/9/12 5.42 PM 3365 1
4/8/16 7.24 AM 4/8/16 7.24 PM 4358 0
4/8/16 9.00 AM 4/8/16 5.00 PM 4347 8
12/20/16 9.00 AM 12/20/16 3.00 PM 6120 6
4/5/18 8.00 AM 4/5/18 1.00 PM 11313 5
Simulate the TTF data or TTR data on ReliaSoft
Weibull 6++ software, after simulating the Weibull
6
++ software, then we will find out the exact distribution
used in the calculation of reliability in accordance with
the TTF data owned. in addition to the known types of
probability distributions that are also known parameter
values according to the type of distribution,
Transmitter
Weibull 2
parameter
b
eta (β) = 1,5789
Eta (θ) = 7108,98
2.2 Maintenance Recommendation
Maintenance recommendations for each BFP
component can be determined based on the type of
failure rate for each component. every component
has a maintenance technique to reduce the chance
of failure.
Table 2: Maintenance Recommendation.
Failure Rate Characteristic
Maintenance
Recommendation
DFR
(Decreasing Failure Rate)
Preventive maintenance
CFR
(Constant Failure Rate)
Corrective maintenance
IFR
(Increasing Failure Rate)
Preventive maintenance
3
RESULT AND ANALYSIS
Maintenance analysis with quantitative methods to
determine the reliability value of a component through
calculations using a probability distribution. the
results of the reliability calculation and the meantime
to failure on the BFP components
Table 3: Quantitative Analysis Result.
Components
Type of
Distribution
The time is
taken when R
(t) = 80%
MTTF
Turning Gear
Exponential 740 jam 3333,33
Bearing Lognormal 340 jam 2946,6
Mechanical Seal Weibull 2
parameter
30 jam 2121,71
Solenoid Valve
Weibull 2
parameter
167 jam 408,62
Sensor Exponential 90 jam 1666,67
LCV
Weibull 2
parameter
370 jam 2398,76
Control Valve
Weibull 2
parameter
26000 jam 40445,168
Relief Valve Exponential 1100 jam 5000
Frame Pump and
turbine
Lognormal 1200 jam 8509,22
Transmitter
Weibull 2
parameter
2700 jam 6382,11
Accumulator Exponential 12800 jam 57428,358
Regulator Exponential 12800 jam 57428,358
Indicator Gauge
(pressure and
Temperature)
Weibull 2
parameter
945 jam 3137,15
Line dan Valve Exponential 6450 jam 28964,518
The results of quantitative analysis that has been done
by calculating the reliability and MTTF on each BFP
component. Form fig 6 can be seen that the value of
reliability decreases with time due to lifetime and
components that have decreased component function
over time. In the calculation of the Mean Time to
Failure value in the BFP component, the higher the
MTTF value indicates that the component rarely have
fails and the lower MTTF value indicates that the
component often has failed. this is because when the
MTTF value decreases the distance between failures
is very close so it can be concluded that the
component most often has a failure.
From table 3 it can be concluded that the
component has most frequently failed is the solenoid
valve with an MTTF value of 408.62. Failure that
often happened in the solenoid valve is the solenoid
coil broken because of the poor quality of electronic
components so that failure often occurs. The highest
MTTF value is the accumulator and regulator with an
MTTF value of 57428,358, this indicates that the
accumulator and regulator are the most often
components have failure and the time interval
between failures is quite long. the highest the MTTF
value, it shows that the components more
Maintenance Analysis of Boiler Feed Water Pump using Quantitative Methods
1511

Figure 6: Reliability Graphic on BFP component.
often have a failure, and the smallest MTTF value
indicates the component is most often has a failure.
Form the distribution parameter it can calculate the
failure rate on every component of BFP. There are
three kinds of failure, increasing failure rate,
decreasing failure rate, and constant failure.
Figure 7: Constant failure rate graphic.
Figure 8: Decreasing Failure Rate.
Figure 9: Increasing Failure Rate.
The constant failure rate graph above shows the
components are in a constant condition. the failure rate
characteristic with the constant graph above is
Constant Failure Rate (CFR), it means that this
equipment is in the useful life phase or the equipment
is in a condition where there is not increasing or
decreasing in failure and the failure that occurs on this
CFR phase is mostly caused by human error. The
graph with the CFR (Constant Failure Rate)
characteristic is also caused by the lambda parameter
value (λ) on the exponential distribution (Dhilon,
2006).
The second failure rate graph above shows that
there is a decreasing in the failure rate over time, the
failure rate characteristic with the decreasing graph is
the Decreasing Failure Rate (DFR), it means that this
equipment is in the burn-in phase and the failure in the
components that have DFR graph is caused due to
defects in the production of manufacturing
(Ebelling,1997). The graph with the DFR (Decreasing
Failure Rate) characteristic is also by the results of the
2-parameter Weibull distribution where the value of
the shape parameter (β) is less than 0 (Dhilon, 2006).
The third failure rate graph above shows that there
is an increase in the failure rate over time, the
characteristics of the failure rate with the graph
increase as above are Increasing Failure Rate (IFR),
it means that this equipment is in the wear-out phase
or long use and the failure caused is due to fatigue,
iCAST-ES 2021 - International Conference on Applied Science and Technology on Engineering Science
1512
corrosion, aging and many more (Ebelling,1997). To
reduce these failures, preventive maintenance is
required to reduce the failure rate. The graph with the
IFR (Increasing Failure Rate) characteristic is also
caused by the results of the 2 parameters Weibull
distribution with the value of the shape parameter (β)
is more than 2 (Dhilon, 2006).
Each BFP components have their failure rate
graph, the failure rate graph can also determine the
appropriate maintenance recommendations for each
component. The following table shows the
characteristics of the failure rate and maintenance
recommendations for each component of the boiler
feedwater pump.
Table 4: Failure Rate Characteristics and Maintenance
Recommendation.
No Equipment
Failure Rate
Characteristics
Maintenance
Recommendation
1 Turning Gear
CFR
(Constan
t
Failure Rate)
Corrective
maintenance
2 Bearing
DFR
(
Decreasing Fai lure Rate
)
Preventive
maintenance
3 Solenoid Valve
DFR
(
Decreasing Fail ure Rat e
)
Preventive
maintenance
4 Mechanical Seal
DFR
(
Decreasing Failure Rate
)
Preventive
maintenance
5 LCV
DFR
(
Decreasing Failure Rate
)
Preventive
maintenance
6 Sensor
CFR
(Constant Failure Rate)
Corrective
maintenance
7 Control Valve
IFR
(Increasing Failure Rate)
Preventive
maintenance
8 Relief Valve
CFR
(Constan
t
Failure Rate)
Corrective
maintenance
9 Frame Pump dan
turbine
DFR
(
Decreasing Failure Rate
)
Preventive
maintenance
10 Transmitter
IFR
(Increasing Failure Rate)
Preventive
maintenance
11 Accumulator
CFR
(Constan
t
Failure Rate)
Corrective
maintenance
12 Regulator
CFR
(Constant Failure Rate)
Corrective
maintenance
13 Indicator Gauge
(pressure and
Temperature)
IFR
(Increasing Failure Rate)
Preventive
maintenance
14 Line dan Valve
CFR
(Constan
t
Failure Rate)
Corrective
maintenance
The components that have a CFR (Constant
Failure Rate) failure rate indicates that maintenance
recommendation is corrective maintenance, this is
because when the component is in the CFR phase it
indicates that the component is in the useful life phase
or the component is in a condition to operating
properly according to its function, and for
components with CFR failure rates that occur due to
human errors. To reduce this failure in the
components that are in the CFR phase, corrective
maintenance can be carried out by replacing damaged
or decreased performance components with new
components so that they can run properly.
Components that have the characteristics of the
IFR lure rate (Increasing Failure Rate) and DFR
creasing Failure Rate) recommended maintenance
preventive maintenance because the components at
have IFR failure rate characteristics are in wear- ut
condition. Failures that often occur in components
with IFR failure rates are fatigue, corrosion, aging
(lifetime), etc. So to avoid this failure, it is necessary
to periodically check the conditions so the
performance of the BFPT components is well
maintained and components have a DFR (Decreasing
Failure Rate) failure rate are also recommended for
preventive maintenance because the components at
the DFR failure rate are in burn-condition or the
component has just been operated and has failed.
Failures that occur are due to manufacturing defects
that reduce the performance of the components when
used, so preventive maintenance is needed so that the
defect does not cause excessive failure to a
component, and the performance of the boiler
feedwater pump is well maintained.
4
CONCLUSION
The emphasis of this research is the use of quantitative
analysis methods to determine the maintenance of the
Boiler Feed Water Pump. From the results are, it can
be concluded that the Boiler Feed Water Pump is a
critical component that often has fails. The results of
the analysis using quantitative methods are calculating
reliability, MTTF, and failure rate using probability
distribution that the reliability of the Boiler Feed
Water Pump components decreases over time, the
decrease in reliability is due to age or lifetime, thus
affecting the BFP's components performance. The
result of the Mean Time To Failure calculation is the
value on the BFP component obtained the lowest
MTTF value is the solenoid valve and the highest
MTTF value on the accumulator and regulator. This
MTTF value shows how often the BFP component has
failed, the smaller the MTTF value indicates that the
component often has failed and the highest the MTTF
value means that the component rarely has failed.
Determination of maintenance recommendations for
BFP components based on the failure rate
characteristics of each component, components that
have CFR failure rate characteristics, maintenance
Maintenance Analysis of Boiler Feed Water Pump using Quantitative Methods
1513

recommendations are corrective maintenance, and the
maintenance recommendation for components that
have failure rate IFR and DFR are preventive
maintenance.
REFERENCES
Secretariat
General National Energy
Council, (2019).
Indonesia Energy Outlook 2019. ISSN 2527-3000,
Jakarta.
R. Ahmed, M. Billah, and M. M. Hossain. (2012).
Increasing the efficiency of steam power plant with
the help of solar energy. 2nd International Conference
on the
Developments in Renewable Energy
Technology
(ICDRET 2012). Dhaka. pp. 1-3.
PLTU 1 JAWA TENGAH 2X (300-400) MW COAL
FIRED POWER PLANT. Turbine Manual Operation.
L. Tadj, M. S. Ouali, S. Yacout, D. Ait-kadi. (2011).
Replacement Models with Minimal Repair. London:
Springer-Verlag.
B. S. Dhilon. (2006). Maintainability, Maintenance, and
Reliability for Engineers. United States of America:
Taylor & Francis Group.
A. A. Mendes and J. L. D. Ribeiro. (2015). A study of
the quantitative methods that support RCM operation.
Proc. - Annu. Reliab. Maintainab. Symp., vol. 2015-
May,
no.
May.
doi:
10.1109/RAMS.2015.7105162.
F. J. G. Carazas, C. H. Salazar, and G. F. M. Souza.
(2011). Availability analysis of heat recovery steam
generators used in thermal power plants. Energy, vol.
36, no. 6, pp. 3855–3870.
S. Yoshikawa. (2016). Boiler Feed Pump. Ebara
Engineering Review No. 251 (2016-4).
J.-H. Shin and H.-B. Jun. (2015). On condition based
maintenance policy, J. Comput. Des. Eng., vol. 2, no. 2,
pp. 119–127.
Patton, Jr., and Joseph, D. (1995). Preventive
Maintenance. The International Society for
Measurement and Control. United States.
B.S. Dhillon. (2006). Maintainability, Maintenance, and
Reliability for Engineers. New York: Taylor & Francis
Group, LLC.
MathWorks. (2019). Introduction to Predictive
Maintenance with MATLAB. pp. 1–17.
C. E. Ebeling. (1997). Intro to Reliability &
Maintainability Engineering.pdf.. p. 486.
iCAST-ES 2021 - International Conference on Applied Science and Technology on Engineering Science
1514
