
How Concept Learning Changes Strategic Choice in Guessing Games?
Oleksii Ignatenko
1,2 a
1
Ukrainian Catholic University, 17 Sventsitsky Str., Lviv, 79011, Ukraine
2
Kyiv Academic University, 36 Vernadsky Blvd., Kyiv, 03142, Ukraine
Keywords:
Behavioral Game Theory, Guessing Game, K-Beauty Contest, Active Learning, R, Agent-Based Modeling.
Abstract:
This paper deals with the k-beauty contest game. The research question formulated in this work is how players
(mainly children and undergraduates) learn in complex strategic situations that they have never faced before
and how we can model this learning process. We examine data from different games played during popular
lectures about game theory and present findings of players’ progress in strategic learning while competing
with other players. The raw data gathered is available in an open repository for replication and analysis and an
R file with data manipulations, metrics calculations, and plots. Based on the conclusions from experimental
data, we create the agent-based model and launch ten thousand simulations for different setups. Then we apply
analysis from experimental data and discuss findings and similarities between agents and humans.
1 INTRODUCTION
Game theory is a field of science investigating ratio-
nal players’ decision-making under uncertainty. The
source of the uncertainty can be strategic structure,
e.g., probability of certain events, lack of information
about future possibilities, or decisions of other agents
that can generate it. In the last case, we can talk about
the interdependence of strategic actions, when some
players’ decisions affect others’ payoffs. Such situa-
tions arise around us daily, and we, consciously or un-
consciously, participate in them. The success heavily
relies on our perception of the actions of other play-
ers.
The problem is how we can know the future ac-
tions of other players. We cannot, but we can start
with some assumptions that will help create a frame-
work, model, or theory of “mind”, which will predict
future (reasonable) actions. Game theory proposed
approach, which is now under questioning (especially
from the side of the experimental or behavioral econ-
omy). Nevertheless, we will start from standard no-
tions and proceed to experimental data.
One can expect that other players will play “rea-
sonably”, and this game theory means they will try
to achieve a better result in some agent’s sense. This
idea is grasped by the term rationality. Every rational
player must calculate the best possible result, taking
a
https://orcid.org/0000-0001-8692-2062
into account the rules of the game and the interests of
other participants. In other words, think strategically.
It is well known from theory that rational players will
play Nash equilibrium (NE) if there is any, which is
very useful in games where only one unique NE ex-
ists. The notion of rationality was indeed fundamen-
tal for the development of game theory. However, the
problems with this notion are also quite famous.
First, it is very demanding because it presupposes
that the agent has complete, transitive preferences
and is capable of computing equilibrium in a given
strategic situation. However, this is not feasible in
many natural situations (for example, we know about
NE in chess, but still no computer can compute it).
Secondly, probably more important, there are many
games where NE is the poor prediction of actual hu-
man behavior. This paper investigates some of the
data from such a game and discusses the difference.
All this makes decision making exciting problem
to investigate. This is a rich area of research, where
theoretical constructions of the game theory seem to
fail to work, and experimental data shows unusual
patterns. These patterns are persistent and usually
do not depend on age, education, country, and other
things. During the last 25 years, behavioral game the-
ory in numerous studies has examined bounded ratio-
nality (best close concept to the rationality of game
theory), cognitive distortions, and heuristics people
use to reason in strategic situations. For example
we can note surveys of Crawford et al. (Crawford
706
Ignatenko, O.
How Concept Learning Changes Strategic Choice in Guessing Games?.
DOI: 10.5220/0012067100003431
In Proceedings of the 2nd Myroslav I. Zhaldak Symposium on Advances in Educational Technology (AET 2021), pages 706-720
ISBN: 978-989-758-662-0
Copyright
c
2023 by SCITEPRESS – Science and Technology Publications, Lda. Under CC license (CC BY-NC-ND 4.0)

et al., 2013) and Mauersberger and Nagel (Mauers-
berger and Nagel, 2018). Also, there is a comprehen-
sive description of the field of behavioral game theory
by Camerer (Camerer, 2003).
We will concentrate on the guessing games, which
are a significant part of research because of their sim-
plicity for players and easy analysis of rules from a
game-theoretic perspective. In this paper, we present
the results of games played during the 2018-2021
years as part of popular lectures about game theory
(Ignatenko, 2020). The audience of these lectures was
quite heterogeneous, but we can distinguish the fol-
lowing main groups:
• children at schools (strong mathematical schools,
ordinary schools, alternative education schools);
• students (bachelor and master levels);
• mixed adults with almost any background.
• adults with a business background
• participants of Data Science School
• participants of summer STEM camps for children
We propose a framework of four types of games,
each presenting one idea or concept of game theory.
These games were introduced to players with no prior
knowledge (at least in the vast majority) about the
theory. On the other hand, games have simple for-
mulation and clear winning rules, making them intu-
itively understandable even for kids. This makes these
games the perfect choice to test the ability of strategic
thinking and investigate the process of understanding
complex concepts during the play, with immediate ap-
plication to the practice. This dual learning, as we
can name it, shows how players try and learn in natu-
ral conditions and react to interaction challenges with
other strategic players.
In this paper, we will concentrate on the first
game – the famous p-beauty contest game. For this
game, we analyze data and try to formulate simple
rules which are plausible for an explanation of play-
ers’ behavior. In the next section, we created the
agent-based model using the Netlogo environment
and discussed the model’s main features. To investi-
gate the model and its properties, we performed sim-
ulations using the BehaviorSpace tool of Netlogo; as
a result, about 10000 games were simulated. Such
a volume of data is impossible to get using human-
based experiments. We recreated plots and metrics
developed for human data and analyzed its similarity
and differences. In the end, we formulate conclusions
and future work directions.
First, let us start with some definitions.
1.1 Game Theory Definitions and
Assumptions
Consider games in strategic or normal form in a non-
cooperative setup. A non-cooperativeness here does
not imply that the players do not cooperate, but it
means that any cooperation must be self-enforcing
without any coordination among the players. The
strict definition is as follows.
A non-cooperative game in strategic (or normal)
form is a triplet G = {N , {S
i
}
i=∈N
,{u
i
}
i∈N
}, where:
• N is a finite set of players, N = {1, . . . , N};
• S
i
is the set of admissible strategies for player i;
• u
i
: S −→ R is the utility (payoff) function for
player i, with S = {S
1
×· ··×S
N
} (Cartesian prod-
uct of the strategy sets).
A game is said to be static if the players take their
actions only once, independently of each other. In
some sense, a static game is a game without any no-
tion of time, where no player has any knowledge of
the decisions taken by the other players. Even though,
in practice, the players may have made their strate-
gic choices at different points in time, a game is still
static if no player has any information on the deci-
sions of others. In contrast, a dynamic game is one
where the players have some (full or imperfect) infor-
mation about each others’ choices and can act more
than once. In this work, we deal with repeated static
games, which means that the same game is played
twice (sometimes three times) with the same players.
Agents’ rationality is a significant issue; some-
times, it is called full rationality (to differentiate it
from bounded rationality – a less restricting notion).
When a fully rational agent tries to find the best ac-
tion, it usually depends on the action of other self-
interest agents. So the first agent must form beliefs
about the second agent’s beliefs about the beliefs of
the first agent, and so on. Such constructions seem
too complicated, but they are based on the predictions
of classical game theory, which assumes all agents to
be fully rational.
One quite famous result by Aumann (Aumann,
1995) is that for an arbitrary perfect-information
extensive-form game, the only behavior that is com-
patible with (1) common knowledge of rationality,
and in particular by (2) each agent best responding
to their knowledge is for each agent to play according
to the strategy, obtained by the backward induction.
Aumann and Brandenburger (Aumann and Branden-
burger, 1995) showed that common knowledge of ra-
tionality, the game payoffs, and the other agent’s be-
liefs are sufficient conditions for Nash equilibrium in
an arbitrary game.
How Concept Learning Changes Strategic Choice in Guessing Games?
707

In this regard, the most accepted solution concept
for a non-cooperative game is that of a Nash equilib-
rium, introduced by John F. Nash (Kuhn et al., 1996).
Loosely speaking, a Nash equilibrium is a state of a
non-cooperative game where no player can improve
its utility by changing its strategy if the other players
maintain their current strategies. Of course, players
also use information and beliefs about other players,
so we can say that (in Nash equilibrium) beliefs and
incentives are important to understand why players
choose strategies in real situations.
The NE is the core concept of game theory, but
it differs from experiments and sometimes reality.
In some games, humans demonstrate convergence to
equilibrium, but in others do not. This gap between
similarly-looking games is slim and not easy to catch.
We will consider guessing games as a playground to
work with players’ behavior.
2 GUESSING GAMES HISTORY
In early 90xx, Rosemary Nagel started a series of ex-
periments of guessing games, summarized in (Nagel,
1995). She was not the first to invent the games;
they were used during the lectures by different game
theory researchers (for example, Moulin (Moulin,
1986)). In recent work (Nagel et al., 2017) authors
provide extensive research of the origins of the guess-
ing game with unexpected links to the editor of one
french newspaper Alain Ledoux, who, as far as it is
known today, was the first who used the rules and then
publish an article about unusual patterns observed
(Ledoux, 1981). The work of Nagel (Nagel, 1995)
was the first experimental try to investigate the hid-
den patterns in the guessing game, and in this working
framework of k-level models was proposed.
Later, Ho et al. (Ho et al., 1998) gave the name “p-
beauty contest” inspired by Keynes’s comparison of
stock market instruments and newspaper beauty con-
tests.
The beauty contest game (BCG) has become an
important tool to measure the “depth of reasoning” of
a group of people using simple abstract rules. To be-
gin with, we should note that behavioral game theory
aims to develop models, which explain human behav-
ior in a game-theoretic setup more accurately, based
both on experiments and theory (Camerer, 2003).
There are two main approaches how to dealing with
the problem of replacing full rationality with bounded
rationality. The first view is to consider bounded-
ness as an error. For example quantal response no-
tion (Camerer et al., 2002) or ε-equilibrium (Leyton-
Brown and Shoham, 2008) assume that agents make
an error by choosing not optimal strategy profile.
They play near-optimal response because they do not
have the capacity to calculate the exact best action.
The second approach is to treat bounded rational-
ity as a structural property of an agent’s reasoning
process. One of the most prominent classes of mod-
els of this type is the iterative model’s scheme. They
include the k-level reasoning (Nagel, 1995; Costa-
Gomes et al., 2001), cognitive hierarchy (Camerer
et al., 2004) and quantal cognitive hierarchy models
(Wright and Leyton-Brown, 2017). All these models
consider boundedness as an immanent part of the rea-
soning. Each agent has a non-negative integer level
representing the degree of strategic reasoning (i.e.,
modeling of recursive beliefs) of which the agent is
capable. Level-0 agents are nonstrategic – they do
not model other agents’ beliefs or actions at all; level-
1 agents model level-0 agents’ actions; level-2 agents
model the beliefs and actions of level-1 agents; and
so forth (Wright and Leyton-Brown, 2016). In this
work, we support the latter idea, analyzing experi-
mental data to estimate changes in numbers of dif-
ferent levels in the learning and teaching process.
2.1 Learning Models
Recently, game theorists began to research the process
of reasoning toward equilibrium actively. Two promi-
nent simple learning models are reinforcement and
belief learning (e.g., fictitious play). In reinforcement,
strategies have numerical attraction levels, which are
reinforced (increased) when a strategy is chosen, and
the result is good. Reinforcement is a good model of
animal learning but does not gracefully accommodate
the fact that people often choose strategies that have
not been directly reinforced.
In the fictitious play, players form beliefs based
on a weighted average of what others have done in
the past, and best respond given their beliefs. Re-
markably, weighted fictitious play is equivalent to a
generalized reinforcement model in which unchosen
strategies are reinforced by the forgone payoffs they
would have yielded.
There are a lot of other approaches; we will men-
tion the approach which enriches 0-level reasoning
(Wright and Leyton-Brown, 2017). Specifically, they
investigate general rules that can be used to induce
a level-0 specification from the normal-form descrip-
tion of an arbitrary game.
Also, we can note work (Gill and Prowse, 2016),
where participants were tested on cognitive abilities
and character skills before the experiments. Then
authors perform statistical analysis to understand the
impact of such characteristics on the quality of mak-
AET 2021 - Myroslav I. Zhaldak Symposium on Advances in Educational Technology
708

ing strategic decisions (using a p-beauty contest game
with multiple rounds). In more recent work (Fe et al.,
2019) even more elaborate experiments are presented.
It is interesting that in the mentioned paper, experi-
ments are very strict and rigorous (as close to labo-
ratory purity as possible) in contrast to games played
in our research. However, at the end of the day, the
results do not differ very much.
As we know, there are not many works about game
theory experiments for children. In our previous work
(Ignatenko, 2020) we presented data from games with
participants 15-18 years old. There is a master thesis
(Povea and Citak, 2019), with the study of the behav-
ior of children aged 8-11 in a beauty contest game
with ten repetitions. The author found evidence that
children are able to play a beauty contest game using
not only cognitive skills but also empathy.
To deal with these problems, computer simula-
tion, mainly agent-based modeling ABM can be used.
Agent-based models are essentially a tool to discover
patterns in behaviors that emerge from simple rules –
micro behavior. Agent-based modeling for guessing
games is not a very developed area of research. For
example see paper (Nichols and Radzicki, 2007).
3 EXPERIMENTS SETUP
We claim that our setup is closer to reality than the
laboratory, and this is the point of this research: how
people learn under real-world situations. All games
were played under the following conditions:
1. Game was played during the lecture about the
game theory. Participants were asked not to com-
ment or discuss their choice until they submitted
it. However, this rule was not enforced, so usually,
they have this possibility if they wanted;
2. Participants were not rewarded for a win. The
winner was announced (so get some “good feel-
ings”), but no more;
3. During some early games, we used pieces of pa-
per, and we got some percentage of joking or
trash submission, usually very small. Later we
switched to google forms, which is a better tool
to control submission (for example, only natural
numbers are allowed).
4. Google forms give a possibility to make multiple
submissions (with different names) since we did
not have time for verification, but a total number
of submissions allows us to control that to some
extent.
The aim of this setup was to free participants to
explore the rules and give them the flexibility to make
a decision in an uncertain environment. We think it is
closer to real-life learning without immediate rewards
than laboratory experiments. Naturally, this setup has
strong and weak sides. Let us summarize both.
The strong sides are:
1. This setup allows to measure how people make
decisions in “almost real” circumstances and un-
derstand the (possible) difference with laboratory
experiments;
2. These games are part of an integrated approach to
active learning, when games are mixed with ex-
planations about concepts of game theory (ratio-
nality, expected payoff, Nash equilibrium), and
they allow participants to combine experience
with theory;
3. Freedom and responsibility. The rules do not reg-
ulate manipulations with conditions. So this setup
allows (indirectly) to measure the preferences of
players: do they prefer to cheat with rules, choose
random decisions without thinking or put effort
into solving the task;
4. During the 2020-2021 years, lectures were mainly
online. That fact brings new challenges for our
experiments, but since we initially rely on google
spreadsheets for gathering the answers, all rou-
tines remain mainly the same.
Weak sides are:
1. Some percentage of players made “garbage” de-
cisions. For example, choose the obviously worse
choice to spoil efforts for others;
2. Kids has (and often use) the possibility to talk out
decision with the neighbors;
3. Sometimes participants (especially kids) lost con-
centration and did not think about the game but
made a random choice or did not make decisions
at all;
4. Even for the simplest rules, sometimes partici-
pants failed to understand the game the first time.
We suppose it is due to conditions of lecture with
(usually) 30-40 persons around;
5. Still, we should note that online lectures are less
involving. It is demotivating for a lecturer not to
see listeners and also demotivating for students to
listen to lectures online.
3.1 Rules
In this paper, we concentrate on the p-beauty contest.
The winning number is the closest to p of average.
As usual, p = 2/3, but we have used other setups as
well (for clarity, we omit data from that games in this
How Concept Learning Changes Strategic Choice in Guessing Games?
709

analysis). Participants are asked to choose an integer
number in the range 1 – 100, margins included. Note
that some setups investigated in references use a range
starting with 0. However, the difference is negligible.
To provide quick choice calculation, we have used a
QR code with a link to google form, where partici-
pants input their number. All answers were anony-
mous (players indicated nicknames to announce the
winners, but then all records were anatomized).
4 RESULTS AND DATA ANALYSIS
In this section, we present a summary of data gathered
during the games. A summary of the results of the
game is given in table 1. Columns descriptions are:
• id is the id of the experiment;
• type is the type of group. Alternative H and M
are for alternative schools (not in the governmen-
tal system) with humanitarian and mathematical
directions, respectively. Math lyceum also goes
for summer camps with participants from differ-
ent lyceums;
• age is the approximate age of participants, only
indicated for children, to distinguish possible bor-
derline between stages of strategic reasoning;
• round is the round of the game;
• average is the average of choices;
• winning number is the average * 0.66;
• zlevel is the percent of players, choosing numbers
bigger than 50. It is an estimation of 0-level play-
ers in this round. As one can expect, it is declining
with round;
• median is the median of choices (sometimes it is
more informative than average);
• count is the number of choices;
• irrationality is the percent of choices wider than
90.
First, we observe statistics of choices for different
types of participants.
As we can see from the plot (figure 1) some setups
have one round, some two and two cases have three
rounds. It was limited by format (popular scientific
lecture), so we can only safely compare two rounds.
Almost all winning numbers fall (roughly) in
the experimental margins, obtained in (Nagel, 1995).
With winning number no more significant than 36 and
not smaller than 18 in the first round. Two exceptions
in our experiments were Facebook online game (15.3)
when players could read information about the game
in, for example, Wikipedia. Moreover, Another is the
alternative humanitarian school (40.1), where partici-
pants seem did not get the rules the first time.
4.1 Metrics and Analysis
The first metric to observe is the percent of “irrational
choices” – choices that cannot win in (almost) any
case. Let us explain, imagine that all players will
choose 100. It is impossible from practice but not for-
bidden. In this case, everybody wins, but if only one
player deviates to a smaller number – he/her will win,
and others will lose. So playing numbers bigger than
66 is not rational unless one does not want to win.
Furthermore, here we come to an important point,
in all previous experiments, this metric drops in the
second round and usually is very low (like less than
5%) (Ho et al., 1998). However, in our case, there
are experiments where this metric becomes higher or
changes very slightly. Moreover, initially, values are
much higher than expected. So here, we should in-
clude the factor of unique behavior; we can call it “let
us show this lecturer how we can cheat his test!” what
is more interesting – is that this behavior is more ap-
parent in the case of an adult than in kids.
It is also interesting to see a distribution of choices
for different groups. We can summarize choices on
the histograms (figure 2). Using models of strate-
gic thinking, we will adopt the theory of k-levels.
According to this idea, 0-level reasoning means that
players make random choices (drawn from a uniform
distribution), and k-level reasoning means that these
players use the best response for the reasoning of the
previous level. So 1-level reasoning is to play 33,
which is the best response to the belief that the av-
erage will be 50, 2-level is the best response to the
belief that players will play 33, and so on.
As we can see from the diagram (figure 2), some
spikes in choices are predicted very well, but it de-
pends on the background of the players. The best
prediction is for the Data Science conference atten-
dees, which presume a high level of cognitive skill
and computer science background.
On figure 3, we can see boxplots defined by sev-
eral players with different levels of perception for
different types of players. We compare here ordi-
nary schools and mathematical lyceums. Levels are
defined in the following subsection, but we can see
a pattern of behavior. The number of “irrational”
(choices with big numbers) is decreasing, so as “next-
to-win-but-bigger” numbers. Several 2-level reason-
ing, especially after explaining the equilibrium con-
cept, is growing substantially, while some “too smart”
choices from [1, 5] are more or less the same.
AET 2021 - Myroslav I. Zhaldak Symposium on Advances in Educational Technology
710

Table 1: Summary of first game for id of experiment and type of players. Explanation of columns is in the text
Id Type Age Round Average Winning Zlevel Median Count Irrationality
1 Alternative H 12-14 1 66.7 44.5 69.23 78 13 46.15
1 Alternative H 12-14 2 3.91 2.61 0 3.5 12 0
2 Alternative M 12-14 2 42.82 28.54 23.52 45.0 17 0
2 Alternative M 12-14 2 24.37 16.24 0 26.5 16 0
3 Adults 1 40.57 27.05 31.57 40.0 19 5.26
4 Alternative H 12-14 1 52.54 35.03 63.63 55 11 9.09
4 Alternative H 12-14 2 15.41 10.27 8.33 6 12 8.33
5 Adults 1 22.98 15.32 11.76 17.0 102 0
6 TechSchool 16-18 1 43.41 28.94 35.29 45.0 51 3.92
6 TechSchool 16-18 2 46.5 30.99 35.48 29.0 62 32.25
7 Math lyceum 16-18 1 30.58 20.38 16 27.5 50 2.0
7 Math lyceum 16-18 2 14.26 9.5 5.26 7 57 5.26
8 Math lyceum 15-16 1 37.06 24.71 20.68 33.0 29 3.44
8 Math lyceum 15-16 2 26.20 17.47 10.34 17.0 29 6.89
9 Math lyceum 14-16 1 42.0 27.99 44.44 42.5 18 11.11
9 Math lyceum 14-16 2 23.1 15.39 5.0 19.0 20 0
10 Ordinary school 14-16 1 48.69 32.46 46.15 46.5 26 0
10 Ordinary school 14-16 2 19.78 13.18 0 22.0 23 0
11 DS conference 1 37.25 24.83 28.33 33.0 60 8.33
11 DS conference 2 21.44 14.29 15.78 9.0 57 12.28
12 Students 1 42.40 28.27 33.33 40.0 27 3.7
13 Students 1 27.37 18.24 12.5 25.5 8 0
13 Students 2 8.62 5.74 0 8.5 8 0
14 Math lyceum 14-16 1 41.05 27.37 22.22 35.0 18 11.11
14 Math lyceum 14-16 2 17.23 11.49 5.88 13.0 17 0
15 Adults 1 34.32 22.88 20.73 30.0 82 1.21
15 Adults 2 12.48 8.32 2.19 8.0 91 2.19
16 Adults 1 43.05 28.70 33.96 40.0 53 1.88
16 Adults 2 14.69 9.79 1.88 11.0 53 1.88
17 Adults 1 50.33 33.55 41.66 50.0 12 8.33
17 Adults 2 13.50 8.99 0 12.0 46 0
18 Math lyceum 14-16 1 41.72 27.81 36.36 37.0 11 9.09
18 Math lyceum 14-16 2 26.36 17.57 0 30.0 11 0
19 Math lyceum 14-16 1 29.43 19.62 13.63 25.0 44 0
19 Math lyceum 14-16 2 27.25 18.16 20.45 9.5 44 20.45
20 Students 1 30 19.9 5.2 27 19 0
20 Students 2 24.9 16.6 20 11.5 20 15
21 Ordinary school 14-16 1 43 28.7 33.9 40 53 1.88
21 Ordinary school 14-16 2 14.7 9.7 1.88 11 53 1.88
Interesting hypotheses that need to be tested in de-
tail can be formulated: Higher number of choices
from [50, 100] in the first round leads to the higher
number of choices from [1, 5] in the second round
and vice verse. We can support this hypothesis with
the following plot (figure 5).
Another metric (G
¨
uth et al., 2002) is how much
winning choice in the second round is smaller than in
the first. Due to multi-level reasoning, every player
in this game is trying their best to win but can’t do
all the steps to winning. So there are players who
have 0-level reasoning. They choose random num-
bers. First-level players choose 33, which is the best
response for players of 0-level and so on. Based on
the result of the first round and, in fact, an explana-
tion of the Nash equilibrium, players must know that
it is better to choose much lower numbers. However,
the graph shows that the decrease is quite moderate.
Only students show good performance in this matter.
Moreover, the tech school shows a (small) increase in
winning number in the second round!
How Concept Learning Changes Strategic Choice in Guessing Games?
711
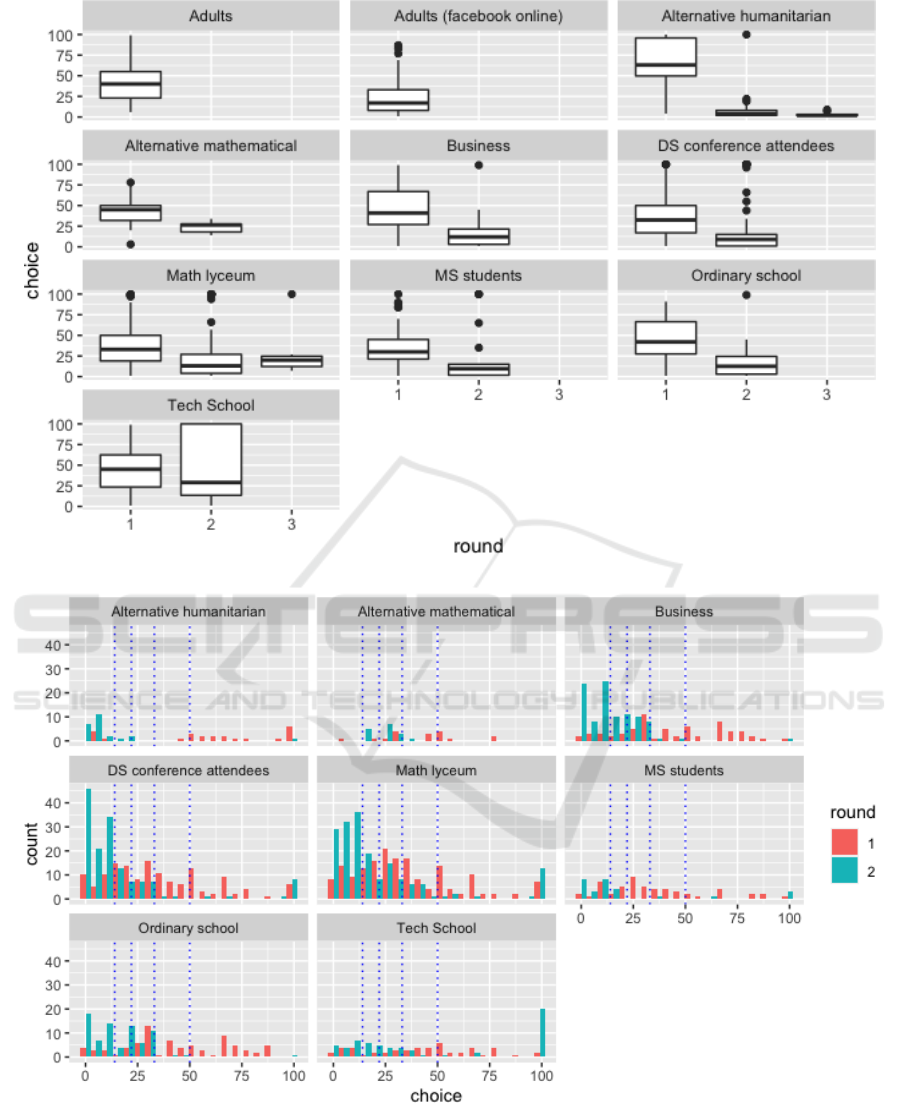
Figure 1: Histogram of choices for each round.
Figure 2: Histogram of choices for each round.
4.2 Levels of Reasoning Snalysis
Another point about the learning process in this game
is how players’ decisions are distributed over the
space of strategies. We claim that there is a distinct
difference in changes between the first and second
rounds for different groups. To perform this analysis,
we apply the idea of k-level thinking.
AET 2021 - Myroslav I. Zhaldak Symposium on Advances in Educational Technology
712
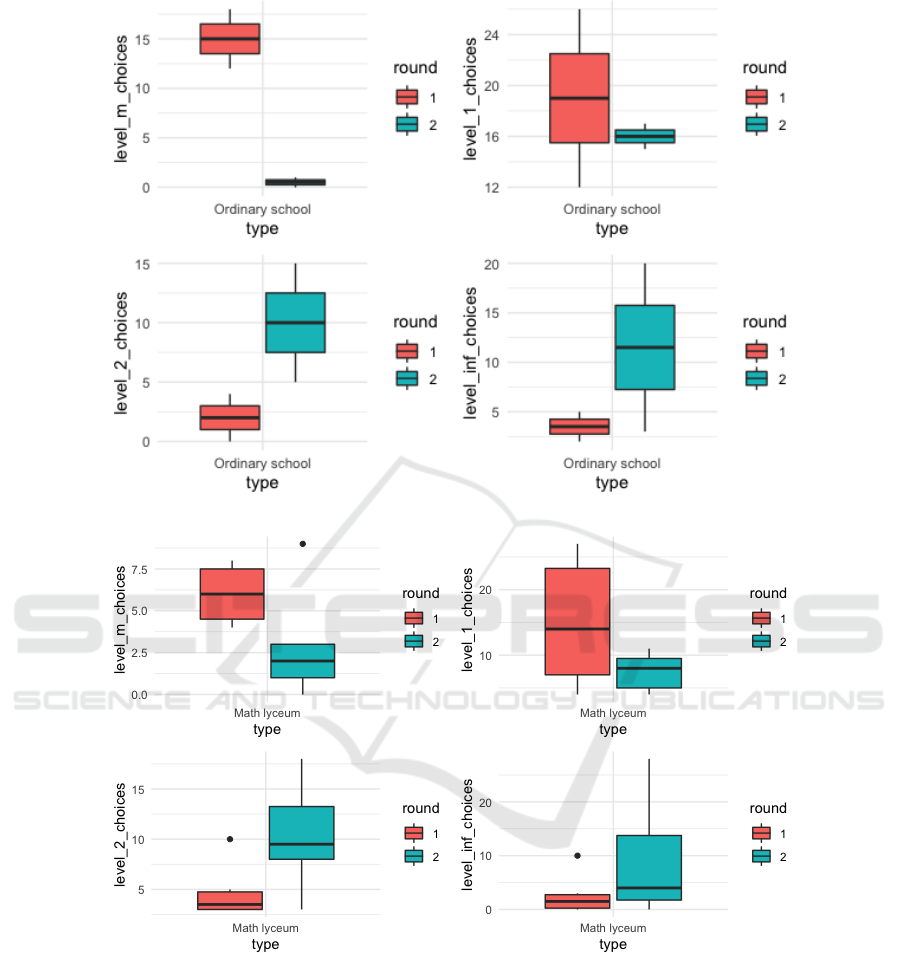
Figure 3: Change in winning number for number of ordinary schools participants.
Figure 4: Change in winning number for number of mathematical lyceums schools participants.
To find differences, we need to simplify this ap-
proach. First, we define b-level players players who
choose numbers from the range [50, 100]. Beginner
players who do not understand rules (play randomly)
or do not expect to win or want to lose intentionally
(for reasons discussed above). The substantiation for
such a range is that numbers above 50 did not win
in any game. Second level we call m-level, it is for
range [18, 50]. It is for players with middle levels of
reasoning. The first-round winning number is usually
in this range (and in part of the second rounds). Third
level is h-level, it is for range [5, 18]. It is for high
level reasoning and finally inf-level ([1, 5] range) is
for “almost common knowledge” level of thinking.
By calculating the number of levels for each game,
we can estimate change (in the percentage of the num-
ber of players) in adopting different strategy levels.
What conclusions can we draw from this data?
There are no clear differences in changes, but at least
we can summarise a few points:
How Concept Learning Changes Strategic Choice in Guessing Games?
713

Figure 5: Choices number in [1, 5] range and in [50, 100] range by rounds and type.
Table 2: Summary of change in strategy levels
Type b-difference m-difference h-difference inf-difference
Alternative humanitarian -72 -8 0 72
Alternative mathematical -24 -6 30 -6
Alternative humanitarian -52 0 17 43
Math lyceum -9 -36 24 34
Math lyceum -10 -24 28 7
Ordinary school -49 12 20 4
DS conference attendees -14 -32 14 27
MS students -12 -50 50 12
Alternative mathematical -17 -34 23 23
DS conference attendees -17 -30 23 35
Business -32 -17 21 28
• Usually after first round and equilibrium concept
explanation there is decrease in b-level and m-
level;
• Symmetrically, there is an increase in two other
levels, but sometimes it is more distributed, some-
times it is (almost) all for inf-level;
• the Last situation is more likely to happen in
schools, where kids are less critical of new knowl-
edge;
• Usually second round winning choice in the realm
of h-level, so groups with the biggest increase in
this parameter are the ones with better understand-
ing.
Another possible approach to the measurement
of irrationality is to calculate the percent of choices
wider than 50 (quite low chances for the win) and the
percent of choices wider than 90 (no chances to win).
We can see an interesting picture when we plot these
metrics for different types.
As we can see here, there is a nice direct line of
green dots of unknown nature. And all red dots are
gathered below. This is interesting dependence that
needs to be investigated in detail.
4.3 Size and Winning Choice
This game is indeed rich for investigation. Let us for-
mulate the last (in this paper) finding of this game.
Can we in some way establish the connection between
the number of players and the winning number (actu-
ally with strategies players choose during the game)?
To clarify our idea, see at figure 7. It is a scattered
plot of a two-dimensional variable; the x-axis is for
the number of participants in the game, and the y-axis
is for the winning choice per round. Different colors
are for different types of groups where games were
played.
As we can observe, the first and second rounds
form two separate clusters. This situation is expected
AET 2021 - Myroslav I. Zhaldak Symposium on Advances in Educational Technology
714
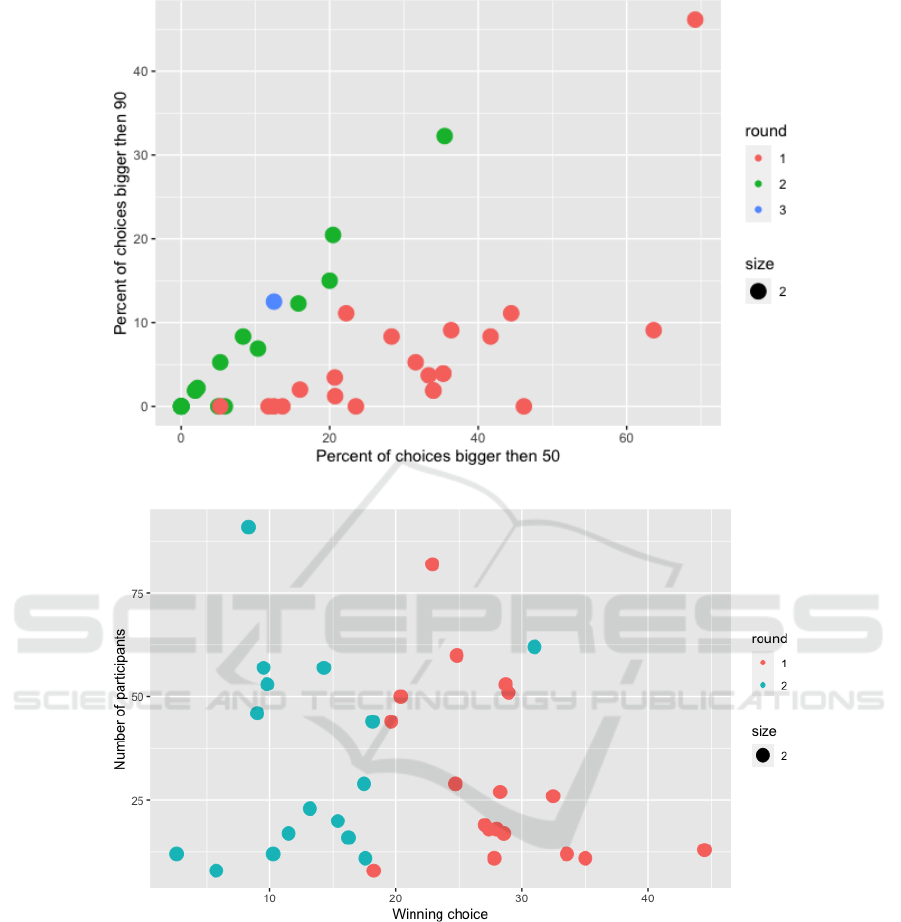
Figure 6: Irrationality of participants.
Figure 7: Change in winning number for number of participants.
and informs us that players learn about the equilib-
rium concept between rounds and apply it to practice.
Also, there is a mild tendency for smaller groups to
have bigger winning numbers. At least the variation
is more significant.
This is yet too bold to formulate a connection be-
tween the size of the group and the winning number,
but probably the reason is that when the size of the
group is bigger, the number of “irrational” players in-
creases. It can be due to some stable percentage of
such persons in any group or other reasons, but it is
an exciting connection to investigate.
4.4 Intentionally Irrational?
Another interesting finding is that after the first round
finished, observing the result and listening explana-
tion about the NE number of players who choose over
90 (it is an non-winning choice) increases. It is not ac-
cidental; data from (Povea and Citak, 2019) also show
an increase in 2-5 rounds. We believe that this is quite
an important part of the play. This phenomenon is
evident in high school children with solid math back-
grounds (usually, they have more freedom and self-
confidence in choosing non-standard strategies).
How Concept Learning Changes Strategic Choice in Guessing Games?
715

All experimental data and R files for graphs can
be accessed in the open repository (Ignatenko, 2021).
5 AGENT-BASED MODEL
The existence of irrational behavior challenges the ba-
sic game-theoretic assumption about self-interest and
the capability to calculate the best option. In other
words, real people do not think like machines or algo-
rithms. They form hypotheses or expectations using
simple rules. These rules are influenced by emotions
and social norms and can be changed depending on
feedback (reinforced). This use of inductive reason-
ing leads to two issues. First, what rules that people
follow? Second, suppose we know these rules. How
do we model the behavior of many interacting, het-
erogeneous agents in that situation? We start with the
definition of agents and the formulation of rules of
their behavior.
So we have agents of one type – players. Each
agent has three variables: level of thinking (cur-
rent level of reasoning), choice (a current number he
chooses), and Boolean variable irrational, which is
true or false.
Also, we define interface parameters, which de-
fine the setup of players. First of all, it is the number
of players. We can also define the percentage of level
0 players, p of the game, and irrational setup, which
will be explained later.
The setup of the game is following:
1) creates several players;
2) defines the level of reasoning for each player us-
ing the formula: level-0 percent from the inter-
face, 100 – level-0 is divided into three parts. Two
parts are level-1 reasoning, and one part is level-2
reasoning;
One round of the game proceeds in the following
way:
1) each player chooses a number using their level
of reasoning and some randomization. Basically,
player with k level generates normal variable with
mean 50 ∗ p
k
if k > 0 and k ≤ 4. If k = 0, the
choice is uniformly random from 1 to 100. When
k = 5, the choice is 1 (this is an infinity level of
reasoning);
2) if the player is irrational, he chooses 100. It is
to model irrational behavior that can be observed
from experiments;
3) the winner is calculated using the game formula;
4) players, with a choice wider than the winning
number, increase their understanding level by 1.
If the level is already equal to 5, it remains the
same;
5) if the player is not winner, he becomes irrational
with some small probability if boolean variable ir-
rational is on.
The model is available in COMses library of Net-
logo models. To measure experiments data we use
BehaviorSpace tool with following parameters:
["percent-level-0" [50 5 100]]
["num-players" [10 10 100]]
["irrational1" false true]
["p" 0.66]
Here [10 10 100] means we launch simulation for
10, 20, and so on several players. On each step, we
wrote to file the choices of players. 10 steps limited
each particular games. In total, we had 11000 runs.
Epstein (Epstein, 1999) defines following charac-
teristics of agent-based model:
1) heterogeneity; agents are different in some ways;
2) autonomy; each agent make own decisions;
3) explicit space; agents interact in a given environ-
ment;
4) local Interaction; agents generally interact with
their neighbors and immediate environment.
5) bounded Rationality; agents have limited infor-
mation and computing power. Agent behavior
is generated by simple rules that may adapt over
time;
6) non-equilibrium dynamics.
In this model, we consider only five levels, where
level 5 means common knowledge when a player
chooses 1. When no irrationality is in the model, we
can observe typical convergence to equilibrium (fig-
ure 8) left, and this is a stable pattern.
But as we already know from the experiments, it
is not what we can observe in real life. So irrational
behavior was included to meet the pattern from the
data. Irrationality in our model is implemented as
’anger’ when a player who is currently a loser some-
times goes to irrational mode and chooses 100 in one
next round. This leads to an exciting pattern (figure 8)
right, when sometimes the winning number increases
in the second round, but convergence to equilibrium
is inevitable.
5.1 Data Analysis
In this section, we analyze data from simulations and
compare them to previous results. In the following
plot (figure 9) we can observe convergence towards
AET 2021 - Myroslav I. Zhaldak Symposium on Advances in Educational Technology
716

Figure 8: Plots of players win choice over round.
Figure 9: Plots of players win choice over round.
equilibrium. As expected volatility of choices is more
significant in smaller groups.
Now let us plot (figure 10) winning choice in the
first round compared to the winning choice in the sec-
ond round. As we can see, there is a big cluster around
(33,31). The color here is the initial percentage of
low-level players. High level means that almost all
players initially are randomizers, and then they learn
How Concept Learning Changes Strategic Choice in Guessing Games?
717
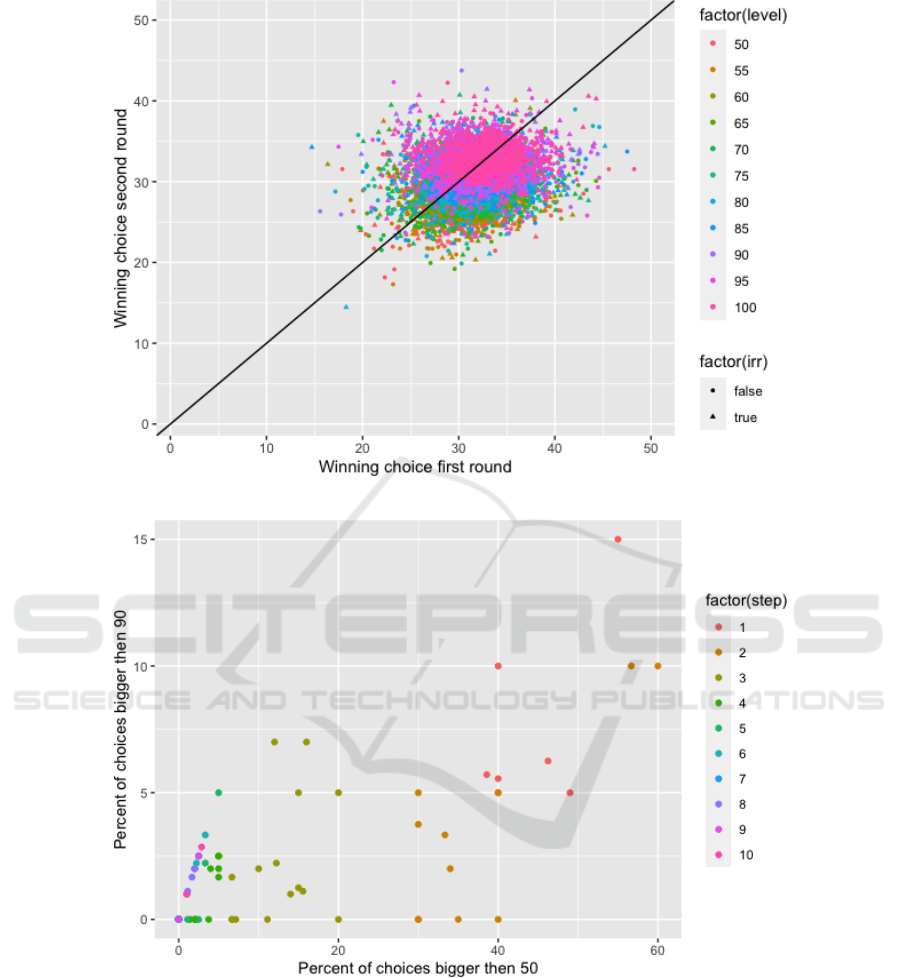
Figure 10: Plots of players win choice for first and second rounds.
Figure 11: Irrationality of players.
from round to round. A trim level allows for more
efficiency when points are like (30,20). This is quite
similar to human experiments data.
The next plot is about the irrationality of players.
It seems that there is a connection between the percent
of players who chooses numbers bigger than 90 and
the percent of players who chooses numbers bigger
than 50. It is very similar to figure 8 from experimen-
tal data. The reason, as we can understand it, is in
the nature of irrational behavior in games like the k-
beauty contest. It was a common situation when play-
ers at some point (we have data for round 2) lost hopes
of winning and just chose 100 for fun. At the same
time, the majority of players are still thinking strate-
gically and choose numbers around winning numbers
(20 – 30 range). This gives a characteristic line of dots
because, at some point, all players who chose num-
bers bigger than 50 are the players who chose 100.
AET 2021 - Myroslav I. Zhaldak Symposium on Advances in Educational Technology
718

6 CONCLUSIONS
In this paper, we have presented data from experi-
ments on the k-beauty contest game. We provide ac-
cess to raw data files and files with data manipulation,
metrics calculation, and plot building. This will hope-
fully support reproducibility in this area of research.
Then we discuss the results of the experiments and
provide an analysis and explanation of patterns of be-
havior. It seems possible to confirm the existence of a
pattern in decision-making – every group behaves al-
most the same way when dealing with an unknown
strategic situation. We can formulate findings in a
few short notes. First, participants have chosen not
winning moves (> 66) partly because of a new situ-
ation and trouble understanding the rules. However,
a high percentage of such choices was present in the
second round, when players knew what was going on.
This effect was especially notable in the cases of high
school and adults and almost zero in the case of spe-
cial math schools and kids below 9th grade. We can
hypothesizeesis that high school is the age of experi-
mentation when children discover new things ared do
not afraid to do so. Second, the winning number as
the decision of a group is decreasing in all cases, so
we can see that group is learning fast and steady. Even
if some outliers choose 100, the mean still declines
with every round. There seems to be an unspoken
competition between players that leads to improve-
ment in the aggregated decision even if no prize is at
stake. It is a plausible scenario when all participants
choose higher numbers. However, this did not hap-
pen in any experiment. Third, a a stable percent of
people choose about 100, and it is not about learning
how to play the game. We think this is something like
a -1 level of reasoning when the player intentionally
plays a “bad move”, and this is an essential part of the
model. If we neglect such persons and their motiva-
tion, our model will not be correct.
In the second part of the paper, we presented an
agent-based model using conclusions about human
behavior in the game. Simplification is the key to
building good ABM, so in the model, agents have
only a few parameters: level and irrationality. Based
on these two parameters, agents choose a number
on each step. Depending on other players’ choices
model determine winners and losers: this state influ-
ences agents’ future level and irrationality. We per-
form about ten thousand games (each ten rounds long)
and apply the same analysis as before. This approach
shows that in some aspects, agents’ behavior is close
to humans. Future investigation of this model will
concentrate on the following possible modifications:
• deterministic choices of agents;
• different numbers of reasoning levels;
• rewards and punishments as elements of learning;
• implementation learning models from current re-
search;
• build testing environment to automatically com-
pare different learning strategies.
REFERENCES
Aumann, R. and Brandenburger, A. (1995). Epis-
temic Conditions for Nash Equilibrium. Economet-
rica, 63(5):1161–1180. http://www.jstor.org/stable/
2171725.
Aumann, R. J. (1995). Backward induction and com-
mon knowledge of rationality. Games and Eco-
nomic Behavior, 8(1):6–19. https://doi.org/10.1016/
S0899-8256(05)80015-6.
Camerer, C. F. (2003). Behavioral game theory: Experi-
ments in strategic interaction. The Roundtable Series
in Behavioral Economics. Princeton University Press.
Camerer, C. F., Ho, T.-H., and Chong, J.-K. (2002). Sophis-
ticated experience-weighted attraction learning and
strategic teaching in repeated games. Journal of
Economic theory, 104(1):137–188. https://doi.org/10.
1006/jeth.2002.2927.
Camerer, C. F., Ho, T.-H., and Chong, J.-K. (2004). A cog-
nitive hierarchy model of games. The Quarterly Jour-
nal of Economics, 119(3):861–898. https://doi.org/10.
1162/0033553041502225.
Costa-Gomes, M., Crawford, V. P., and Broseta, B. (2001).
Cognition and Behavior in Normal-Form Games: An
Experimental Study. Econometrica, 69(5):1193–
1235. https://doi.org/10.1111/1468-0262.00239.
Crawford, V. P., Costa-Gomes, M. A., and Iriberri, N.
(2013). Structural models of nonequilibrium strategic
thinking: Theory, evidence, and applications. Journal
of Economic Literature, 51(1):5–62. https://doi.org/
10.1257/jel.51.1.5.
Epstein, J. M. (1999). Agent-based computational models
and generative social science. Complexity, 4(5):41–
60. https://cutt.ly/hKtpQa9.
Fe, E., Gill, D., and Prowse, V. L. (2019). Cognitive skills,
strategic sophistication, and life outcomes. Working
Paper Series 448, The University of Warwick. https:
//tinyurl.com/2p8jmnjn.
Gill, D. and Prowse, V. (2016). Cognitive Ability, Character
Skills, and Learning to Play Equilibrium: A Level-k
Analysis. Journal of Political Economy, 124(6):1619–
1676. https://doi.org/10.1086/688849.
G
¨
uth, W., Kocher, M., and Sutter, M. (2002). Experi-
mental ‘beauty contests’ with homogeneous and het-
erogeneous players and with interior and boundary
equilibria. Economics Letters, 74(2):219–228. https:
//doi.org/10.1016/S0165-1765(01)00544-4.
Ho, T.-H., Camerer, C., and Weigelt, K. (1998). Iterated
Dominance and Iterated Best Response in Experimen-
tal “p-Beauty Contests”. The American Economic
How Concept Learning Changes Strategic Choice in Guessing Games?
719

Review, 88(4):947–969. https://www.jstor.org/stable/
117013.
Ignatenko, O. (2020). Guessing Games Experiments in
School Education and Their Analysis. In Sokolov,
O., Zholtkevych, G., Yakovyna, V., Tarasich, Y.,
Kharchenko, V., Kobets, V., Burov, O., Semerikov,
S., and Kravtsov, H., editors, Proceedings of the
16th International Conference on ICT in Educa-
tion, Research and Industrial Applications. Integra-
tion, Harmonization and Knowledge Transfer. Vol-
ume II: Workshops, Kharkiv, Ukraine, October 06-10,
2020, volume 2732 of CEUR Workshop Proceedings,
pages 881–892. CEUR-WS.org. https://ceur-ws.org/
Vol-2732/20200881.pdf.
Ignatenko, O. P. (2021). Data from experiments. https://
github.com/ignatenko/GameTheoryExperimentData.
Kuhn, H. W., Harsanyi, J. C., Selten, R., Weibull, J. W.,
Van Damme, E., Nash Jr., J. F., and Hammerstein, P.
(1996). The work of John Nash in game theory. Jour-
nal of Economic Theory, 69(1):153–185.
Ledoux, A. (1981). Concours r
´
esultats complets. Les vic-
times se sont plu
`
a jouer le 14 d’atout. Jeux &
Strat
´
egie, 2(10):10–11.
Leyton-Brown, K. and Shoham, Y. (2008). Essentials of
game theory: A Concise, Multidisciplinary introduc-
tion. Synthesis lectures on artificial intelligence and
machine learning, 2(1):1–88. https://doi.org/10.2200/
S00108ED1V01Y200802AIM003.
Mauersberger, F. and Nagel, R. (2018). Levels of rea-
soning in Keynesian Beauty Contests: a generative
framework. In Hommes, C. and LeBaron, B., editors,
Handbook of Computational Economics, volume 4 of
Handbook of Computational Economics, pages 541–
634. Elsevier.
Moulin, H. (1986). Game theory for the social sciences.
New York Univeristy Press, New York, 2nd edition.
Nagel, R. (1995). Unraveling in Guessing Games: An Ex-
perimental Study. The American Economic Review,
85(5):1313–1326. https://www.cs.princeton.edu/
courses/archive/spr09/cos444/papers/nagel95.pdf.
Nagel, R., B
¨
uhren, C., and Frank, B. (2017). In-
spired and inspiring: Herv
´
e Moulin and the discov-
ery of the beauty contest game. Mathematical So-
cial Sciences, 90:191–207. https://doi.org/10.1016/j.
mathsocsci.2016.09.001.
Nichols, M. W. and Radzicki, M. J. (2007). An Agent-
Based Model of Behavior in “Beauty Contest” Games.
Working Paper 07-010, University of Nevada. https:
//www.researchgate.net/publication/23694542.
Povea, E. and Citak, F. (2019). Children in the beauty con-
test game: behaviour and determinants of game per-
formance. Master’s thesis, Norwegian School of Eco-
nomics. https://openaccess.nhh.no/nhh-xmlui/handle/
11250/2611651.
Wright, J. R. and Leyton-Brown, K. (2016). Models of
level-0 behavior for predicting human behavior in
games. CoRR, abs/1609.08923. https://doi.org/10.
48550/ARXIV.1609.08923.
Wright, J. R. and Leyton-Brown, K. (2017). Predicting
human behavior in unrepeated, simultaneous-move
games. Games and Economic Behavior, 106:16–37.
https://doi.org/10.1016/j.geb.2017.09.009.
AET 2021 - Myroslav I. Zhaldak Symposium on Advances in Educational Technology
720
